. 2021 Aug 19;184(17):4464-4479.e19.
doi: 10.1016/j.cell.2021.07.021. Epub 2021 Aug 11.

Erythroid mitochondrial retention triggers myeloid-dependent type I interferon in human SLE

Affiliations

Erythroid mitochondrial retention triggers myeloid-dependent type I interferon in human SLE

Simone Caielli et al. Cell. .

Abstract

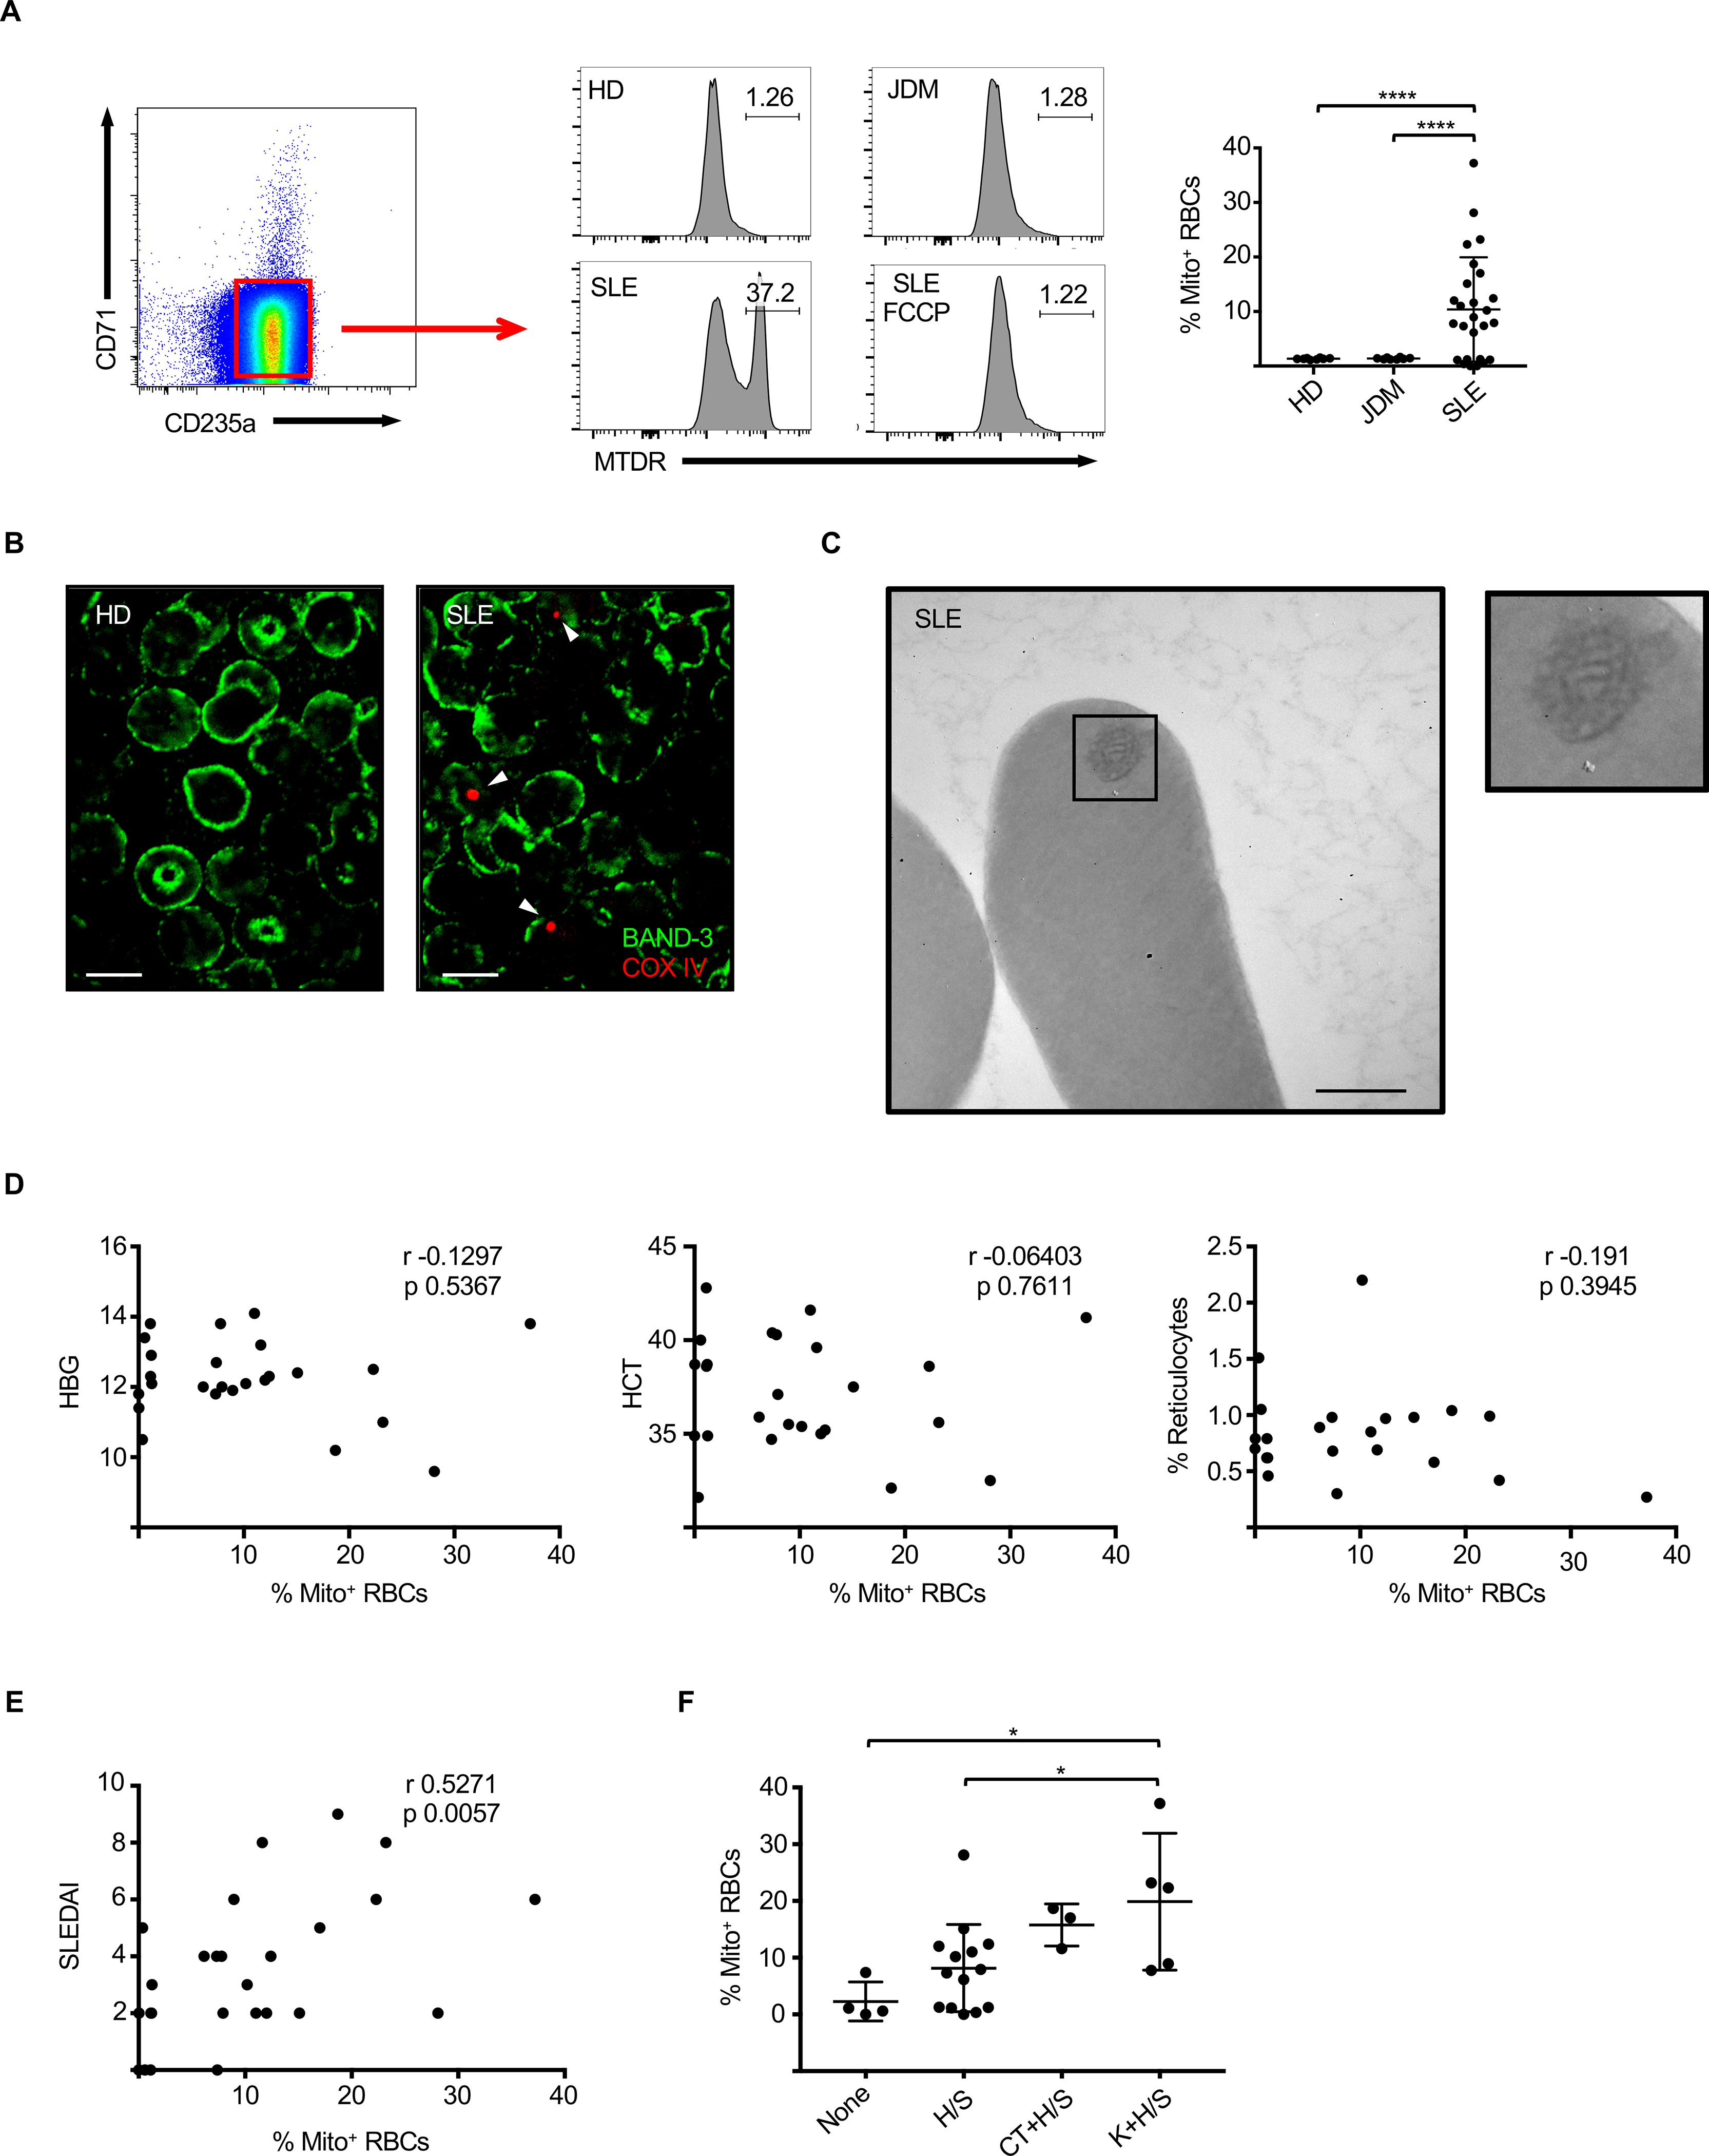
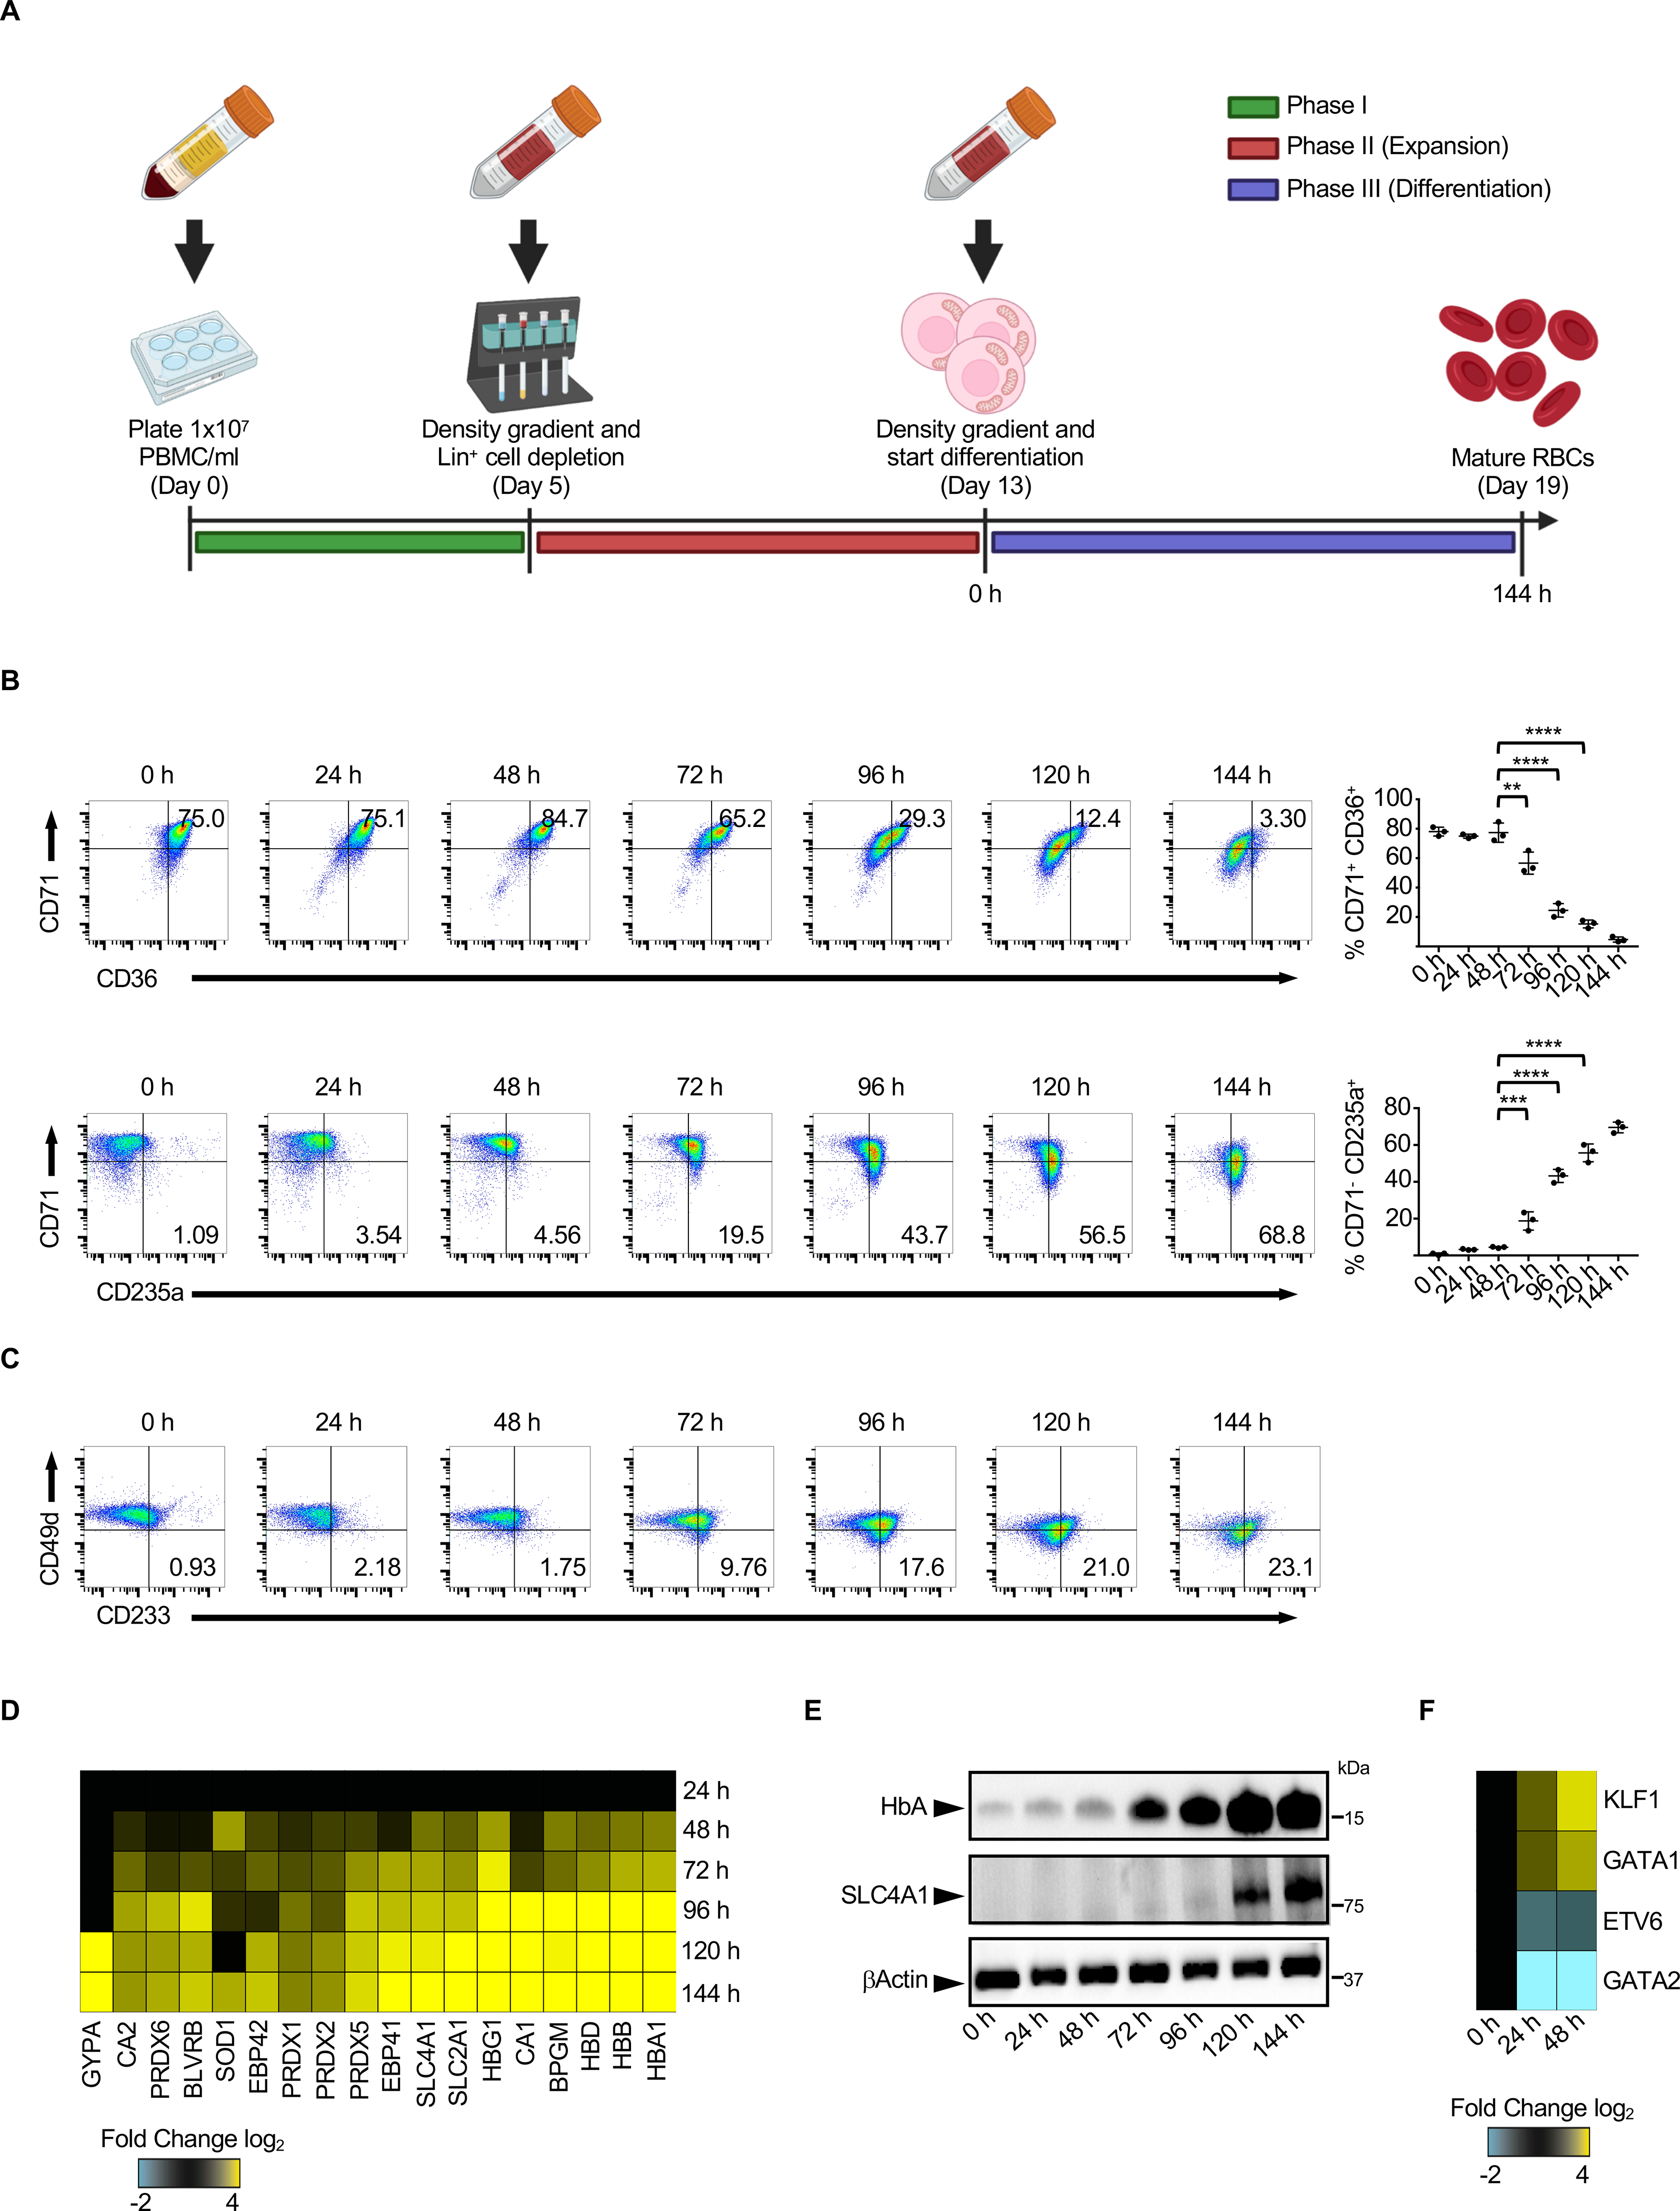
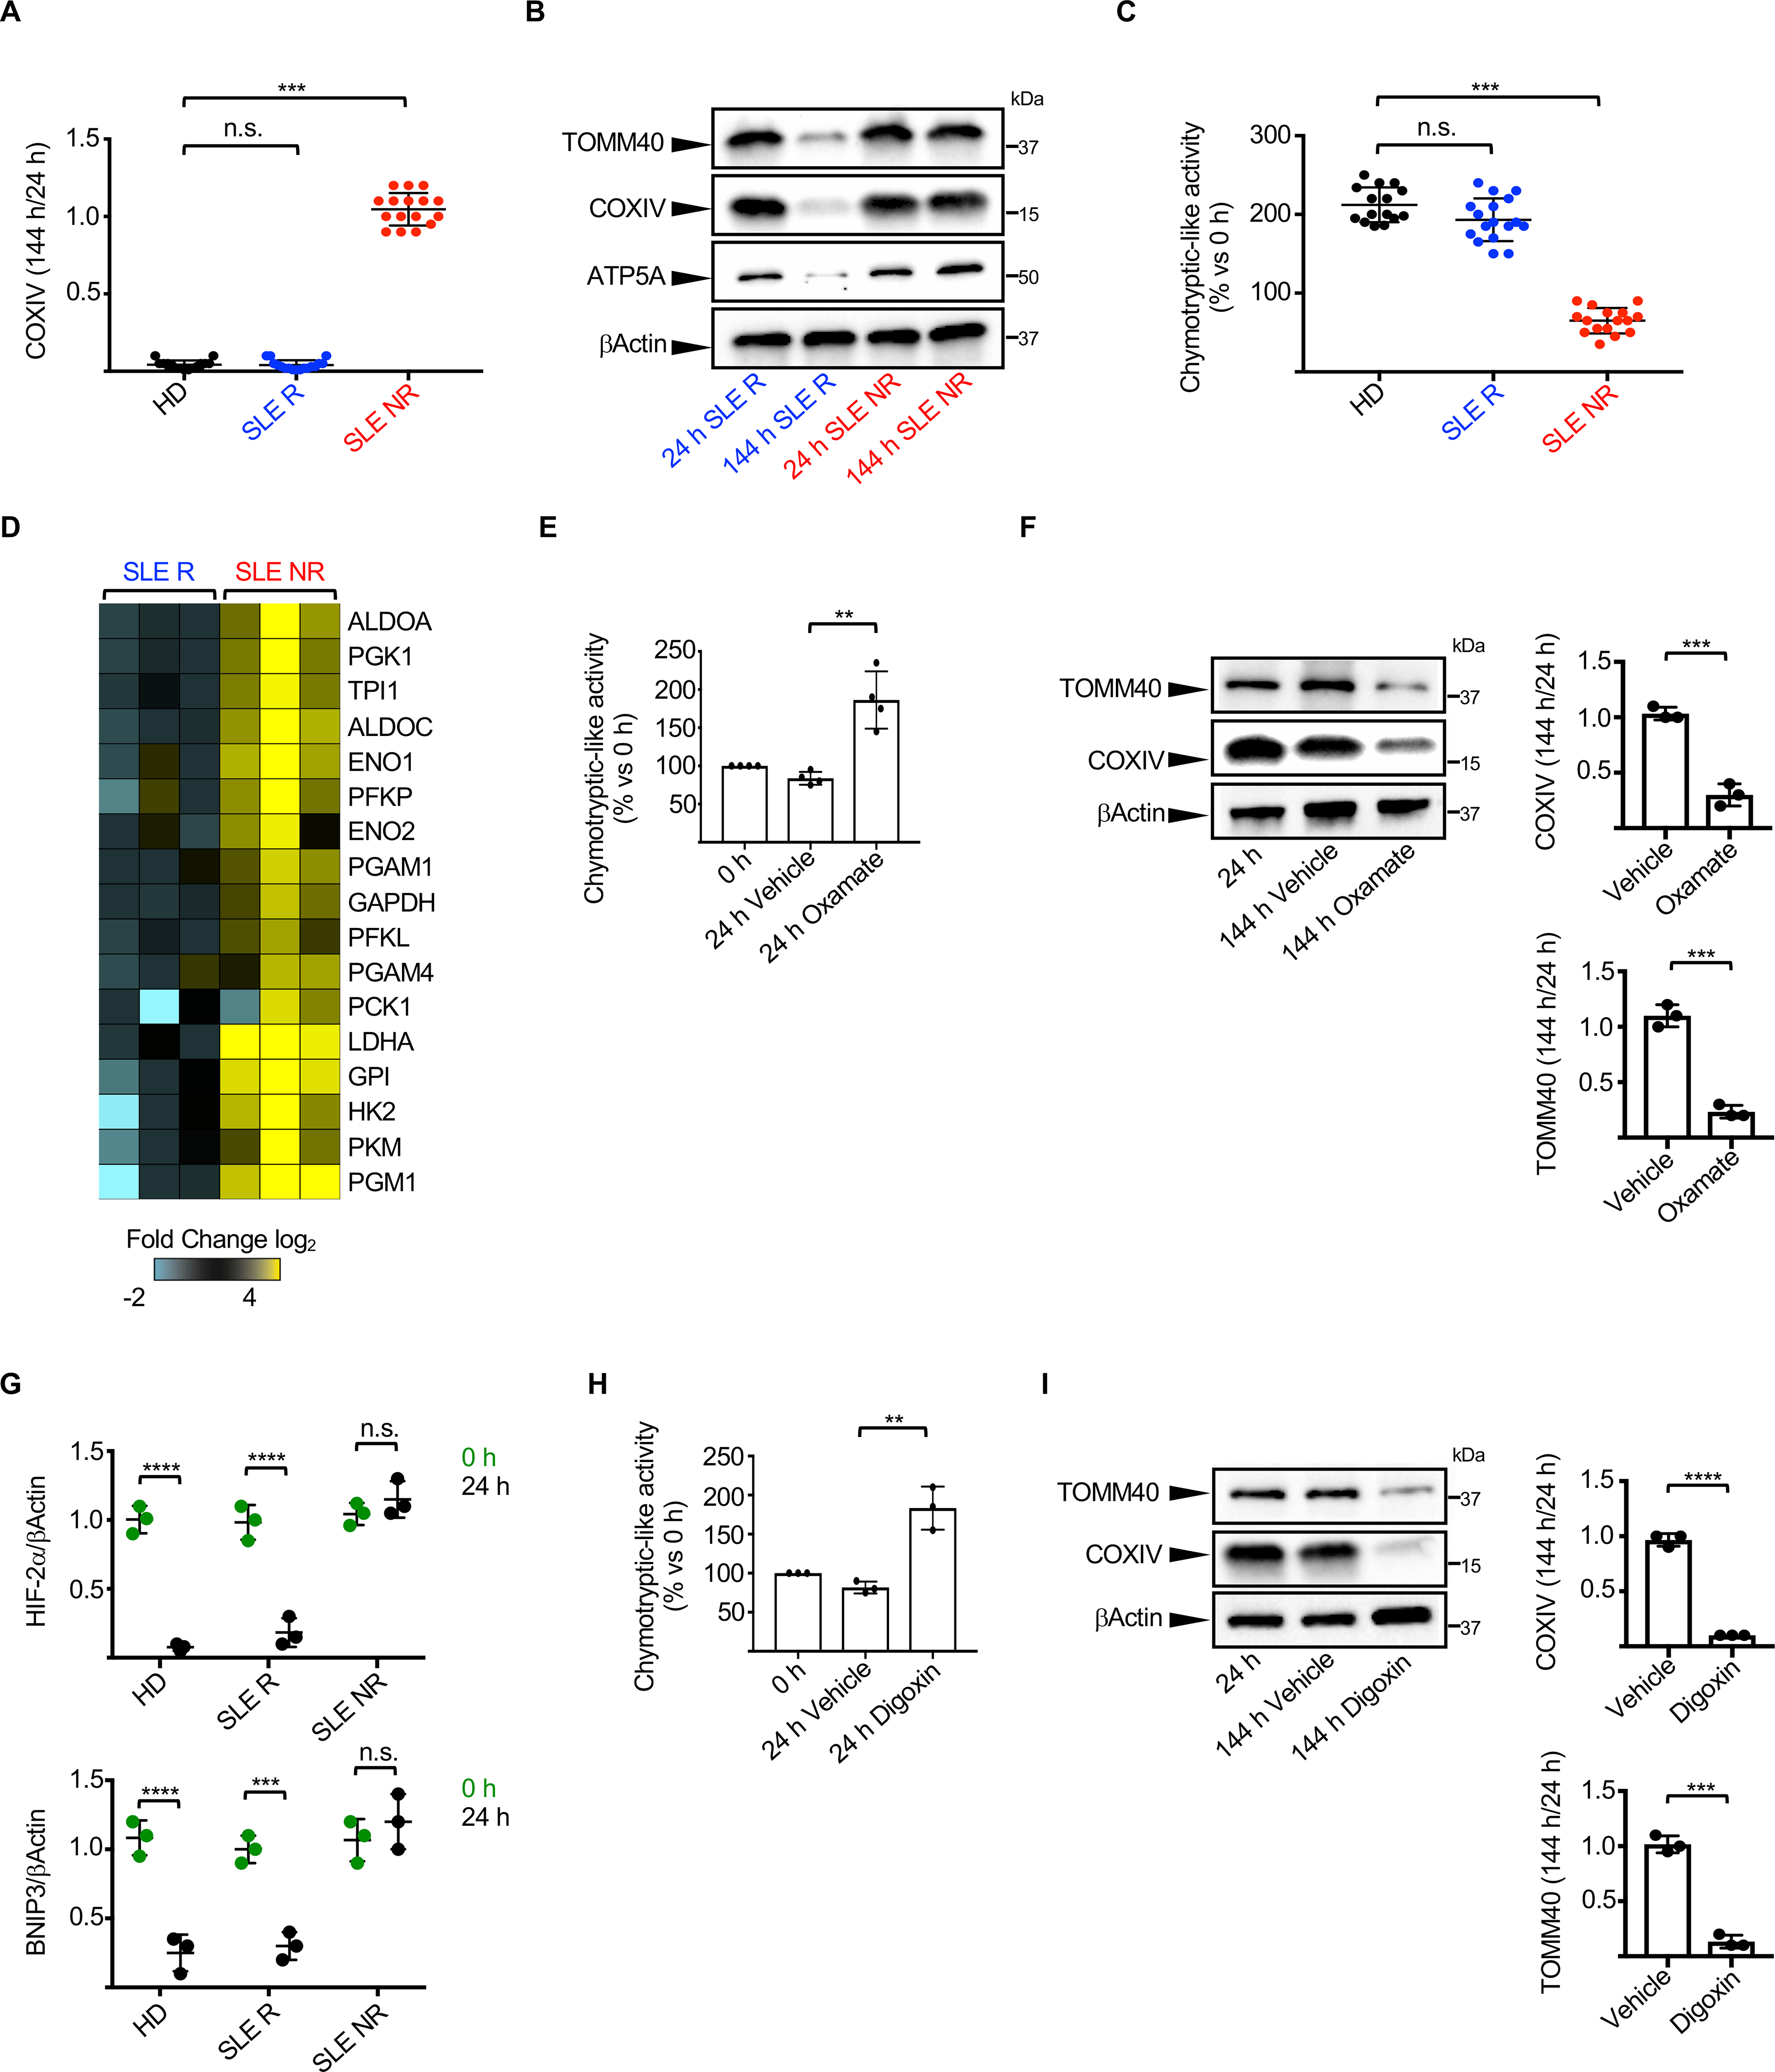
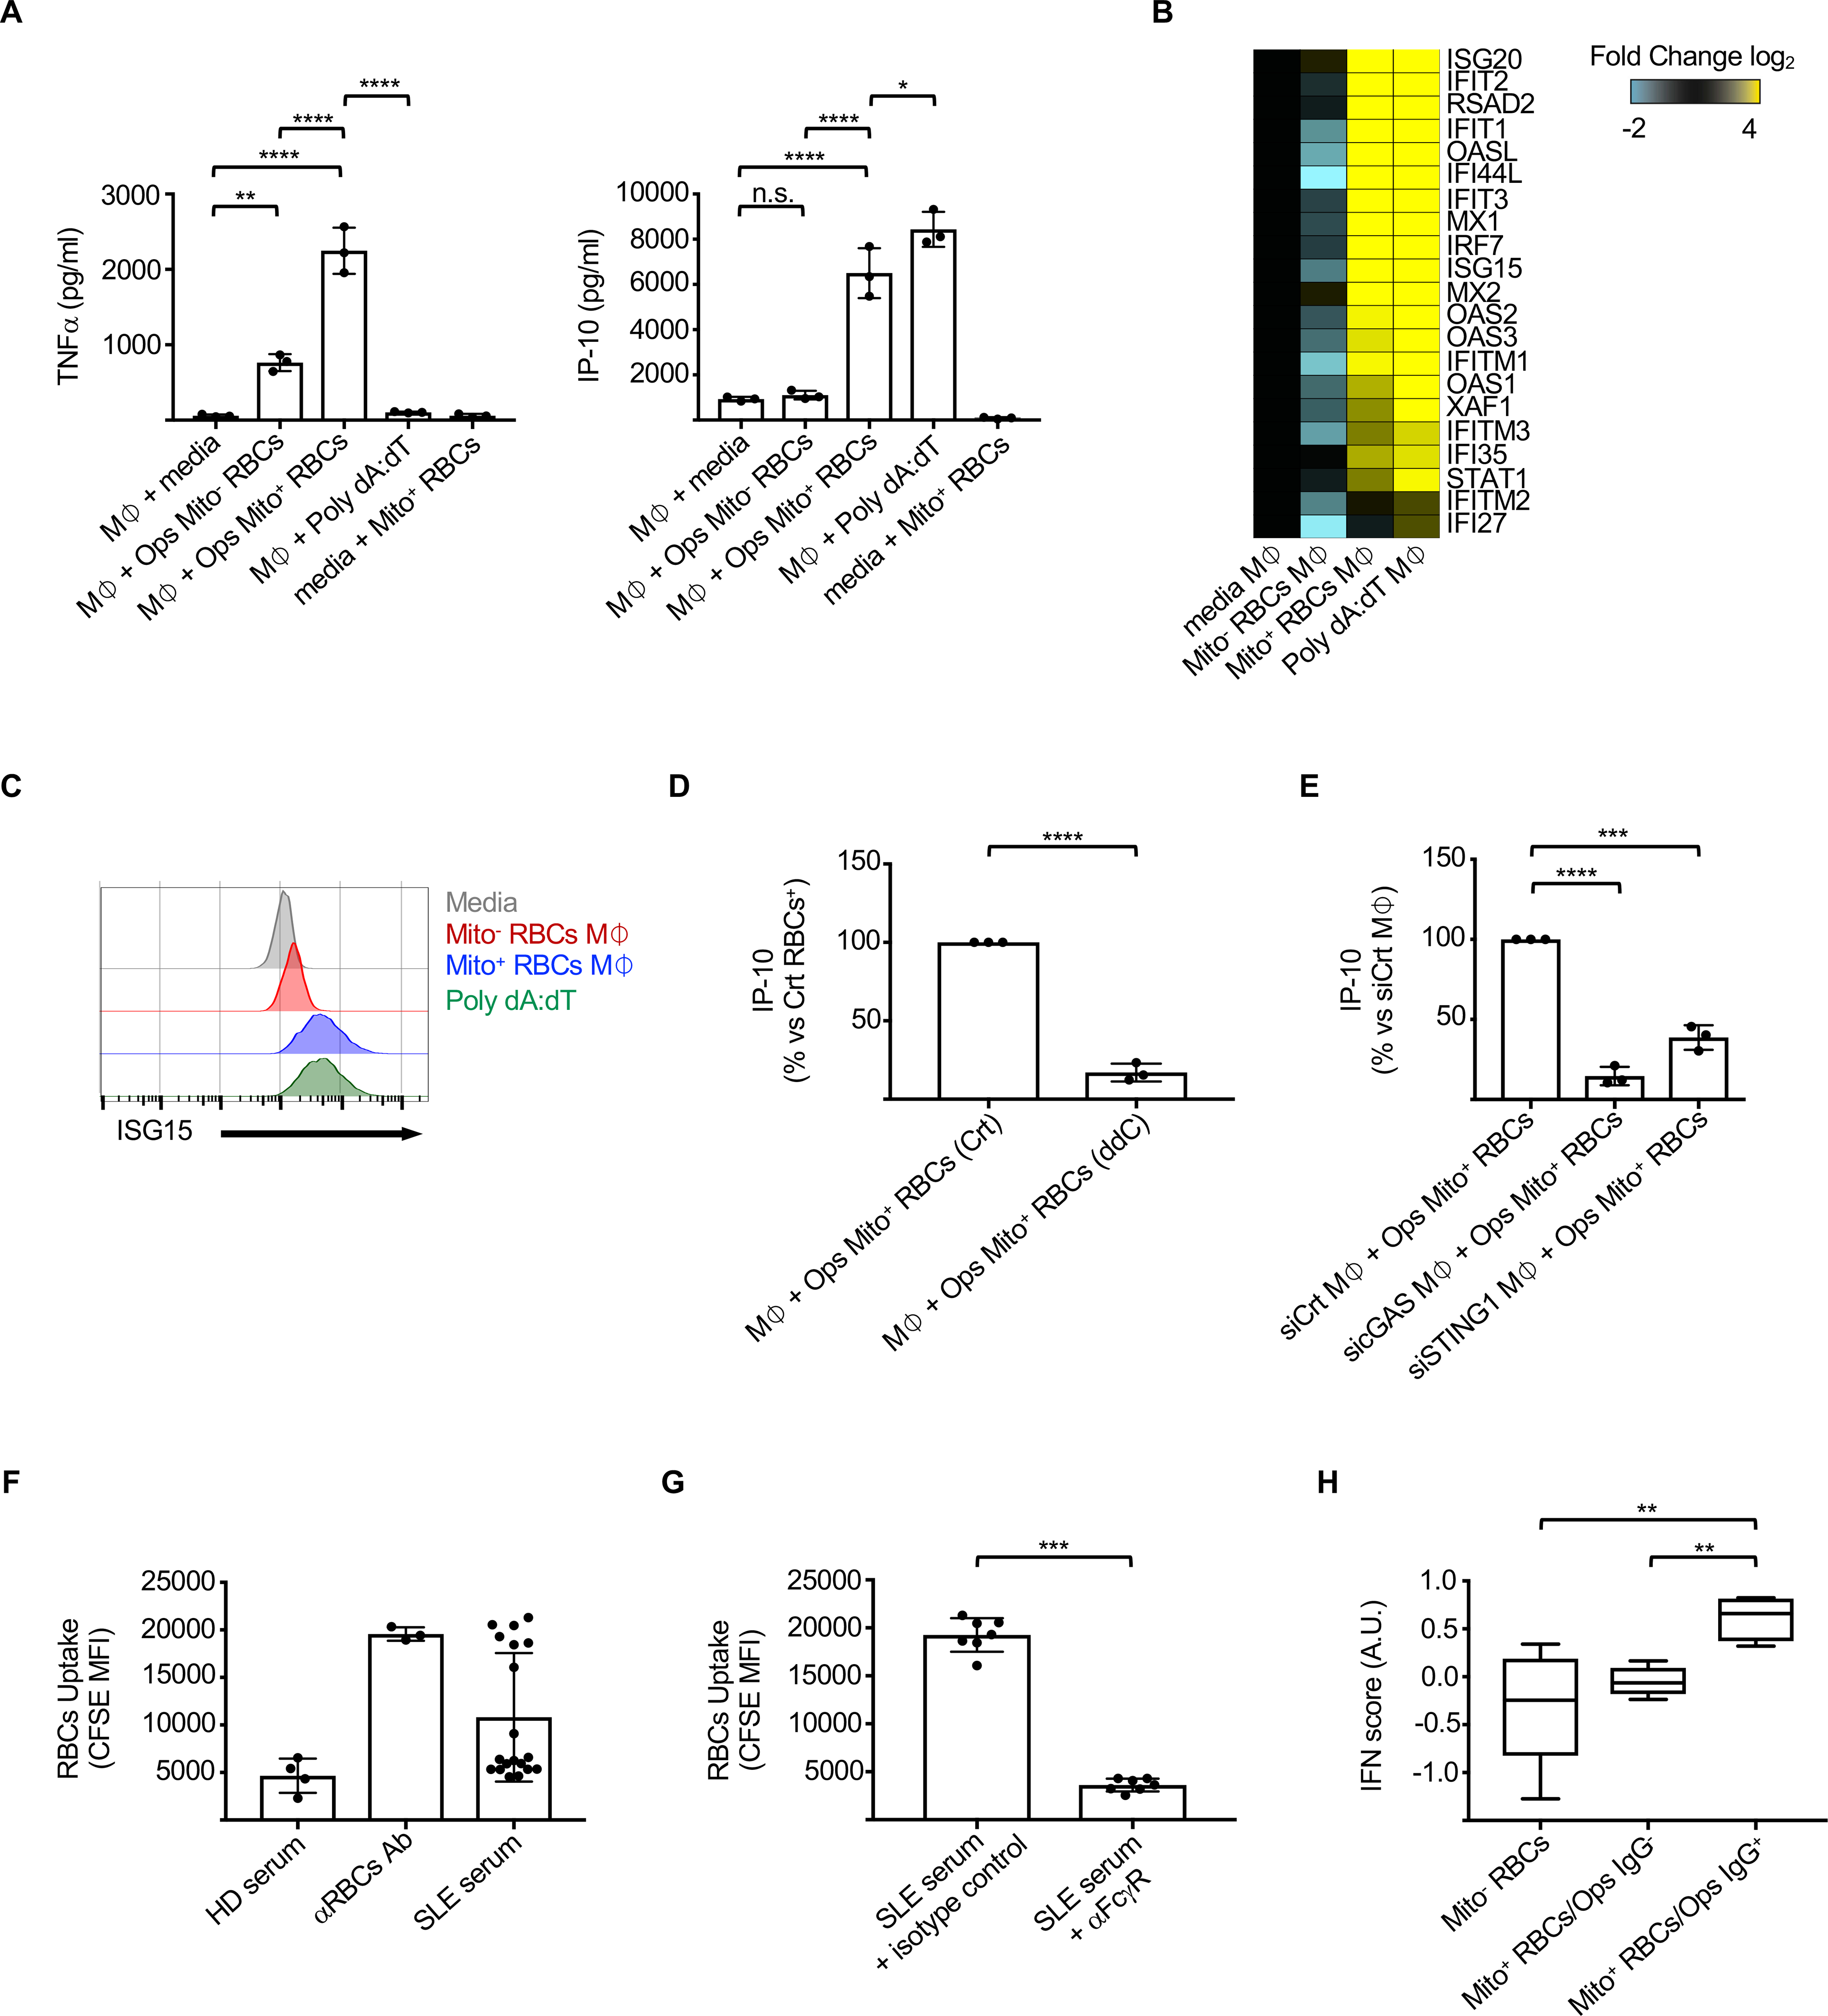
Emerging evidence supports that mitochondrial dysfunction contributes to systemic lupus erythematosus (SLE) pathogenesis. Here we show that programmed mitochondrial removal, a hallmark of mammalian erythropoiesis, is defective in SLE. Specifically, we demonstrate that during human erythroid cell maturation, a hypoxia-inducible factor (HIF)-mediated metabolic switch is responsible for the activation of the ubiquitin-proteasome system (UPS), which precedes and is necessary for the autophagic removal of mitochondria. A defect in this pathway leads to accumulation of red blood cells (RBCs) carrying mitochondria (Mito+ RBCs) in SLE patients and in correlation with disease activity. Antibody-mediated internalization of Mito+ RBCs induces type I interferon (IFN) production through activation of cGAS in macrophages. Accordingly, SLE patients carrying both Mito+ RBCs and opsonizing antibodies display the highest levels of blood IFN-stimulated gene (ISG) signatures, a distinctive feature of SLE.

Keywords: CANDLE syndrome; HIF2a; autoimmunity; cGAS; human erythropoiesis; interferon; mitochondrial DNA; mitophagy; proteasome; systemic lupus erythematosus.


Conflict of interest statement

Declaration of interests V.P. has received consulting honoraria from Sanofi, Astra Zeneca, and Moderna and is the recipient of a research grant from Sanofi and a contract from Astra Zeneca. J.F.B. is a member of the S.A.B. of Neovacs.

Figures

Figure 1.
Figure 1.. RBCs from patients with active SLE retain mitochondria.
(A) Representative FACS plot and quantification of mature RBCs (CD235a+ CD71 cells) that contain mitochondria (Mito+ RBCs) in HD (n=8), JDM (n=8) and SLE (n=26) patients. (MTDR - MitoTracker Deep Red; FCCP - p-trifluoromethoxyphenylhydrazone; HD – Healthy donor). (B) RBCs Mature RBCs were isolated from HD and SLE and immunostained for the mitochondrial marker COXIV and the mature RBCs marker Band-3. Scale bar = 5 μm. (C) Transmission electron microscopy (TEM) analysis shown the presence of mitochondria-like organelles in mature SLE RBCs. Scale bar = 500 nm. (D) Lack of correlation between the percentage of circulating Mito+ RBCs and blood paramethers associated with anemia such as hemoglobin content (HBG; n=25), hematocrit (HCT; n=25), % of circulating reticulocytes (n=21). (E) Correlation between the percentage of circulating Mito+ RBCs and disease activity assessed by the SLEDAI score. (n=26). (F) Percentage of circulating Mito+ RBCs in SLE patients stratified based on alterations of selected SLEDAI components. None: no alterations in any SLEDAI components (n=4); H/S: alterations in serological/hematological parameters only (n=14); CT+H/S: connective tissue involvement + serological/hematological parameters (n=3); K+H/S: kidney involvement + serological/hematological parameters (n=5). In (B and C) results are representative of at least three independent experiments. Data are means ± SEM. [One-way analysis of variance (ANOVA) with Tukey post hoc test for multiple comparisons in (A) and (F); Pearson correlation test in (D) and (E)].
Figure 2.
Figure 2.. PBMC-derived RBCs as a model to study human erythropoiesis.
(A) Schematic representation of the culture protocol used to generate RBCs from PBMCs. Expression of CD71, CD36 and CD235a (B) or CD233 and CD49d (C) on the cell surface of proerythroblasts during the differentiation phase in a typical culture. (n=3). Proteomic (D) and Western blot (E) analysis of RBC-specific proteins expressed by proerythroblasts during the differentiation phase. (F) Changes in the expression of representative erythroid-specific transcription factors during proerythroblast maturation. In (C, D, E and F) results are representative of at least three independent experiments. Data are means ± SEM. [One-way analysis of variance (ANOVA) with Tukey post hoc test for multiple comparisons in (B)].
Figure 3.
Figure 3.. Activation of the UPS is critical for mitophagy during human erythropoiesis.
(A) Representative Western blot analysis and quantification of ribosomal proteins (RPL29), rapidly removed mitochondrial proteins (RRMPs) and slowly removed mitochondrial proteins (SRMPs) in proerythroblasts collected at different stages of terminal erythroid maturation. (n=3). (B) Representative Western blot analysis of RPL29, RRMPs and SRMPs in proerythroblasts differentiated in the presence of UPS (MG132 or bortezomib) or autophagy (Bafilomycin A1 or E-64d/Pepstatin) inhibitors. (C) Representative immunofluorescence images showing colocalization of the lysosomal maker LAMP1 with COXIV (RRMP) or ATP5A (SRMP) in proerythroblasts collected at different stages of terminal erythroid maturation. White arrowheads indicate colocalization. Scale bar = 2 μm. (D) Relative chymotrypsin-like UPS activity over time during proerythroblast maturation. (n=5). (E) Autophagy flux over time during proerythroblast maturation. (n=3). (F) Western blot analysis and quantification of COXIV and ATP5A levels in HD and CANDLE proerythroblasts 24 h and 144 h post-differentiation. (HD – Healthy donor). (G) Representative FACS plot of Mitotracker Deep Red (MTDR) staining on mature RBCs (gated on CD235a+ CD71 cells) isolated from CANDLE3 patient. (H) Western blot analysis of selected mitochondrial proteins in proerythroblast transfected with short hairpin RNAs (shRNAs) specific for 15- Lipoxygenase (ALOX15). In (B, C and H) results are representative of at least three independent experiments. Data are means ± SEM. [One-way analysis of variance (ANOVA) with Tukey post hoc test for multiple comparisons in (A), (D) and (E)].
Figure 4.
Figure 4.. HIF-2α-mediated metabolic reprogramming is upstream of UPS activation during human erythropoiesis.
(A) Quantification of ECAR (n=5) and glycolytic reserve (n=3) in human proerythroblasts before (0 h) and after (24 h) differentiation. (B) Relative lactate levels in the medium of human proerythroblasts before (0 h) and after (24 h) differentiation. (n=4). (C) Quantification of maximal and spare respiratory capacity in human proerythroblasts before (0 h) and after (24 h) differentiation. (n=4). (D) OCR/ECAR ratio in human proerythroblasts before (0 h) and after (24 h) differentiation. (n=4). (E) OCR response to UK5099, oligomycin (Oligo), FCCP and antimycin A + rotenone (R/A) in human proerythroblasts 24 h post-differentiation. F) Relative chymotrypsin-like UPS activity in proerythroblasts differentiated in the presence or absence of UK5099. (n=3). Representative Western blot analysis (G) and quantification (H) of selected mitochondrial proteins in proerythroblasts differentiated in the presence or absence of UK5099 or DMOG. (I) Representative native gel analysis of UPS complexes from native cell lysates of proerythroblasts before (0 h) and after 24 h or 48 h post differentiation. The resolution of double-capped (30S) and single-capped (26S) UPSs is indicated together with the 20S UPS complexes. (J) Relative chymotrypsin-like UPS activity in proerythroblasts differentiated in the presence or absence of sodium L-lactate. (n=3). (K) Kla levels on immunoprecipitated UPS from proerythroblasts before (0 h) and after differentiation (24 h) in the presence or absence of sodium L-lactate. (L) Representative Western blot analysis of the expression kinetics of HIF-2α and BNIP3 in proerythroblasts differentiated in the presence or absence of DMOG. # denotes non specific bands. (M) Relative chymotrypsin-like UPS activity in proerythroblasts differentiated in the presence or absence of DMOG. (n=3). In (E, G, I, K and L) results are representative of at least three independent experiments. Data are means ± SEM. [Two-tailed unpaired Student t test].
Figure 5.
Figure 5.. Impaired HIF-2α-mediated metabolic switch and UPS activation in SLE erythroblasts.
(A) Ratio of COXIV levels in HD (n=15), SLE Removers (R; n=17) and SLE Non-Removers (NR; n=16) proerythroblasts 144 h and 24 h post-differentiation. (HD – Healthy donor). (B) Representative Western blot analysis of selected mitochondrial proteins in proerythroblasts from one representative SLE R and one representative NR 24 h and 144 h post-differentiation. (C) Relative chymotrypsin-like UPS activity in HD (n=15), SLE R (n=17) and SLE NR (n=16) proerythroblasts 24 h post-differentiation. (D) Differential gene expression analysis between SLE R (n=3) and NR (n=3) of selected genes involved in the glycolytic and gluconeogenesis pathways. Data are normalized to SLE R. Relative chymotrypsin-like UPS activity (E, n=4) and levels of selected mitochondrial proteins (F, n=3) in SLE NR proerythroblasts differentiated in the presence or absence of Sodium Oxamate. (G) Quantification of HIF-2α and BNIP3 protein levels in SLE R and NR proerythroblasts. Data are normalized to βActin. (n=3). Relative chymotrypsin-like UPS activity (H) and levels of selected mitochondrial proteins (I) in SLE NR proerythroblasts differentiated in the presence or absence of Digoxin. (n=3). In (B, F and I) results are representative of at least three independent experiments. Data are means ± SEM. [One-way analysis of variance (ANOVA) with Tukey post hoc test for multiple comparisons in (A) and (C); Two-tailed unpaired Student t test in (E), (F), (G), (H) and (I)].
Figure 6.
Figure 6.. Mito+ RBCs and opsonizing anti-RBC antibodies drive Type I IFN production in vitro and correlate with the SLE IFN signature.
(A) Levels of TNFα and IP-10 in the supernatants of M⏀ cultured with medium, opsonized (Ops) Mito or Mito+ RBCs or Poly dA:dT. (n=3). Heat map of differentially expressed interferon-stimulated genes (ISGs) and (B) intracellular ISG15 protein levels (C) in M⏀ phagocytized opsonized Mito or Mito+ RBCs (Mito or Mito+ RBCs M⏀). Poly dA:dT is positive control. (D) Normalized IP-10 levels in the supernatants of M⏀ cultured with opsonized Mito+ RBCs generated in the presence or absence or 2′3′-dideoxycytidine (ddC). (n=3). (E) Normalized IP-10 levels in the supernatants of M⏀ transfected with the indicated siRNA and then cultured with opsonized Mito+ RBCs. (n=3). (F) Phagocytosis of CFSE-labeled HD RBCs, treated as indicated, by M⏀. (n=5 HD serum; n= 19 SLE serum). (HD – Healthy donor). (G) Phagocytosis of CFSE-labeled HD RBCs, pretreated with SLE serum, in the presence of isotype control or anti-FcγR antibody. (n=7). (H) IFN score in SLE patients with Mito RBCs (n=4) or with Mito+ RBCs that carry (Ops IgG+; n=4) or not (Ops IgG; n=6) opsonizing antibodies in their sera. In (C) results are representative of at least three independent experiments. Data are means ± SEM. [One-way analysis of variance (ANOVA) with Tukey post hoc test for multiple comparisons in (A), (E) and (H); Two-tailed unpaired Student t test in (D) and (G)].

Comment in

References

    1. Ahlqvist KJ, Leoncini S, Pecorelli A, Wortmann SB, Ahola S, Forsstrom S, Guerranti R, De Felice C, Smeitink J, Ciccoli L, et al. (2015). MtDNA mutagenesis impairs elimination of mitochondria during erythroid maturation leading to enhanced erythrocyte destruction. Nat Commun 6, 6494. - PubMed
    1. Ahn J, Xia T, Rabasa Capote A, Betancourt D, and Barber GN (2018). Extrinsic Phagocyte-Dependent STING Signaling Dictates the Immunogenicity of Dying Cells. Cancer Cell 33, 862–873 e865. - PMC - PubMed
    1. Ait-Ali N, Fridlich R, Millet-Puel G, Clerin E, Delalande F, Jaillard C, Blond F, Perrocheau L, Reichman S, Byrne LC, et al. (2015). Rod-derived cone viability factor promotes cone survival by stimulating aerobic glycolysis. Cell 161, 817–832. - PubMed
    1. An X, Schulz VP, Mohandas N, and Gallagher PG (2015). Human and murine erythropoiesis. Curr Opin Hematol 22, 206–211. - PMC - PubMed
    1. Banchereau R, Cepika AM, Banchereau J, and Pascual V (2017). Understanding Human Autoimmunity and Autoinflammation Through Transcriptomics. Annu Rev Immunol 35, 337–370. - PMC - PubMed

Publication types

Substances