. 2021 Sep 1;35(17-18):1271-1289.
doi: 10.1101/gad.348479.121. Epub 2021 Aug 12.

The trans cell cycle effects of PARP inhibitors underlie their selectivity toward BRCA1/2-deficient cells

Affiliations

The trans cell cycle effects of PARP inhibitors underlie their selectivity toward BRCA1/2-deficient cells

Antoine Simoneau et al. Genes Dev. .

Abstract

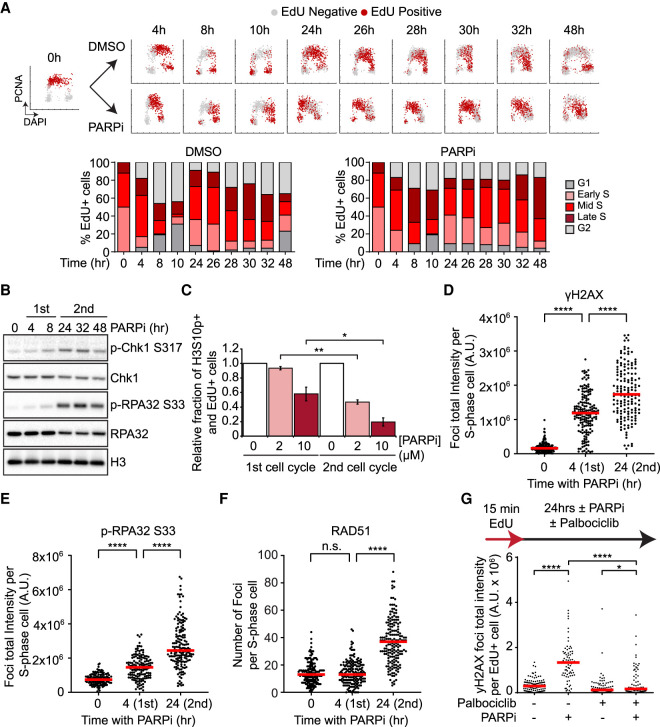
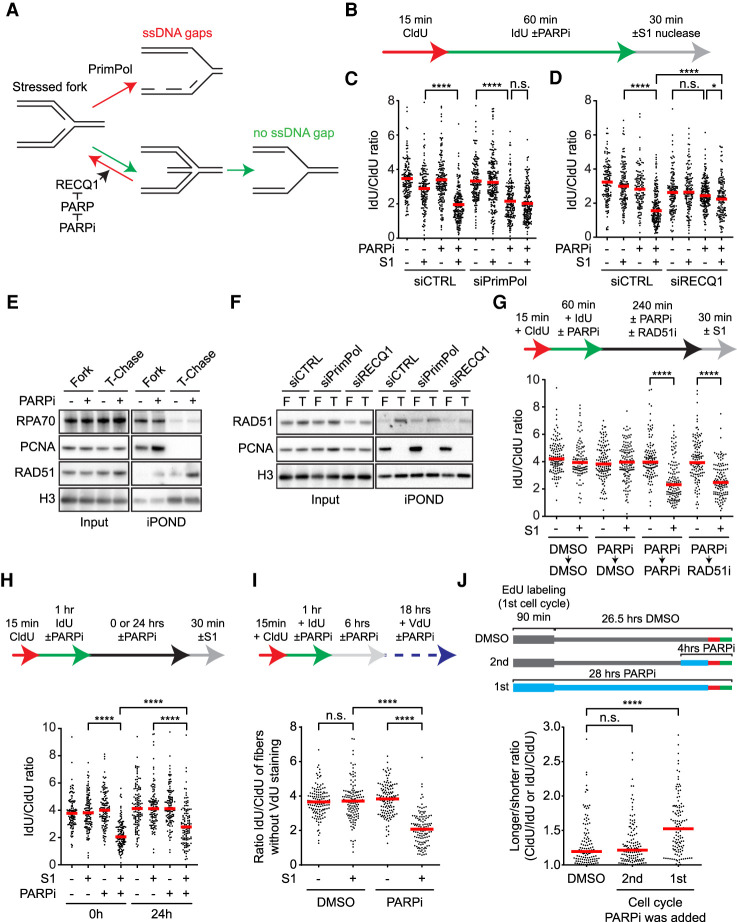
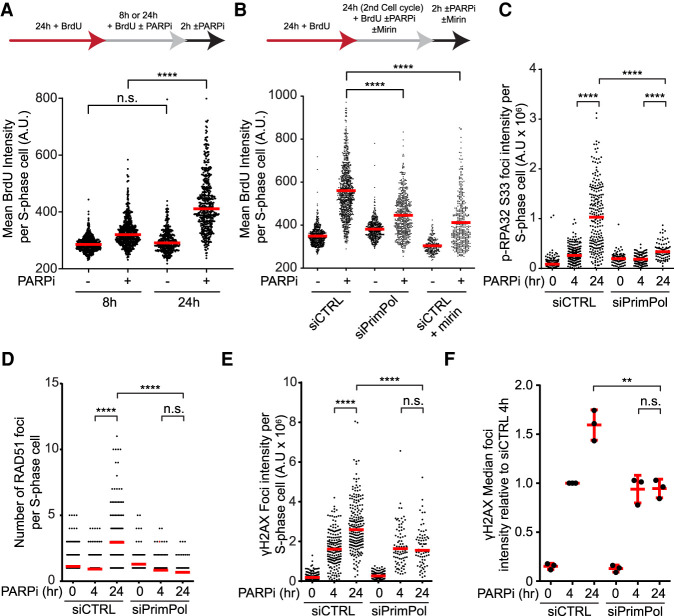
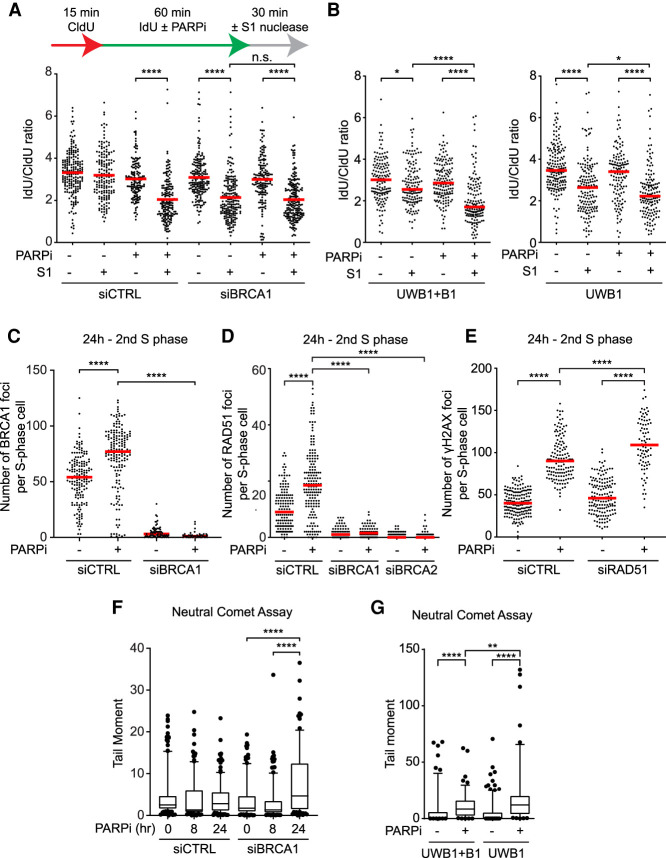
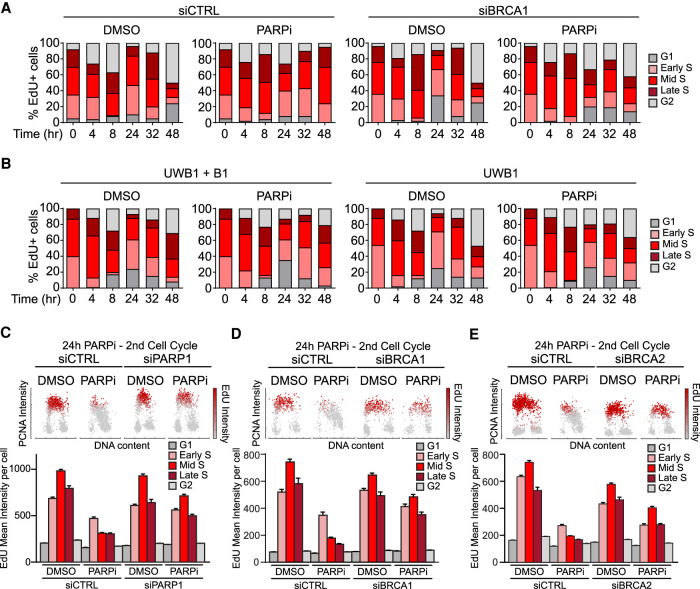
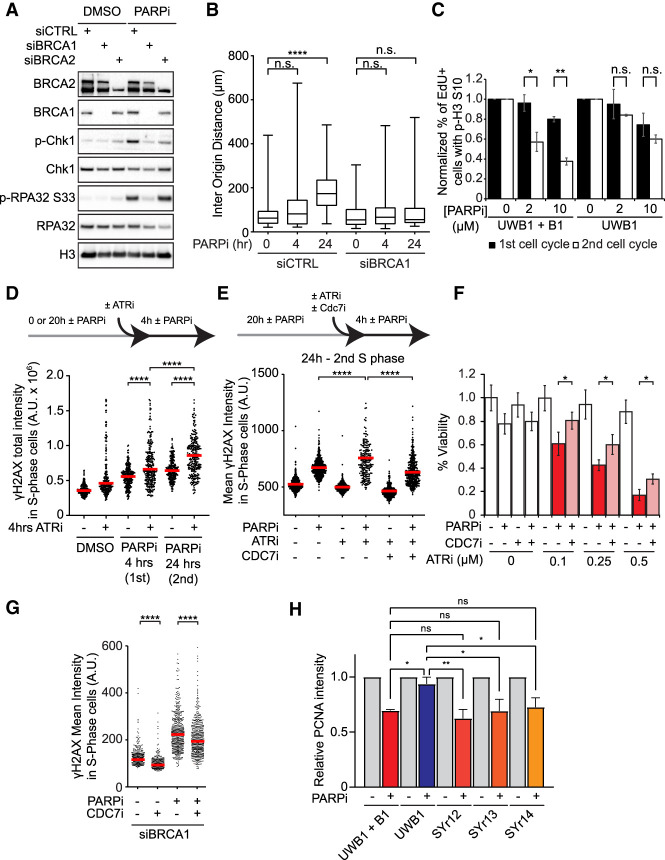
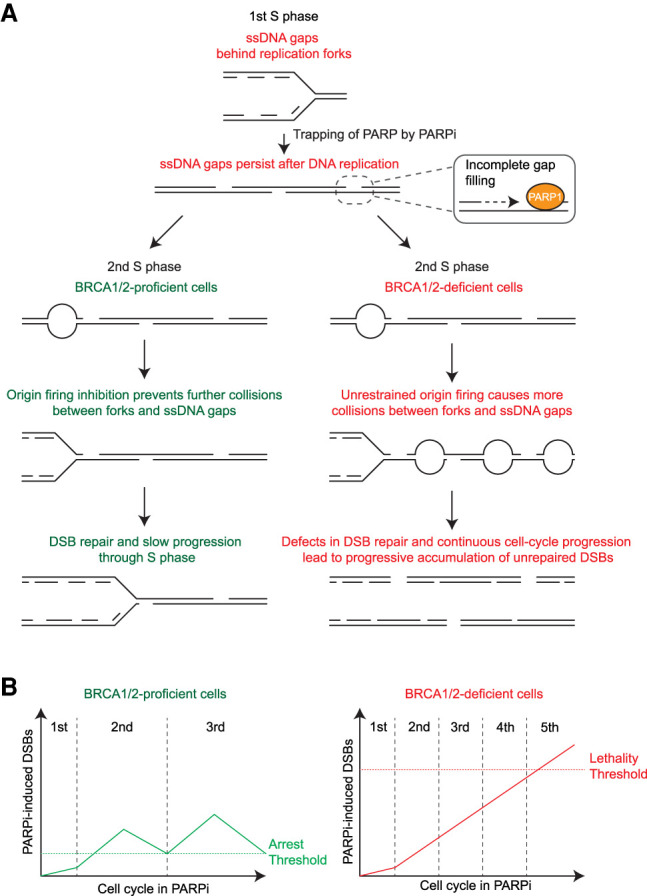
PARP inhibitor (PARPi) is widely used to treat BRCA1/2-deficient tumors, but why PARPi is more effective than other DNA-damaging drugs is unclear. Here, we show that PARPi generates DNA double-strand breaks (DSBs) predominantly in a trans cell cycle manner. During the first S phase after PARPi exposure, PARPi induces single-stranded DNA (ssDNA) gaps behind DNA replication forks. By trapping PARP on DNA, PARPi prevents the completion of gap repair until the next S phase, leading to collisions of replication forks with ssDNA gaps and a surge of DSBs. In the second S phase, BRCA1/2-deficient cells are unable to suppress origin firing through ATR, resulting in continuous DNA synthesis and more DSBs. Furthermore, BRCA1/2-deficient cells cannot recruit RAD51 to repair collapsed forks. Thus, PARPi induces DSBs progressively through trans cell cycle ssDNA gaps, and BRCA1/2-deficient cells fail to slow down and repair DSBs over multiple cell cycles, explaining the unique efficacy of PARPi in BRCA1/2-deficient cells.

Keywords: BRCA; DNA damage; PARP inhibitor; cell cycle; replication.


Figures

Figure 1.
Figure 1.
PARPi induces a robust DNA damage response in the second S phase. (A) The effects of PARPi in two consecutive cell cycles. U2OS cells were pulse-labeled with 5 µM EdU for 15 min and released in the presence or absence of 10 µM olaparib. Cells were pre-extracted with detergent at indicated time points before immunofluorescence analysis of PCNA and EdU detection by click chemistry. Individual cells are plotted according to DNA content (x-axis), PCNA intensity (y-axis), and EdU positivity (colored in red). EdU-labeled cells were classified into G1, early S, mid S, late S, and G2 subpopulations (see Materials and Methods; Supplemental Fig. S1A), and the fractions of EdU-labeled cells in the subpopulations are shown in the stacked bar charts. (B) PARPi induces a more robust ATR response in the second S phase. U2OS cells were treated with 10 µM Olaparib for the indicated durations. Levels of the indicated proteins were analyzed by western blot. See Supplemental Figure S2A for quantifications. (C) PARPi triggers a more robust G2/M checkpoint after the second S phase. Cells were pulse-labeled with 2 µM EdU for 15 min and released in 0, 2, or 10 µM olaparib. To prevent cells from going through the first or second mitosis, 150 ng/mL nocodazole was added 0 or 24 h after EdU labeling, and cells were collected 24 h later. The relative levels of p-H3 S10-positive and EdU+ cells in PARPi-treated samples are normalized to DMSO samples. Error bars indicate SD of two independent experiments. Significance was calculated with a two-tailed Student's t-test. (*) P-value < 0.05, (**) P-value < 0.01. (DF) PARPi induces a more robust DNA damage response in the second S phase. Cells were treated with 10 µM olaparib for the indicated durations, and S-phase cells were pulse-labeled with 10 µM EdU during the last 15 min. Foci of γH2AX (D), p-RPA32 S33 (E), or RAD51 (F) were analyzed by immunofluorescence. The total fluorescence of foci (D,E) or number of foci (F) in S-phase cells were quantified. (Red bar) Median intensity or focus number. More than 100 S-phase cells were analyzed in each sample (n > 100). Significance was determined with a Mann–Whitney U test. (****) P-value < 0.0001, (n.s.) P-value > 0.05. (G) The entry into the second S phase is required for the robust DNA damage response after PARPi treatment. Cells were pulse-labeled with 2 µM EdU for 15 min and then treated with DMSO, 10 µM olaparib, 1 µM palbociclib, or olaparib and palbociclib for 32 h. Mean γH2AX focus intensity of EdU+ cells was quantified. (Red bar) Median intensity. More than 150 EdU+ cells were analyzed in each sample (n > 150). Significance was determined with a Mann–Whitney U test. (****) P-value < 0.0001, (*) P-value < 0.05.
Figure 2.
Figure 2.
PARPi generates persistent ssDNA gaps behind replication forks. (A) A schematic showing the possible effects of RECQ1 and PrimPol on stressed replication forks. (B) Experimental design for C and D. Olaparib was used at 10 µM. Cells were permeabilized and treated with or without S1 nuclease for 30 min before DNA fiber analysis. (C,D) PARPi generates ssDNA gaps behind replication forks in a PrimPol- and RECQ1-dependent manner. More than 125 CldU/IdU double-positive replication tracts were analyzed in each sample (n > 125). (Red bar) Median IdU/CldU ratio. Significance was determined with a Mann–Whitney U test. (****) P-value < 0.0001, (*) P-value < 0.05, (n.s.) P-value > 0.05. (E,F) Analysis of proteins at and behind replication forks. HEK293T cells were treated DMSO or 10 µM olaparib for 60 min, and nascent DNA was labeled with 10 µM EdU during the last 20 min. Cells were either processed for isolation of proteins on nascent DNA (iPOND) to capture proteins at progressing forks (Fork) or were chased with thymidine (T-chase) for 45 min to capture proteins on postreplicative DNA. Levels of the indicated proteins in input cell extracts and iPOND samples were analyzed by western blot. (G) PARPi and RAD51i block the repair of PARPi-induced ssDNA gaps. U2OS were treated as in B except cells were incubated in DMSO, 10 µM olaparib, or 50 µM RI-1 (RAD51i) for 4 h before S1 nuclease digestion. (Red bar) Median IdU/CldU ratio. More than 125 CldU/IdU double-positive replication tracts were analyzed in each sample (n > 125). Significance was determined with a Mann–Whitney U test. (****) P-value < 0.0001. (H,I) PARPi-induced ssDNA gaps persist into the second S phase. (H) U2OS cells were treated as in B except cells were incubated in DMSO or 10 µM olaparib for 0 or 24 h before S1 nuclease digestion. (Red bar) Median IdU/CldU ratio. (I) U2OS were treated as in B except cells were incubated in DMSO or 10 µM olaparib for 6 h, then in 30 µM VdU with or without 10 µM olaparib for 16 h prior to S1 nuclease digestion. To exclude rereplicated fibers, only CldU+ IdU+ VdU fibers were analyzed. (H,I) More than 125 CldU/IdU double-positive replication tracts were analyzed in each sample (n > 125). Significance was determined with a Mann–Whitney U-test. (****) P-value < 0.0001, (n.s.) P-value > 0.05. (J) Effects of PARPi exposure in the first or second cell cycle on fork stability in the second S phase. Cells were labeled with EdU for 90 min in the absence or presence of 10 µM olaparib, and then given 26.5 h to progress to the second cell cycle. Cells were either not exposed to PARPi throughout the time course, exposed to PARPi during the last 4 h, or exposed to PARPi throughout the time course. At the end of the time course, cells were analyzed by CldU/IdU labeling (20 min each) and DNA fiber assay. The longer/shorter ratio (CldU/IdU or IdU/CldU) of replication tracts in EdU+ fibers was determined. The first two samples are also shown in Supplemental Fig. S1F. Significance was determined with a Mann–Whitney U test. (****) P-value < 0.0001, (n.s.) P-value > 0.05.
Figure 3.
Figure 3.
ssDNA gaps induce a surge of DSBs and ssDNA in the second S phase. (A) PARPi induces a surge of ssDNA in the second S phase. U2OS cells were labeled with 20 µM BrdU and treated with DMSO or 10 µM olaparib as indicated. BrdU-labeled ssDNA and PCNA were analyzed by immunofluorescence under a nondenaturing condition. The BrdU intensity of S-phase cells (PCNA+) was quantified. (Red bar) Median intensity. At least 200 S-phase cells were analyzed in each sample (n ≥ 200). Significance was determined with a Mann–Whitney U test. (****) P-value < 0.0001, (n.s.) P-value > 0.05. (B) PARPi-induced ssDNA formation in the second S phase requires PrimPol and MRE11 nuclease activity. Cells were transfected with control and PrimPol siRNAs for 24 h and then treated as in A. Mirin (50 µM) was added where indicated. (Red bar) Median intensity. At least 200 S-phase cells were analyzed in each sample (n ≥ 200). Significance was determined with a Mann–Whitney U test. (****) P-value < 0.0001. (CF) PARPi-induced DNA damage responses in the second S phase require PrimPol. U2OS cells were transfected with control or PrimPol siRNA for 48 h. Cells were then incubated with DMSO or 10 µM olaparib for 24 h, or DMSO for 20 h and 10 µM olaparib for 4 h, and S-phase cells were labeled with 10 µM EdU during the last 15 min. Foci of p-RAP32 S33 (C), RAD51 (D), and γH2AX (E) were analyzed by immunofluorescence. The total foci intensity (C,E) or focus number (D) of S-phase cells were quantified. (Red bar) Median intensity (C,E) and focus number (D). More than 100 S-phase cells were analyzed in each sample (n > 100). (F) Median γH2AX intensities of three independent experiments normalized to the siCTRL 4-h time point are compiled. Significance was determined with a Mann–Whitney U test. (****) P-value < 0.0001, (**) P-value < 0.01, (n.s.) P-value > 0.05.
Figure 4.
Figure 4.
BRCA1-deficient cells are defective for RAD51-mediated repair in the second S phase. (A,B) BRCA1 loss does not affect the induction of ssDNA gaps by PARPi. U2OS cells transfected with control or BRCA1 siRNA (A) or UWB1 and UWB1+B1 cells (B) were labeled with CldU and IdU in the presence or absence of 10 µM olaparib and incubated with or without S1 nuclease for 30 min. (Red bar) Median IdU/CldU ratio. More than 125 CldU/IdU double-positive replication tracts were analyzed in each sample (n > 125). Significance was determined with a Mann–Whitney U test. (****) P-value < 0.0001, (*) P-value < 0.05, (n.s.) P-value > 0.05. (C,D) PARPi induces BRCA1 and RAD51 foci in the second S phase. U2OS cells were transfected with control, BRCA1, or BRCA2 siRNA for 48 h. Cells were then treated with DMSO or 10 µM olaparib for 24 h, and S-phase cells were labeled with 10 µM EdU during the last 15 min. Foci of BRCA1 (C) and RAD51 (D) were analyzed by immunofluorescence, and the number of foci in S-phase cells were quantified. (Red bar) Median focus number. More than 60 S-phase cells were analyzed in each sample (n > 60). Significance was determined with a Mann–Whitney U test. (****) P-value < 0.0001. (E) RAD51 is required for the repair of PARPi-induced DSBs in the second S phase. Cells were treated with DMSO or 10 µM olaparib for 24 h, and S-phase cells were labeled with 10 µM EdU during the last 15 min. The number of γH2AX foci in S-phase cells was quantified. (Red bar) Median focus number. More than 60 S-phase cells were analyzed in each sample (n > 60). Significance was determined with a Mann–Whitney U test. (****) P-value < 0.0001. (F) PARPi preferentially induces DSBs in BRCA1-deficient cells in the second S phase. U2OS cells were transfected with control or BRCA1 siRNA for 72 h. Cells were either untreated or treated with 10 µM olaparib during the last 8 or 24 h and analyzed by neutral comet assay. Box plots represent the tail moment of comets. More than 100 cells were analyzed in each sample (n > 100). Significance was determined with a Mann–Whitney U test. (****) P-value < 0.0001. (G) PARPi induces more DSBs in BRCA1-deficient cancer cells over multiple cell cycles. UWB1 and UWB1 + B1 cell lines were treated with 10 µM olaparib for 48 h and processed for a neutral comet assay. More than 100 cells were analyzed in each sample (n > 100). Significance was determined with a Mann–Whitney U test. (****) P-value < 0.0001, (**) P-value < 0.01.
Figure 5.
Figure 5.
BRCA1-deficient cells fail to suppress DNA synthesis upon PARPi treatment. (A,B) BRCA1-deficient cells fail to slow down in the second S phase after PARPi treatment. (A) U2OS cells were transfected with control or BRCA1 siRNA for 48 h. Cells were pulse-labeled with 2 µM EdU for 15 min and then released in the presence or absence of 10 µM olaparib. The fractions of EdU-labeled cells in the subpopulations are shown in the stacked bar charts. (B) UWB1 and UWB1 + B1 cells were pulse-labeled with 2 µM EdU for 15 min and released in the presence or absence of 2 µM olaparib. (CE) Analysis of DNA synthesis following PARP inhibition in cells lacking PARP1 (C), BRCA1 (D), or BRCA2 (E). U2OS cells were transfected with the indicated siRNA for 48 h, treated with DMSO or 10 µM olaparib for 24 h, and nascent DNA was labeled with 10 µM EdU during the last 15 min. (Top panel) Cells were plotted according to PCNA intensity (y-axis), DAPI intensity (x-axis), and mean EdU intensity (color gradient). (Bottom panel) The mean EdU intensities of cell subpopulations are shown. More than 50 cells were analyzed in each subpopulation (n > 50). Error bars indicate SEM.
Figure 6.
Figure 6.
Levels of origin firing and overall DNA synthesis are determinants of PARPi sensitivity. (A) BRCA1/2-deficient cells are defective for ATR activation in the second S phase. Cells were treated with DMSO or 10 µM olaparib for 24 h. Levels of the indicated proteins were analyzed by western blot. (B) BRCA1-deficient cells are unable to suppress origin firing in the second S phase. Cells were treated with 10 µM olaparib for the indicated durations and analyzed by CldU/IdU labeling (20 min each) and DNA combing. More than 320 CldU/IdU double-positive replication tracts were analyzed for inter-origin distance in each sample (n > 320). Significance was determined with a two-tailed Student's t-test. (****) P-value < 0.0001, (n.s.) P-value > 0.05. (C) BRCA1-deficient UWB1 cells fail to activate the G2/M checkpoint in the second S phase. UWB1 and UWB1+B1 cells were analyzed as in Figure 1C. Error bars indicate SD of two independent experiments. Significance was calculated with a two-tailed Student's t-test. (*) P-value < 0.05, (**) P-value < 0.01, (n.s.) P-value > 0.05. (D) ATR is critical for suppressing DNA damage in the second S phase. U2OS cells were treated with 10 µM olaparib for the indicated durations. VE-821 (ATRi; 10 µM) was added during the last 4 h as indicated, and S-phase cells were labeled with 10 µM EdU during the last 15 min. The total intensity of γH2AX foci in S-phase cells was quantified. (Red bar) Median intensity. More than 200 S-phase cells were analyzed in each sample (n > 200). Significance was determined with a Mann–Whitney U test. (****) P-value < 0.0001. (E) Inhibition of origin firing suppresses the induction of DNA damage by ATRi in the second S phase. U2OS cells were treated with DMSO or 10 µM olaparib for 24 h. VE-821 (ATRi; 10 µM) and/or XL-413 (CDC7i; 5 µM) were added during the last 4 h, and S-phase cells were labeled with 10 µM EdU during the last 15 min. The mean intensity of γH2AX in S-phase cells was quantified. (Red bar) Median intensity. More than 200 S-phase cells were analyzed in each sample (n > 200). Significance was determined with a Mann–Whitney U test. (****) P-value < 0.0001. (F) ATRi enhances PARPi sensitivity by increasing origin firing. U2OS cells were treated with increasing concentrations of VE-821 (ATRi), 1 µM olaparib (PARPi), and 1 µM XL-413 (CDC7i) as indicated for 6 d. Cell viability was determined with CellTiter Glo. Three technical replicates were analyzed in each sample (n = 3). Significance was determined with a two-tailed Student's t-test. Error bar indicates standard deviation. (*) P-value < 0.01. (G) Inhibition of origin firing suppresses PARPi-induced DNA damage in BRCA1-deficient cells. U2OS cells were transfected with BRCA1 siRNA for 48 h and then treated with DMSO or 10 µM olaparib for 24 h in the presence or absence of 1 µM XL-413. S-phase cells were labeled with EdU during the last 15 min. The mean γH2AX intensity in S-phase cells was quantified. (Red bar) Median intensity. More than 200 S-phase cells were analyzed in each sample (n > 200). Significance was determined with a Mann–Whitney U test. (****) P-value < 0.0001. (H) The ability to suppress overall DNA synthesis in the second S phase correlates with PARPi resistance in cancer cell lines. The indicated cell lines were treated with DMSO or 10 µM olaparib for 24 h, and S-phase cells were labeled with 10 µM EdU in the last 15 min. PCNA levels in EdU+ cells were then quantified by immunofluorescence and normalized to the untreated DMSO control of each cell line. At least 200 cells were analyzed in each condition (n ≥ 200). Error bars indicate SD of three independent experiments. Significance was calculated with a one-way ANOVA with the Tukey procedure. (*) P-value < 0.05, (**) P-value < 0.01, (n.s.) P-value > 0.05.
Figure 7.
Figure 7.
Models for the trans cell cycle effects of PARPi in BRCA1-proficient and -deficient cells. (A) A model for the effects of PARPi in BRCA1/2-proficient and -deficient cells during two consecutive S phases. During each S phase, PARPi induces ssDNA gaps behind DNA replication forks. The trapping of PARP by PARPi prevents complete filling of these gaps, allowing them to persist into the next cell cycle. During the next round of DNA replication, the ssDNA gaps generated in the previous cell cycle collide with replication forks, leading to fork collapse and a surge of DSBs. BRCA1/2-proficient cells activate ATR to suppress replication origin firing and recruit RAD51 to repair collapsed forks. In contrast, BRCA1/2-deficient cells fail to suppress origin firing and repair collapsed forks, leading to more DSBs. The unique ability of PARPi to induce DSBs in a trans cell cycle manner explains why PARPi generates more DSBs in BRCA1/2-deficeint cells than in BRCA1/2-proficient cells. (B) A model for the effects of PARPi in BRCA1/2-proficient and -deficient cells over multiple cell cycles. The ssDNA gaps generated in each S phase are converted to DSBs in the next S phase. Because BRCA1/2-proficient cells slow down and repair DSBs in each cell cycle, DSB levels will not reach the threshold for cell death, and cells will continue to proliferate after DSBs are repaired. In contrast, BRCA1/2-deficient cells fail to slow down and repair in each cell cycle, which allows PARPi-induced DSBs to accumulate progressively over multiple cell cycles. These repeating trans cell cycle effects of PARPi eventually push DSB levels over the lethal threshold and kill BRCA1/2-deficient cancer cells.

Similar articles

Cited by

References

    1. Berti M, Ray Chaudhuri A, Thangavel S, Gomathinayagam S, Kenig S, Vujanovic M, Odreman F, Glatter T, Graziano S, Mendoza-Maldonado R, et al.2013. Human RECQ1 promotes restart of replication forks reversed by DNA topoisomerase I inhibition. Nat Struct Mol Biol 20: 347–354. 10.1038/nsmb.2501 - DOI - PMC - PubMed
    1. Bhowmick R, Minocherhomji S, Hickson ID. 2016. RAD52 facilitates mitotic DNA synthesis following replication stress. Mol Cell 64: 1117–1126. 10.1016/j.molcel.2016.10.037 - DOI - PubMed
    1. Bianco JN, Poli J, Saksouk J, Bacal J, Silva MJ, Yoshida K, Lin YL, Tourrière H, Lengronne A, Pasero P. 2012. Analysis of DNA replication profiles in budding yeast and mammalian cells using DNA combing. Methods 57: 149–157. 10.1016/j.ymeth.2012.04.007 - DOI - PubMed
    1. Blessing C, Mandemaker IK, Gonzalez-Leal C, Preisser J, Schomburg A, Ladurner AG. 2020. The oncogenic helicase ALC1 regulates PARP inhibitor potency by trapping PARP2 at DNA breaks. Mol Cell 80: 862–875.e6. 10.1016/j.molcel.2020.10.009 - DOI - PubMed
    1. Bryant HE, Schultz N, Thomas HD, Parker KM, Flower D, Lopez E, Kyle S, Meuth M, Curtin NJ, Helleday T. 2005. Specific killing of BRCA2-deficient tumours with inhibitors of poly(ADP-ribose) polymerase. Nature 434: 913–917. 10.1038/nature03443 - DOI - PubMed

Publication types

MeSH terms