. 2021 Aug 27;373(6558):1030-1035.
doi: 10.1126/science.aba7408. Epub 2021 Aug 12.

Population sequencing data reveal a compendium of mutational processes in the human germ line

Affiliations

Population sequencing data reveal a compendium of mutational processes in the human germ line

Vladimir B Seplyarskiy et al. Science. .

Abstract

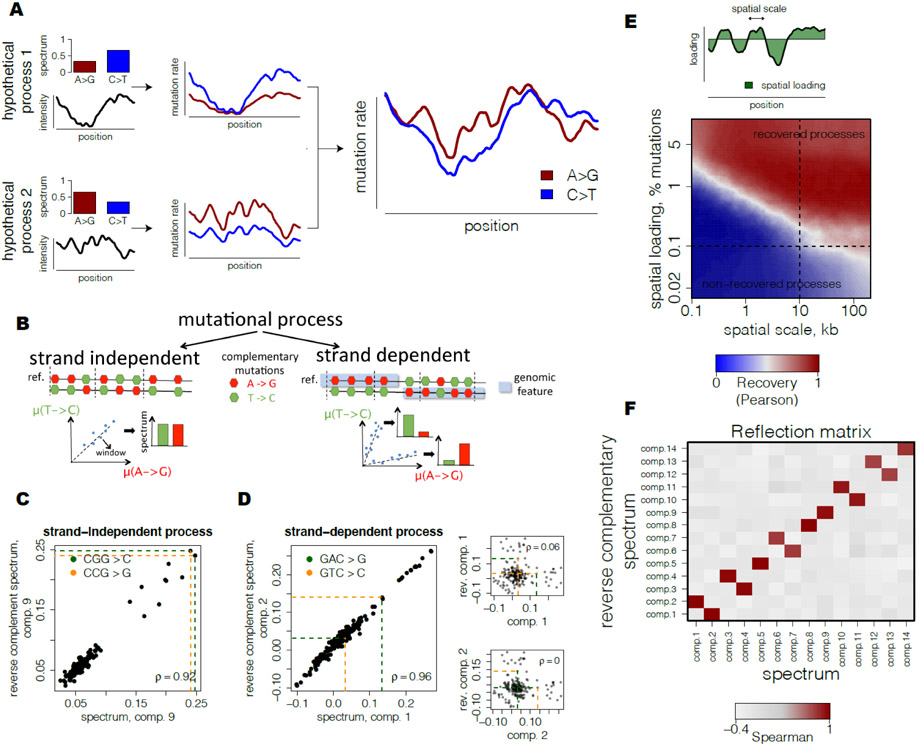
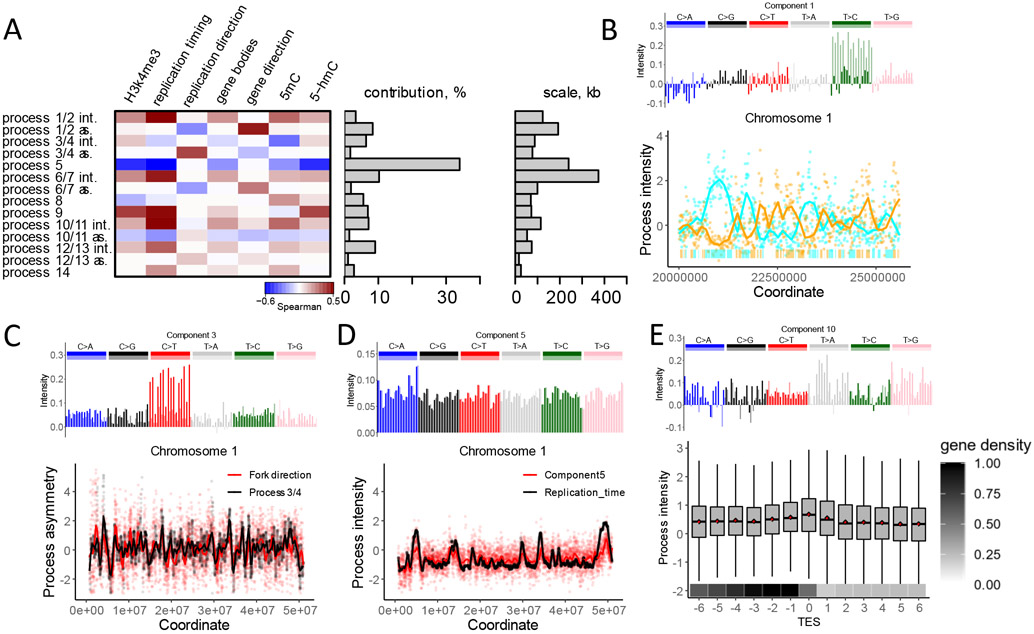
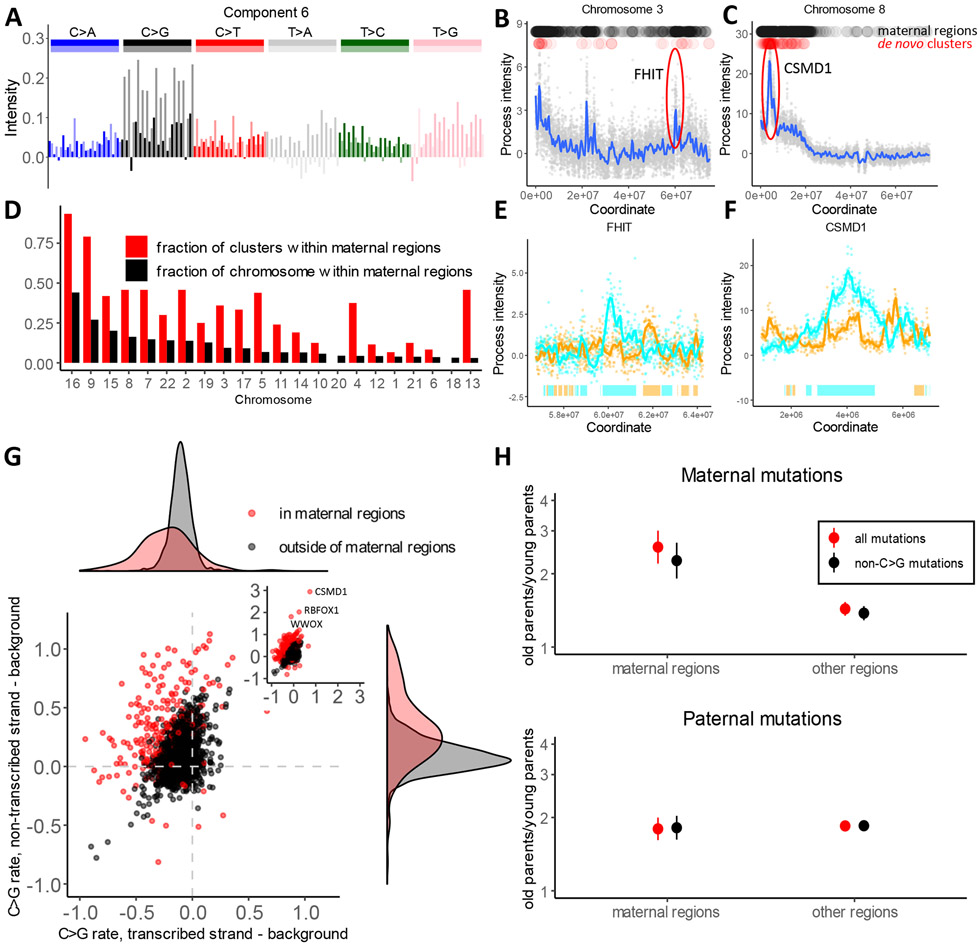
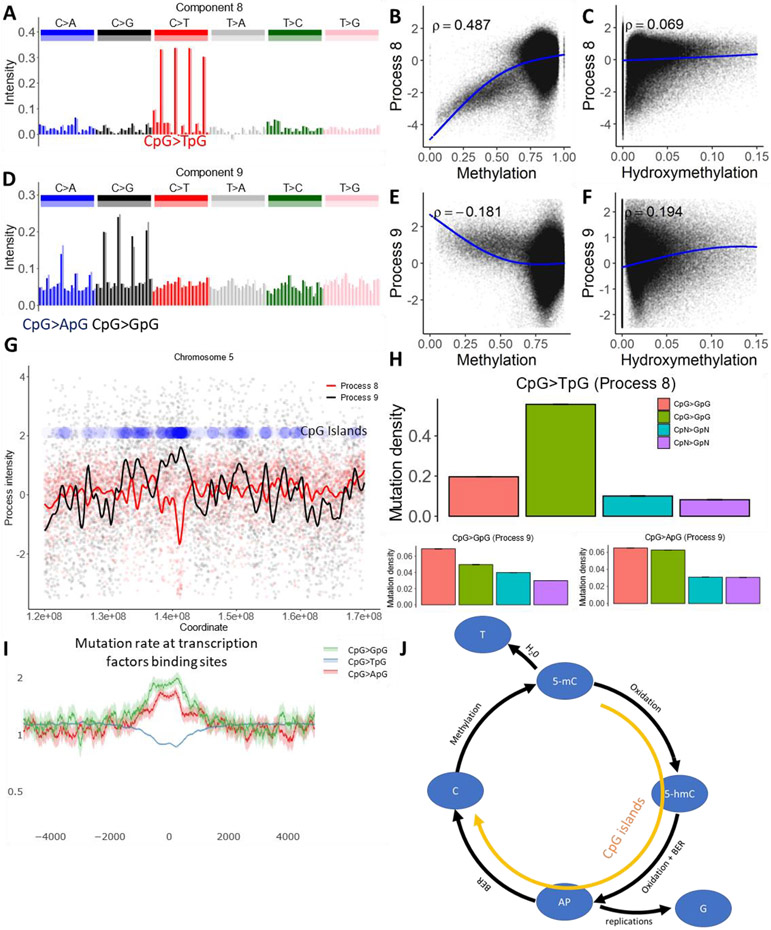
Biological mechanisms underlying human germline mutations remain largely unknown. We statistically decompose variation in the rate and spectra of mutations along the genome using volume-regularized nonnegative matrix factorization. The analysis of a sequencing dataset (TOPMed) reveals nine processes that explain the variation in mutation properties between loci. We provide a biological interpretation for seven of these processes. We associate one process with bulky DNA lesions that are resolved asymmetrically with respect to transcription and replication. Two processes track direction of replication fork and replication timing, respectively. We identify a mutagenic effect of active demethylation primarily acting in regulatory regions and a mutagenic effect of long interspersed nuclear elements. We localize a mutagenic process specific to oocytes from population sequencing data. This process appears transcriptionally asymmetric.


Figures

Fig 1.
Fig 1.. Inference of spatially-varying mutational processes in germline.
(A) Observed spatial variability of mutational spectrum is modeled as a number of mutational processes with specific spectra and spatially-varying intensities. (B) Strand-independent mutational processes have equal rates of complementary mutations at each locus. Strand-dependent mutational processes produce two unequal patterns of complementary mutation rates at loci depending on the strand orientation of a genomic feature. (C) Example of a predicted strand-independent process. Loadings of complementary mutations of mutational component 9 are highly similar. (D) Example of a predicted strand-dependent process. Loadings of complementary mutations between two mutational components 1 and 2 are highly similar and characterize a single mutational process (left). In contrast to strand-independent process (see Fig. 1C), loadings of complementary mutations of mutational component 1 (upper right) and component 2 (lower right) are almost uncorrelated. (E) Theoretical scale-loading limitations for detection of mutational processes shows potentially high range of processes that can be recovered with the proposed approach. Simulations of mutational processes at different scales (quantified as half-life of simulated Ornstein-Uhlenbeck process) and spatial loadings (fraction of spatially-varying mutations of a process among total mutations, scheme) were based on parameters from TOPmed dataset. Quality of recovery was assessed using maximum absolute correlation between spectra of each simulated component and reconstructed components. (F) Reflection matrix reveals strand-dependency of processes and separates biological signal from noise. Correlation of spectrum of one mutational component with reverse complementary spectrum of another demonstrates clear separation into self-correlated components (5,8, 9,14) and pairs of mutually correlated components (1/2, 3/4, 6/7, 10/11, 12/13).
Fig 2.
Fig 2.. Mutational processes are associated with distinct genomic features.
(A) Heatmap of correlations of intensities with genome features shows diverse modes of associations (left). For strand-dependent processes two spatial characteristics were considered: intensity (int.), estimated as the sum of intensities of two components, and asymmetry (as.), estimated as the difference between intensities of two components. Fraction of mutational variance explained by each process (middle) and scale, estimated as the half-life of the autoregressive model (right) are shown. (B) (top) The spectrum of one of the two components comprising process 1/2; (bottom) An example of intensities of components 1 and 2, associated with non-transcribed strands on chromosome 1. The bars on the bottom of the panel depict gene bodies (colors: cyan if transcribed strand is the reference strand and orange otherwise). (C) (top) The spectrum of one of the two components comprising process 3/4; (bottom) The association between the asymmetry of process 3/4 (component 3 – component 4) and the direction of the replication fork measured as a gradient of replication timing. (D) The spectrum of component 5 (top), and its association with replication timing (bottom). (E) (top) The spectrum of component 10; (bottom) Intensity of component 10 among 13 consecutive 10 KB-long regions adjacent to the transcription end site (TES). Box plot shows component 10 intensity. Mean intensity of component 10 in each region shown as a red point. Mean fraction of the transcribed nucleotides per region shown on the bottom.
Fig 3.
Fig 3.. Oocyte-specific mutational process.
(A) The spectrum of one of the two components comprising process 6/7. (B and C) Examples of two loci with high intensity of process 6/7, estimated as the sum of intensities of component 6 and component 7. Black dots on top of the panels mark windows of high intensity that we call “maternal regions” (see Methods). Red dots show de novo maternal clustered mutations from Halldorsson et al. (18). (D) Enrichment of maternal clustered de novo mutations from Halldorsson et al. in maternal regions. The fraction of each chromosome that is attributed to “maternal regions” (high intensity of process 6/7) is shown in black. The fraction of maternal clustered mutations located within maternal regions on each chromosome is shown in red; the difference in size between the red and black bars indicates enrichment of clustered mutations within “maternal regions”. (E and F) Zoom in view of process 6/7 intensity spikes around FHIT and CSMD1 genes on non-transcribed strands. Bars on the bottom depict gene bodies (colors: cyan if transcribed strand is the reference strand and orange otherwise). (G) Difference between C>G mutation rate on transcribed or non-transcribed strand of a gene compared to a 100 KB region flanking the gene. Red dots correspond to genes within maternal regions and black dots corresponds to genes outside of maternal regions. Density plots on the top and right summarize the distributions on the X and Y axes. (H) Ratio of parent-specific de novo mutation rates between first and last parent age quartiles is shown, estimated independently for “maternal regions” and for the rest of the genome. The error bars show the 95% confidence interval (95% CI) for the ratio of two binomial proportions test.
Fig 4.
Fig 4.. Cytosine deamination and cytosine demethylation.
(A and D) The mutational spectrum of component 8 is dominated by CpG>TpG (top), while component 9 is dominated by CpG>GpG and CpG>ApG (bottom). (B, C, E and F) Association between the intensity of components 8 and 9 and cytosine methylation or cytosine hydroxymethylation. (G) Process 8 is inversely correlated with the density of CpG islands, while process 9 is positively correlated. Blue dots represent density of CpG islands across a 50 MB long region of chromosome 5. (H) Effect of CpG islands on mutation rate in CpG context and in cytosines outside of CpG context. (I) Mutation rate in CpG context at transcription factor binding sites located outside of annotated CpG islands, as determined by ChIP-seq peaks (see Methods), normalized to the genome average mutation rate. 95% binomial proportion confidence intervals are displayed in transparent lines. Higher levels of demethylation at these sites lead to the accelerated rate of CpG transversions. (J) Illustration of the biochemical mechanisms suggested for processes 8 and 9. Enzymatic oxidation of methylcytosine (5-mC) leads to hydroxymethylcytosine (5-hmC) (35), which after additional steps of oxidation should be removed by glycosylase, leaving an abasic site (AP). During DNA replication, AP sites will frequently be converted to CpG>GpG mutations and more rarely to CpG>ApG mutations, matching the spectra of process 9 (36). Alternatively, successful repair of AP sites creates non-methylated cytosines. Alternately, spontaneous deamination of methylcytosine creates a T to G mismatch, enhancing the rate of CpG>TpG mutations. While deamination should be prevalent in CpG sites with high methylation levels, the mutagenic effect of demethylation should be prominent in CpG islands.

References

    1. Kunkel TA, Erie DA, Eukaryotic Mismatch Repair in Relation to DNA Replication. Annu. Rev. Genet 49, 291–313 (2015). - PMC - PubMed
    1. Yeeles JTP, Poli J, Marians KJ, Pasero P, Rescuing stalled or damaged replication forks. Cold Spring Harb Perspect Biol. 5, a012815 (2013). - PMC - PubMed
    1. Marteijn JA, Lans H, Vermeulen W, Hoeijmakers JHJ, Understanding nucleotide excision repair and its roles in cancer and ageing. Nat. Rev. Mol. Cell Biol 15, 465–481 (2014). - PubMed
    1. Alexandrov LB, Nik-Zainal S, Wedge DC, Aparicio SAJR, Behjati S, Biankin AV, Bignell GR, Bolli N, Borg A, Børresen-Dale A-L, Boyault S, Burkhardt B, Butler AP, Caldas C, Davies HR, Desmedt C, Eils R, Eyfjörd JE, Foekens JA, Greaves M, Hosoda F, Hutter B, Ilicic T, Imbeaud S, Imielinski M, Imielinsk M, Jäger N, Jones DTW, Jones D, Knappskog S, Kool M, Lakhani SR, López-Otín C, Martin S, Munshi NC, Nakamura H, Northcott PA, Pajic M, Papaemmanuil E, Paradiso A, Pearson JV, Puente XS, Raine K, Ramakrishna M, Richardson AL, Richter J, Rosenstiel P, Schlesner M, Schumacher TN, Span PN, Teague JW, Totoki Y, Tutt ANJ, Valdés-Mas R, van Buuren MM, van’t Veer L, Vincent-Salomon A, Waddell N, Yates LR, Australian Pancreatic Cancer Genome Initiative, ICGC Breast Cancer Consortium, ICGC MMML-Seq Consortium, ICGC PedBrain, Zucman-Rossi J, Futreal PA, McDermott U, Lichter P, Meyerson M, Grimmond SM, Siebert R, Campo E, Shibata T, Pfister SM, Campbell PJ, Stratton MR, Signatures of mutational processes in human cancer. Nature. 500, 415–421 (2013). - PMC - PubMed
    1. Helleday T, Eshtad S, Nik-Zainal S, Mechanisms underlying mutational signatures in human cancers. Nat. Rev. Genet 15, 585–598 (2014). - PMC - PubMed

Material and methods references

    1. Taliun D, Harris DN, Kessler MD, Carlson J, Szpiech ZA, Torres R, Taliun SAG, Corvelo A, Gogarten SM, Kang HM, Pitsillides AN, LeFaive J, Lee S, Tian X, Browning BL, Das S, Emde A-K, Clarke WE, Loesch DP, Shetty AC, Blackwell TW, Wong Q, Aguet F, Albert C, Alonso A, Ardlie KG, Aslibekyan S, Auer PL, Barnard J, Barr RG, Becker LC, Beer RL, Benjamin EJ, Bielak LF, Blangero J, Boehnke M, Bowden DW, Brody JA, Burchard EG, Cade BE, Casella JF, Chalazan B, Chen Y-DI, Cho MH, Choi SH, Chung MK, Clish CB, Correa A, Curran JE, Custer B, Darbar D, Daya M, de Andrade M, DeMeo DL, Dutcher SK, Ellinor PT, Emery LS, Fatkin D, Forer L, Fornage M, Franceschini N, Fuchsberger C, Fullerton SM, Germer S, Gladwin MT, Gottlieb DJ, Guo X, Hall ME, He J, Heard-Costa NL, Heckbert SR, Irvin MR, Johnsen JM, Johnson AD, Kardia SLR, Kelly T, Kelly S, Kenny EE, Kiel DP, Klemmer R, Konkle BA, Kooperberg C, Köttgen A, Lange LA, Lasky-Su J, Levy D, Lin X, Lin K-H, Liu C, Loos RJF, Garman L, Gerszten R, Lubitz SA, Lunetta KL, Mak ACY, Manichaikul A, Manning AK, Mathias RA, McManus DD, McGarvey ST, Meigs JB, Meyers DA, Mikulla JL, Minear MA, Mitchell B, Mohanty S, Montasser ME, Montgomery C, Morrison AC, Murabito JM, Natale A, Natarajan P, Nelson SC, North KE, O’Connell JR, Palmer ND, Pankratz N, Peloso GM, Peyser PA, Post WS, Psaty BM, Rao DC, Redline S, Reiner AP, Roden D, Rotter JI, Ruczinski I, Sarnowski C, Schoenherr S, Seo J-S, Seshadri S, Sheehan VA, Shoemaker MB, Smith AV, Smith NL, Smith JA, Sotoodehnia N, Stilp AM, Tang W, Taylor KD, Telen M, Thornton TA, Tracy RP, Berg DJVD, Vasan RS, Viaud-Martinez KA, Vrieze S, Weeks DE, Weir BS, Weiss ST, Weng L-C, Willer CJ, Zhang Y, Zhao X, Arnett DK, Ashley-Koch AE, Barnes KC, Boerwinkle E, Gabriel S, Gibbs R, Rice KM, Rich SS, Silverman E, Qasba P, Gan W, Topm. P. G. W. G. Trans-Omics for Precision Medicine (TOPMed) Program, Papanicolaou GJ, Nickerson DA, Browning SR, Zody MC, Zöllner S, Wilson JG, Cupples LA, Laurie CC, Jaquish CE, Hernandez RD, O’Connor TD, Abecasis GR, Sequencing of 53,831 diverse genomes from the NHLBI TOPMed Program. bioRxiv, 563866 (2019). - PubMed
    1. Lek M, Karczewski KJ, Minikel EV, Samocha KE, Banks E, Fennell T, O’Donnell-Luria AH, Ware JS, Hill AJ, Cummings BB, Tukiainen T, Birnbaum DP, Kosmicki JA, Duncan LE, Estrada K, Zhao F, Zou J, Pierce-Hoffman E, Berghout J, Cooper DN, Deflaux N, DePristo M, Do R, Flannick J, Fromer M, Gauthier L, Goldstein J, Gupta N, Howrigan D, Kiezun A, Kurki MI, Moonshine AL, Natarajan P, Orozco L, Peloso GM, Poplin R, Rivas MA, Ruano-Rubio V, Rose SA, Ruderfer DM, Shakir K, Stenson PD, Stevens C, Thomas BP, Tiao G, Tusie-Luna MT, Weisburd B, Won H-H, Yu D, Altshuler DM, Ardissino D, Boehnke M, Danesh J, Donnelly S, Elosua R, Florez JC, Gabriel SB, Getz G, Glatt SJ, Hultman CM, Kathiresan S, Laakso M, McCarroll S, McCarthy MI, McGovern D, McPherson R, Neale BM, Palotie A, Purcell SM, Saleheen D, Scharf JM, Sklar P, Sullivan PF, Tuomilehto J, Tsuang MT, Watkins HC, Wilson JG, Daly MJ, MacArthur DG, Exome Aggregation Consortium, Analysis of protein-coding genetic variation in 60,706 humans. Nature. 536, 285–291 (2016). - PMC - PubMed
    1. Halldorsson BV, Palsson G, Stefansson OA, Jonsson H, Hardarson MT, Eggertsson HP, Gunnarsson B, Oddsson A, Halldorsson GH, Zink F, Gudjonsson SA, Frigge ML, Thorleifsson G, Sigurdsson A, Stacey SN, Sulem P, Masson G, Helgason A, Gudbjartsson DF, Thorsteinsdottir U, Stefansson K, Characterizing mutagenic effects of recombination through a sequence-level genetic map. Science. 363, eaau1043 (2019). - PubMed
    1. An J-Y, Lin K, Zhu L, Werling DM, Dong S, Brand H, Wang HZ, Zhao X, Schwartz GB, Collins RL, Currall BB, Dastmalchi C, Dea J, Duhn C, Gilson MC, Klei L, Liang L, Markenscoff-Papadimitriou E, Pochareddy S, Ahituv N, Buxbaum JD, Coon H, Daly MJ, Kim YS, Marth GT, Neale BM, Quinlan AR, Rubenstein JL, Sestan N, State MW, Willsey AJ, Talkowski ME, Devlin B, Roeder K, Sanders SJ, Genome-wide de novo risk score implicates promoter variation in autism spectrum disorder. Science. 362, eaat6576 (2018). - PMC - PubMed
    1. The ENCODE Project Consortium, An integrated encyclopedia of DNA elements in the human genome. Nature. 489, 57–74 (2012). - PMC - PubMed

Publication types