

Spatial transcriptomics of planktonic and sessile bacterial populations at single-cell resolution
- PMID: 34385369
- PMCID: PMC8454218
- DOI: 10.1126/science.abi4882
Spatial transcriptomics of planktonic and sessile bacterial populations at single-cell resolution
Abstract
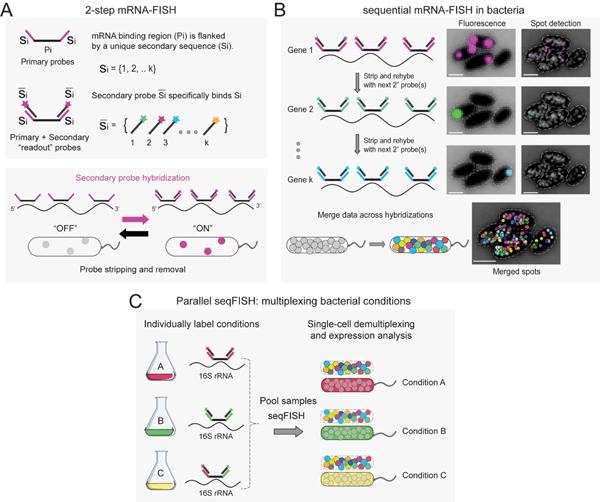
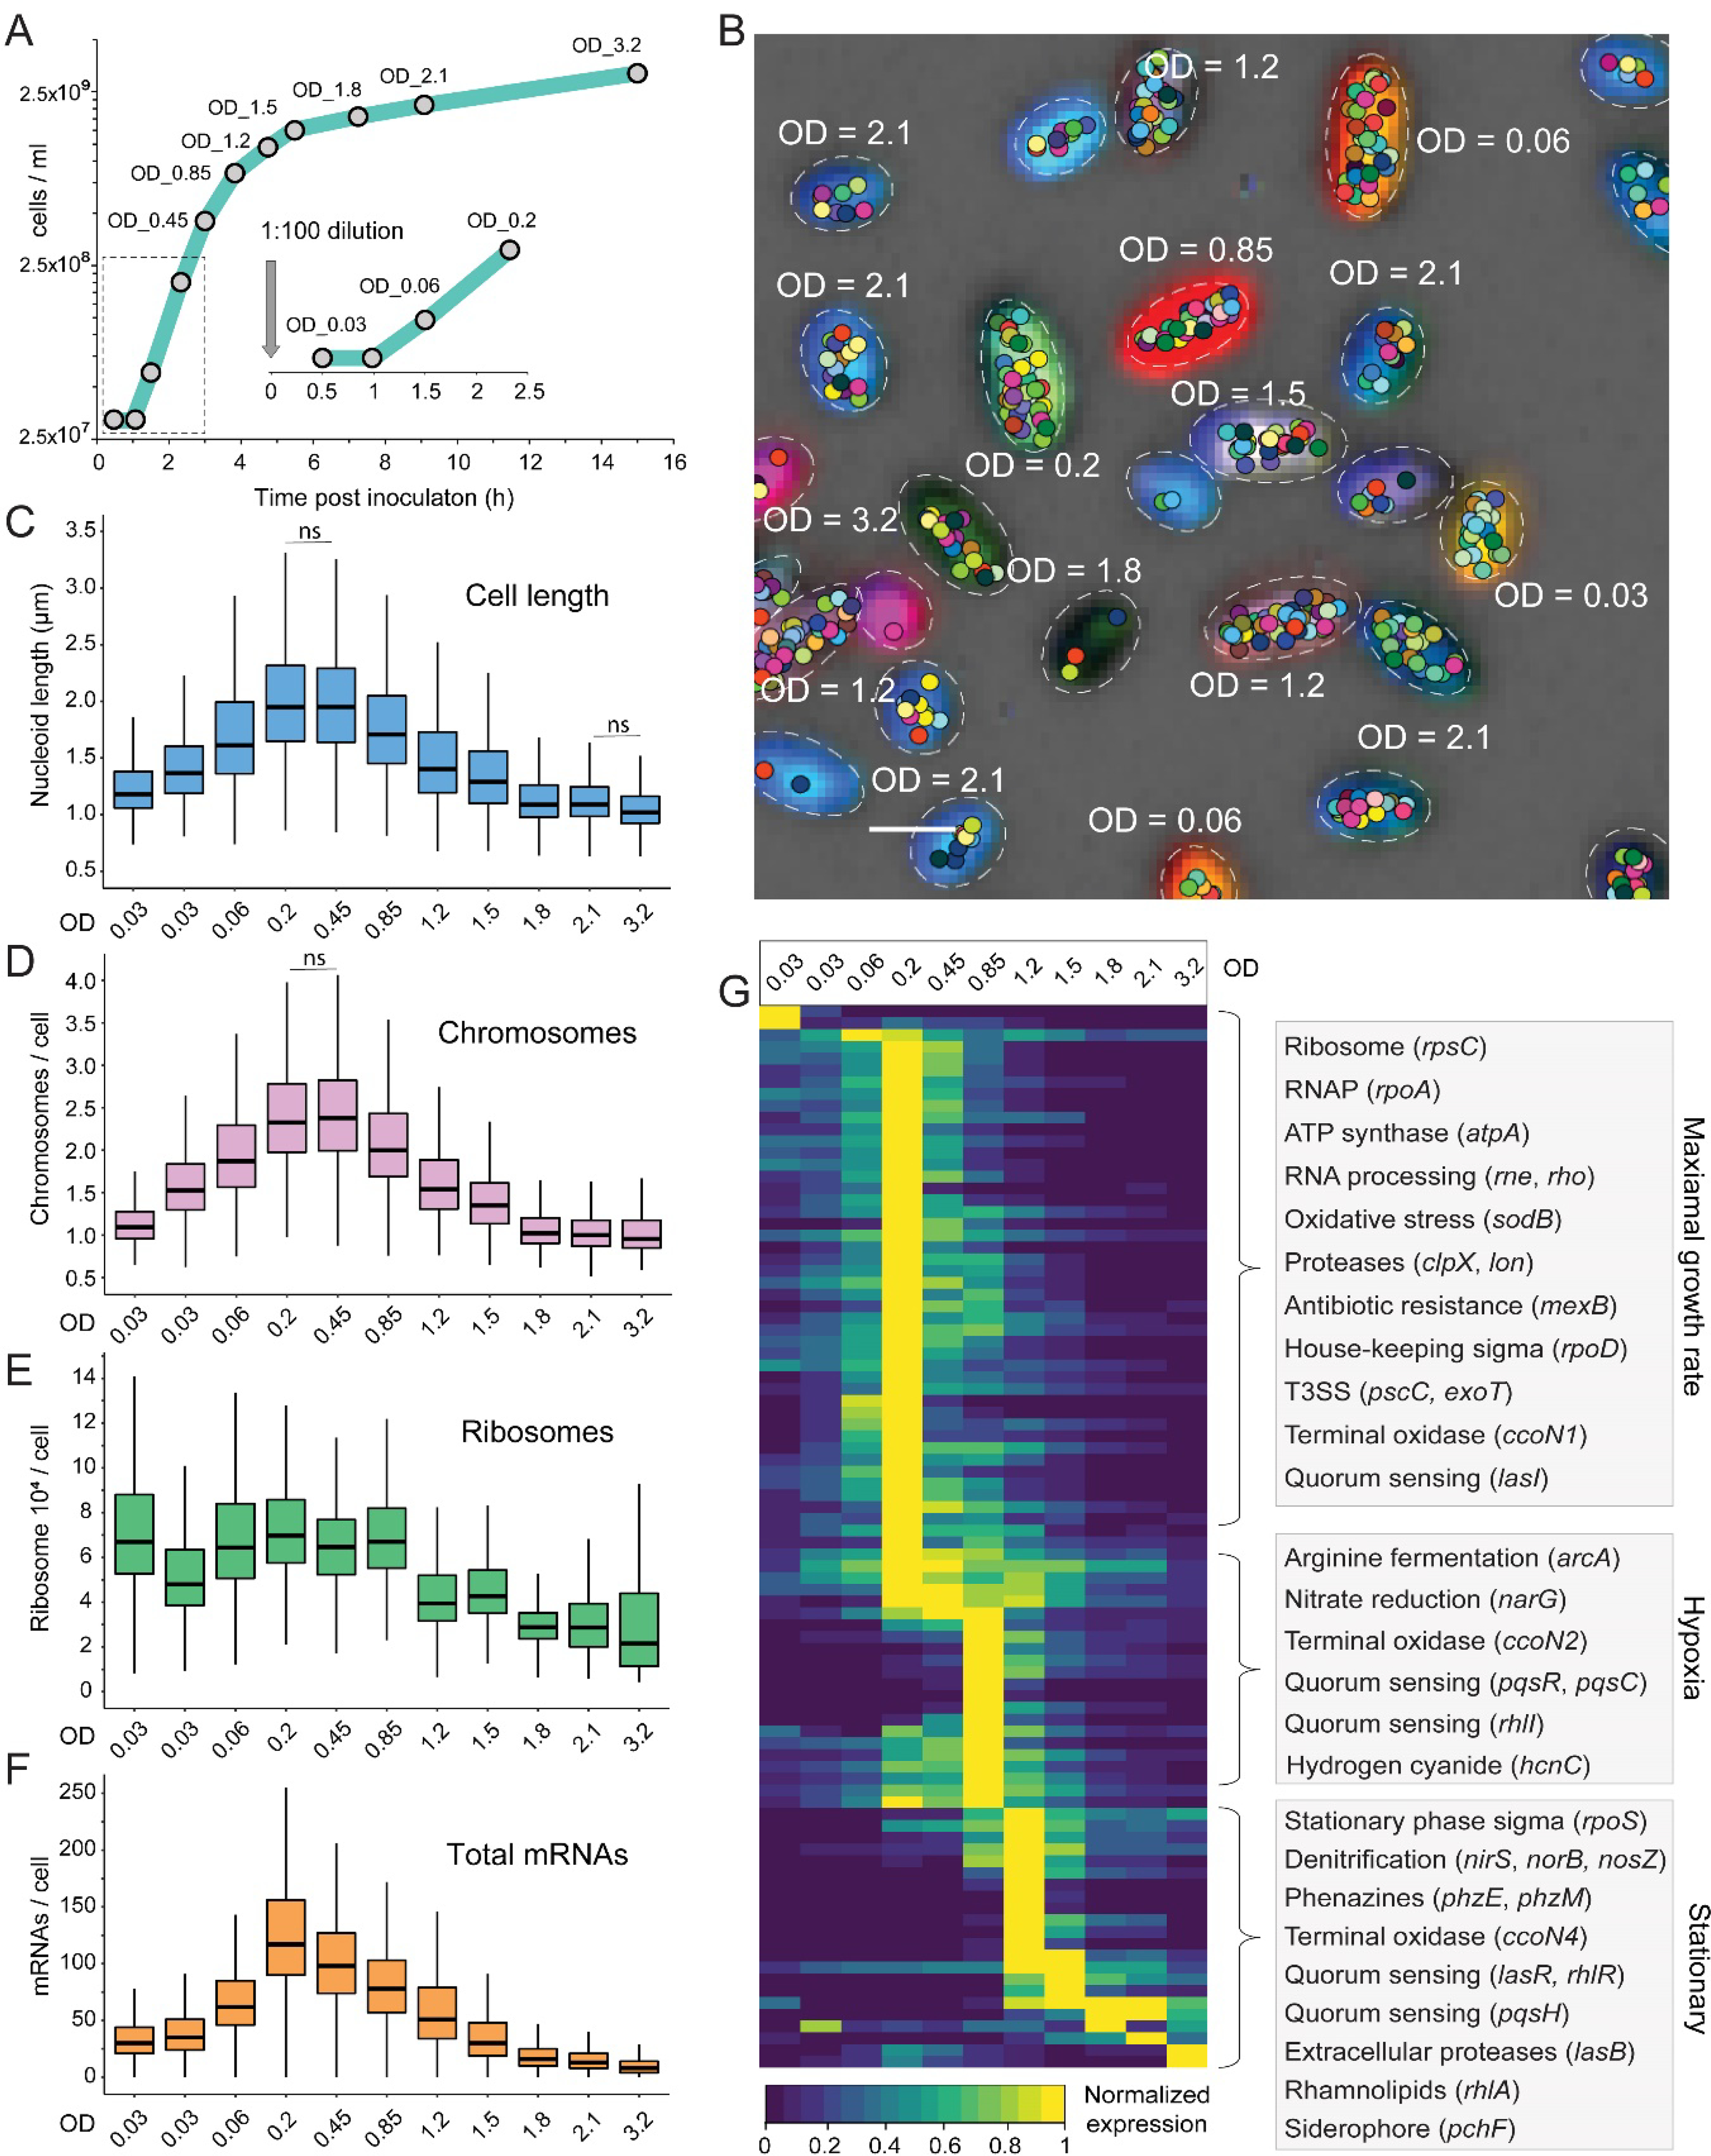
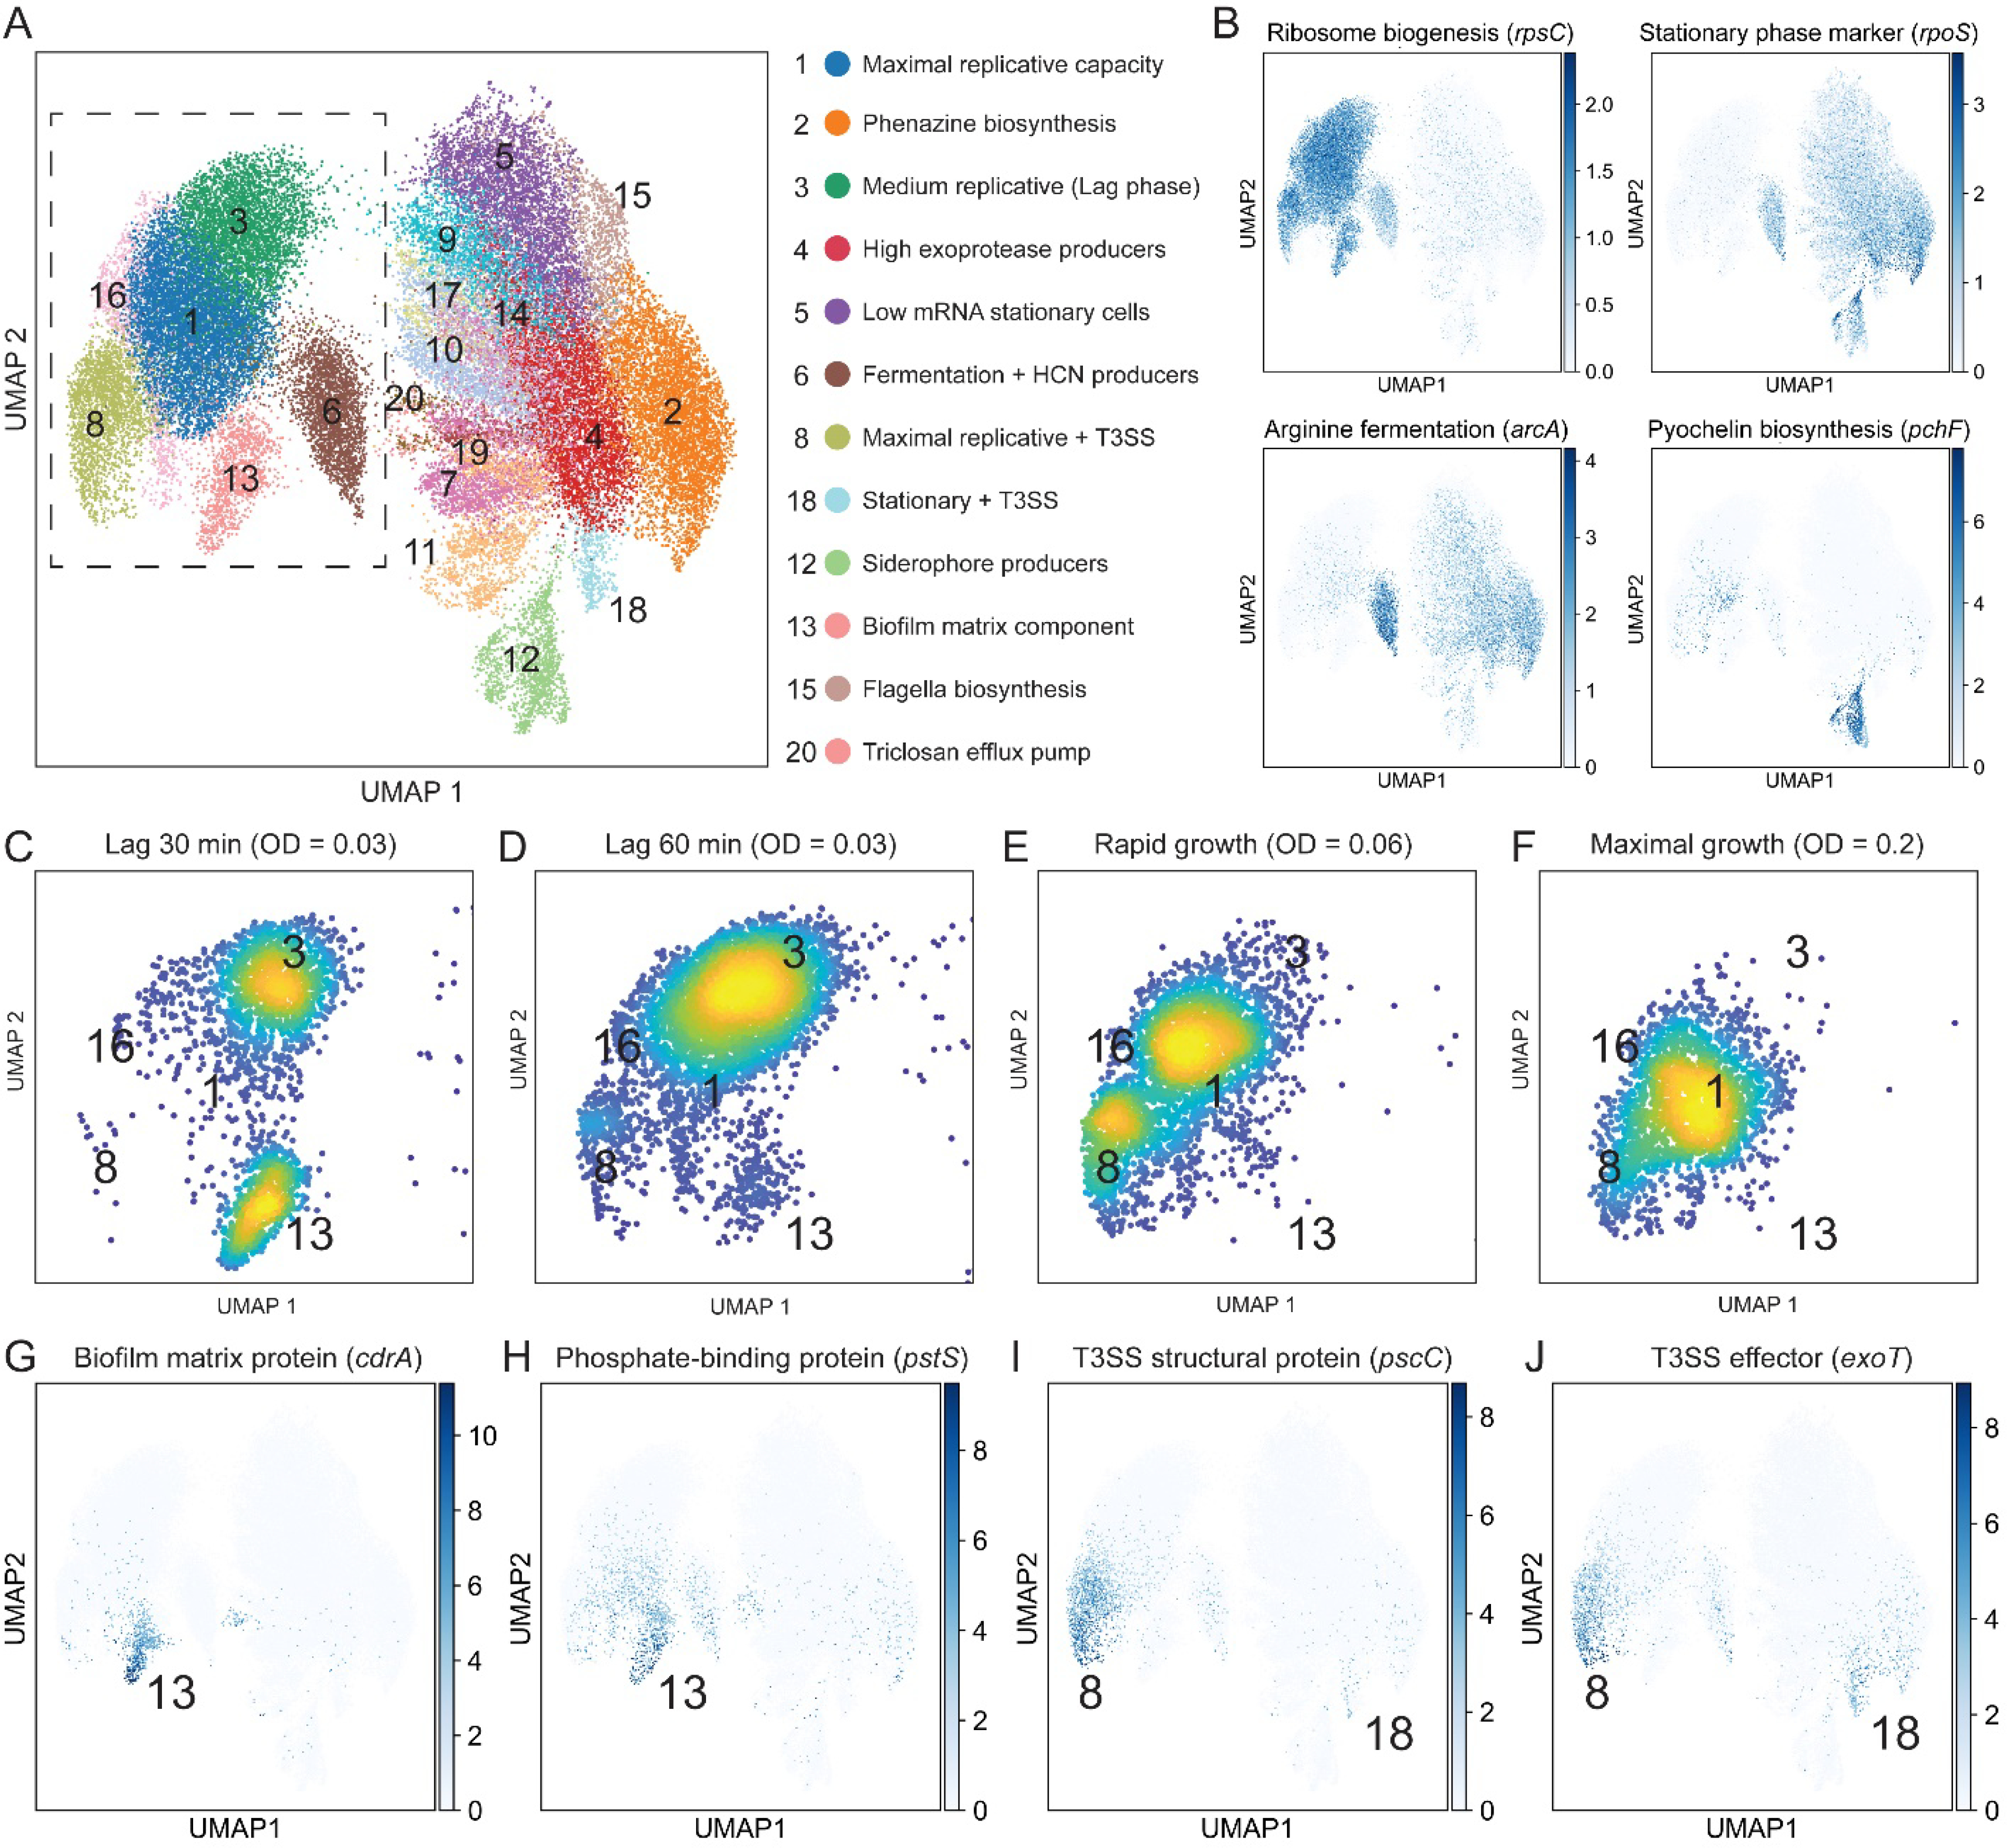
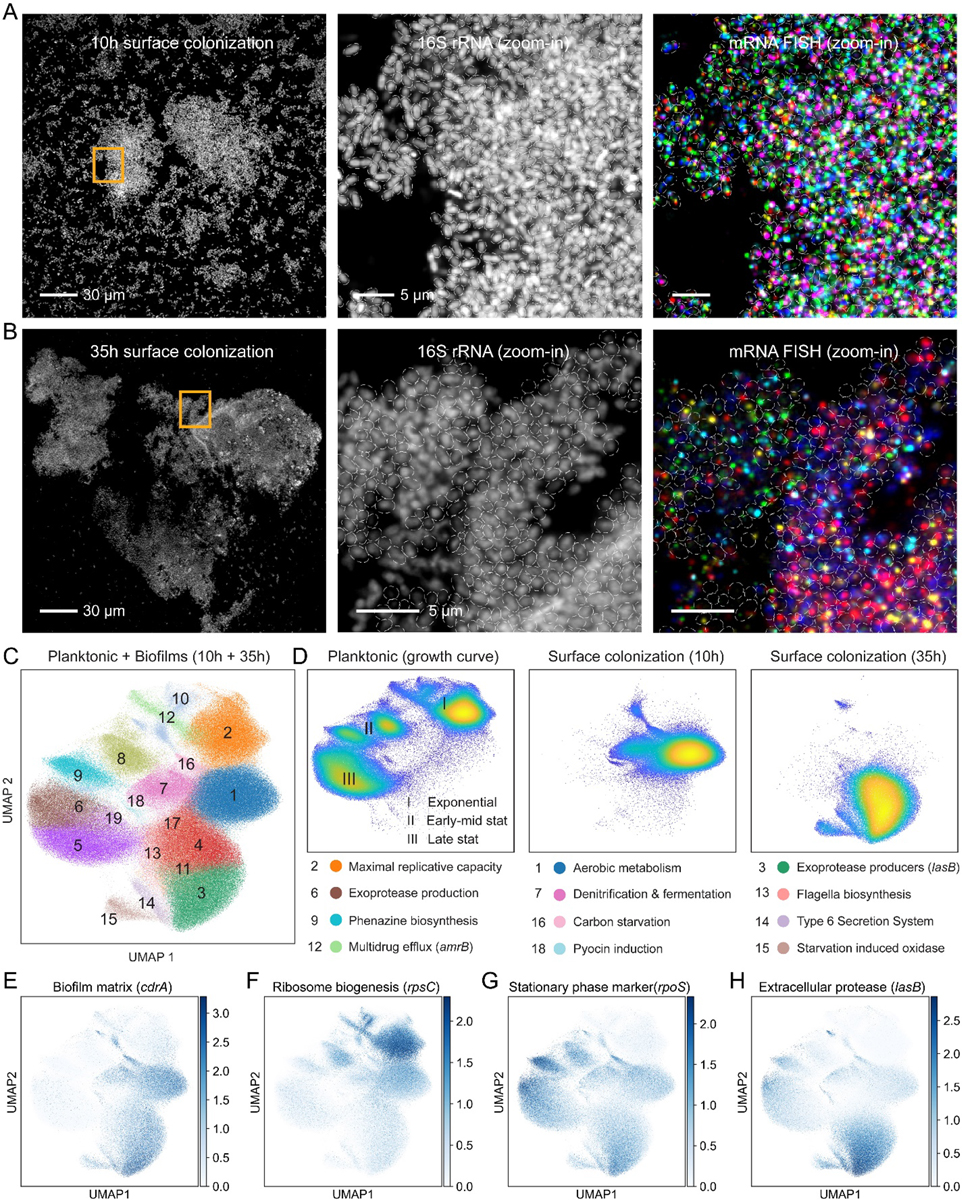
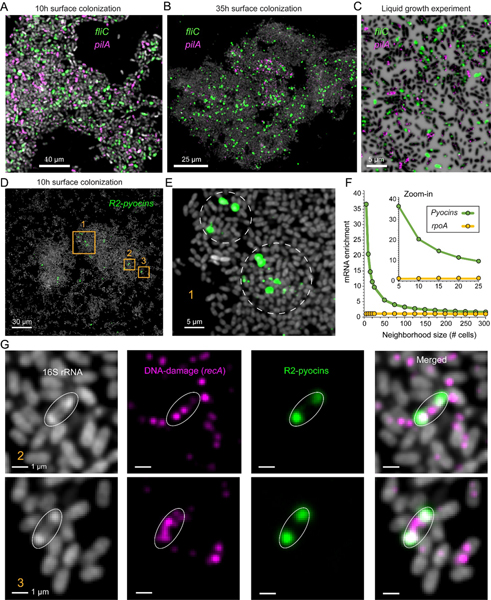
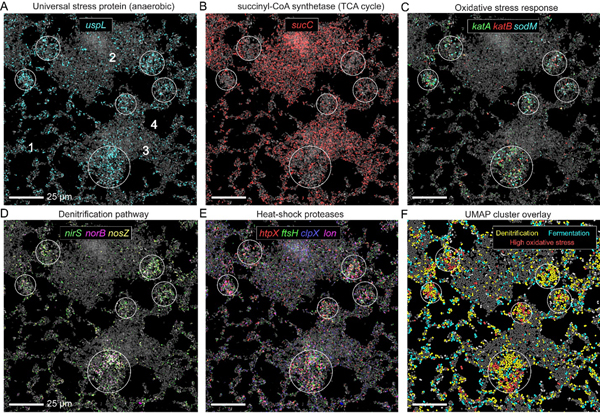
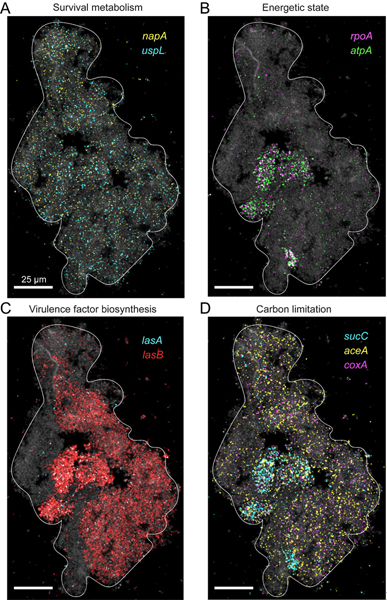
Capturing the heterogeneous phenotypes of microbial populations at relevant spatiotemporal scales is highly challenging. Here, we present par-seqFISH (parallel sequential fluorescence in situ hybridization), a transcriptome-imaging approach that records gene expression and spatial context within microscale assemblies at a single-cell and molecule resolution. We applied this approach to the opportunistic pathogen Pseudomonas aeruginosa, analyzing about 600,000 individuals across dozens of conditions in planktonic and biofilm cultures. We identified numerous metabolic- and virulence-related transcriptional states that emerged dynamically during planktonic growth, as well as highly spatially resolved metabolic heterogeneity in sessile populations. Our data reveal that distinct physiological states can coexist within the same biofilm just several micrometers away, underscoring the importance of the microenvironment. Our results illustrate the complex dynamics of microbial populations and present a new way of studying them at high resolution.
Copyright © 2021 The Authors, some rights reserved; exclusive licensee American Association for the Advancement of Science. No claim to original U.S. Government Works.
Conflict of interest statement
Figures
Similar articles
-
Evolution of Antibiotic Resistance in Biofilm and Planktonic Pseudomonas aeruginosa Populations Exposed to Subinhibitory Levels of Ciprofloxacin.Antimicrob Agents Chemother. 2018 Jul 27;62(8):e00320-18. doi: 10.1128/AAC.00320-18. Print 2018 Aug. Antimicrob Agents Chemother. 2018. PMID: 29760140 Free PMC article.
-
Interrelationships between colonies, biofilms, and planktonic cells of Pseudomonas aeruginosa.J Bacteriol. 2007 Mar;189(6):2411-6. doi: 10.1128/JB.01687-06. Epub 2007 Jan 12. J Bacteriol. 2007. PMID: 17220232 Free PMC article.
-
Distinct transcriptome and traits of freshly dispersed Pseudomonas aeruginosa cells.mSphere. 2024 Dec 19;9(12):e0088424. doi: 10.1128/msphere.00884-24. Epub 2024 Nov 27. mSphere. 2024. PMID: 39601567 Free PMC article.
-
Comparative transcriptome analyses of Pseudomonas aeruginosa.Hum Genomics. 2009 Jul;3(4):349-61. doi: 10.1186/1479-7364-3-4-361. Hum Genomics. 2009. PMID: 19706365 Free PMC article. Review.
-
Global regulatory pathways and cross-talk control pseudomonas aeruginosa environmental lifestyle and virulence phenotype.Curr Issues Mol Biol. 2012;14(2):47-70. Epub 2012 Feb 22. Curr Issues Mol Biol. 2012. PMID: 22354680 Review.
Cited by
-
Computational methods and challenges in analyzing intratumoral microbiome data.Trends Microbiol. 2023 Jul;31(7):707-722. doi: 10.1016/j.tim.2023.01.011. Epub 2023 Feb 23. Trends Microbiol. 2023. PMID: 36841736 Free PMC article. Review.
-
The biofilm life cycle: expanding the conceptual model of biofilm formation.Nat Rev Microbiol. 2022 Oct;20(10):608-620. doi: 10.1038/s41579-022-00767-0. Epub 2022 Aug 3. Nat Rev Microbiol. 2022. PMID: 35922483 Free PMC article. Review.
-
Single-Cell Technologies to Study Phenotypic Heterogeneity and Bacterial Persisters.Microorganisms. 2021 Nov 1;9(11):2277. doi: 10.3390/microorganisms9112277. Microorganisms. 2021. PMID: 34835403 Free PMC article. Review.
-
What's in a name? Characteristics of clinical biofilms.FEMS Microbiol Rev. 2023 Sep 5;47(5):fuad050. doi: 10.1093/femsre/fuad050. FEMS Microbiol Rev. 2023. PMID: 37656883 Free PMC article.
-
Spatial transcriptome-guided multi-scale framework connects P. aeruginosa metabolic states to oxidative stress biofilm microenvironment.PLoS Comput Biol. 2024 Apr 26;20(4):e1012031. doi: 10.1371/journal.pcbi.1012031. eCollection 2024 Apr. PLoS Comput Biol. 2024. PMID: 38669236 Free PMC article.
References
-
- Flemming H-C, Wuertz S, Bacteria and archaea on Earth and their abundance in biofilms. Nat. Rev. Microbiol 17, 247–260 (2019). - PubMed
-
- Costerton JW, Cheng KJ, Geesey GG, Ladd TI, Nickel JC, Dasgupta M, Marrie TJ, Bacterial biofilms in nature and disease. Annu. Rev. Microbiol 41, 435–464 (1987). - PubMed
Publication types
MeSH terms
Substances
Grants and funding
LinkOut - more resources
Full Text Sources
Other Literature Sources
