. 2021 Aug 13;373(6556):813-818.
doi: 10.1126/science.aba3683.

High-fat diet-induced colonocyte dysfunction escalates microbiota-derived trimethylamine N-oxide

Affiliations

High-fat diet-induced colonocyte dysfunction escalates microbiota-derived trimethylamine N-oxide

Woongjae Yoo et al. Science. .

Abstract

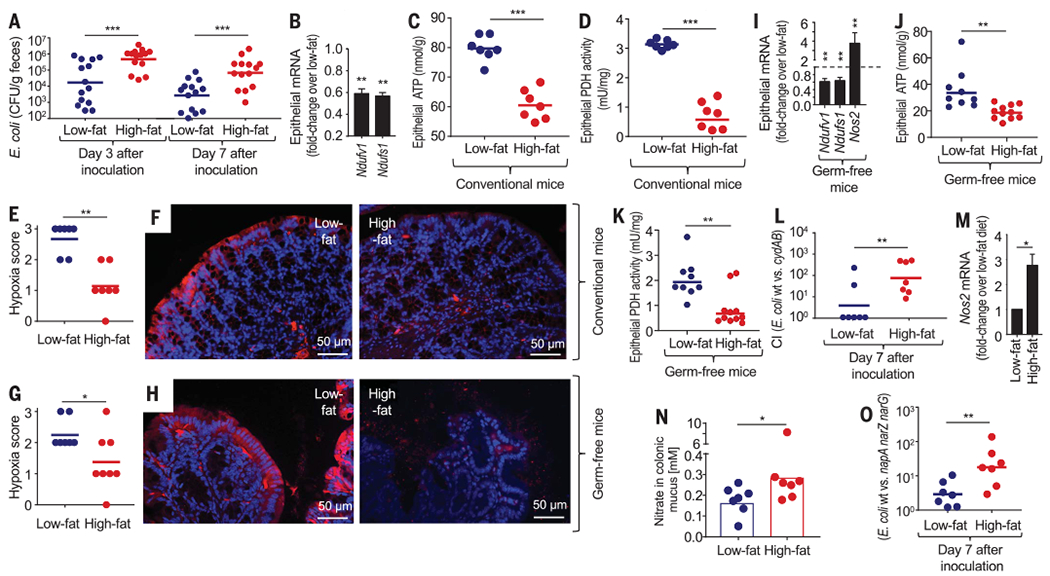
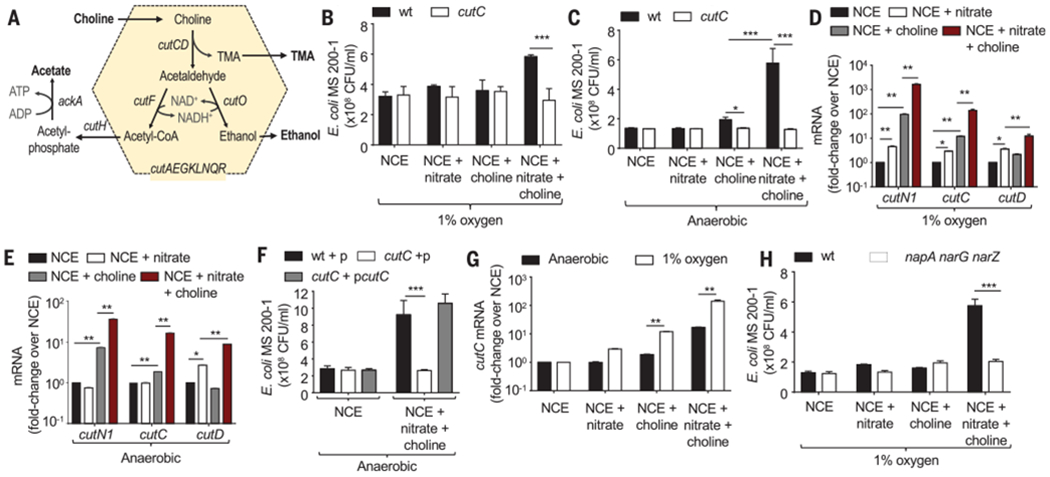
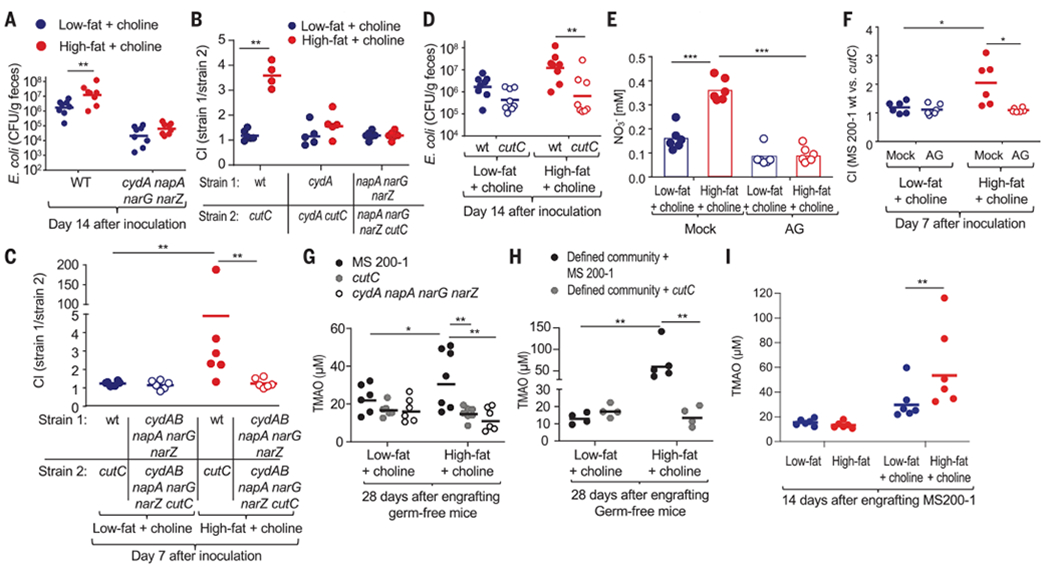
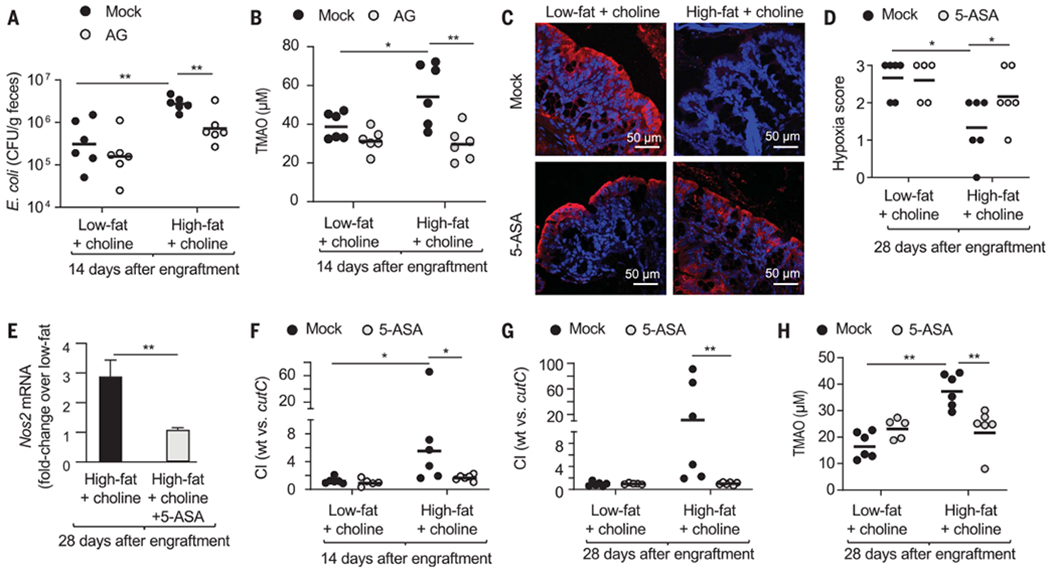
A Western-style, high-fat diet promotes cardiovascular disease, in part because it is rich in choline, which is converted to trimethylamine (TMA) by the gut microbiota. However, whether diet-induced changes in intestinal physiology can alter the metabolic capacity of the microbiota remains unknown. Using a mouse model of diet-induced obesity, we show that chronic exposure to a high-fat diet escalates Escherichia coli choline catabolism by altering intestinal epithelial physiology. A high-fat diet impaired the bioenergetics of mitochondria in the colonic epithelium to increase the luminal bioavailability of oxygen and nitrate, thereby intensifying respiration-dependent choline catabolism of E. coli In turn, E. coli choline catabolism increased levels of circulating trimethlamine N-oxide, which is a potentially harmful metabolite generated by gut microbiota.


Figures

Fig. 1.
Fig. 1.. A high-fat diet changes epithelial physiology to increase the luminal availability of host-derived respiratory electron acceptors.
Mice were reared and maintained on a low- or high-fat diet. (A) Mice were inoculated with E. coli strain Nissle 1917, and colony-forming units (CFU) of E. coli Nissle 1917 in feces were determined at the indicated time points. (B to K and M) Preparations of colonic epithelial cells were used to isolate RNA and prepare cell lysates. (B) Fold change in mice on the high-fat diet compared with low-fat diet controls in epithelial transcripts was determined by quantitative real-time polymerase chain reaction (PCR) for genes encoding nicotinamide adenine dinucleotide and hydrogen (NADH):ubiquinone oxidoreductase core subunit V1 (Ndufv1) and NADH:ubiquinone oxidoreductase core subunit S1 (Ndufs1) (n = 6 biological replicates). (C) Cytosolic concentrations of ATP. (D) Cytosolic concentrations of pyruvate dehydrogenase (PDH) activity. (E to H) Mice were injected with pimonidazole 1 hour before euthanasia. Binding of pimonidazole was detected with hypoxyprobe-1 primary antibody and a Cy-3 conjugated goat anti-mouse secondary antibody (red fluorescence) in the sections of proximal colon that were counterstained with DAPI (4′,6-diamidino-2-phenylindole) nuclear stain (blue fluorescence). (E) Pimonidazole staining was quantified by scoring blinded sections of proximal colon from conventional mice. (F) Representative images of colonic sections from conventional mice are shown. (G) Pimonidazole staining was quantified by scoring blinded sections of proximal colon from germ-free mice. (H) Representative images of colonic sections from germ-free mice are shown. (I) Epithelial transcripts of the indicated genes determined by quantitative real-time PCR in samples from germ-free mice (n = 6 biological replicates). (J) Cytosolic concentrations of ATP in germ-free mice. (K) Cytosolic concentrations of PDH activity in germ-free mice. (L) Mice were inoculated with a 1:1 mixture of E. coli strain Nissle 1917 (wt); an isogenic cydAB mutant and CFU were determined at the indicated time point to calculate the competitive index (CI). (M) Fold change in epithelial Nos2 transcripts was determined by quantitative real-time PCR. Bars represent geometric means ± geometric error (n = 6). (N) Nitrate concentrations were determined in colonic mucus. (O) Mice were inoculated with a 1:1 mixture of E. coli strain Nissle 1917 (wt) and an isogenic napA narG narZ mutant and CFU were determined at the indicated time point to calculate the CI. (A, C to E, G, I, K, and L) Each dot represents data from one animal (biological replicate). *P < 0.05; ** P < 0.01; ***P < 0.001 using an unpaired two-tailed Student’s t test [(A) to (D) and (I) to (O)] or a one-tailed Mann-Whitney test [(E) and (G)].
Fig. 2.
Fig. 2.. E. coli choline catabolism requires nitrate respiration in vitro.
(A) Schematic of choline catabolism encoded by the cut gene cluster of E. coli MS 200-1. (B and C) In vitro growth of E. coli MS 200-1 (wt) and an isogenic cutC mutant in no-carbon essential (NCE) medium supplemented with the indicated nutrients in a hypoxia chamber with 1% oxygen (B) or in an anaerobic chamber (C). (D and C) Expression of the indicated genes was determined by quantitative real-time PCR in RNA isolated from E. coli MS 200-1, which was grown in the indicated media in a hypoxia chamber with 1% oxygen (D) or in an anaerobic chamber (E). (F) In vitro growth in an anaerobic chamber of E. coli MS 200-1 carrying a cloning vector (wt+p), a cutC mutant carrying a cloning vector (cutC+p), and a cutC mutant complemented with the cloned cutC gene (cutC+pcutC) in NCE medium supplemented with the indicated nutrients. (G) Expression of cutC was determined by quantitative real-time PCR in RNA isolated from E. coli MS 200-1 grown under the indicated conditions. (H) In vitro growth of E. coli MS 200-1 (wt) and an isogenic napA narG narZ mutant in NCE medium supplemented with the indicated nutrients, in a hypoxia chamber with 1% oxygen. (B to H) Bars represent geometric means ± geometric error. n = 4 biological replicates (average of triplicate technical replicate per biological replicate). *, P < 0.05; **, P < 0.01; ***, P < 0.001 using an unpaired two-tailed Student’s t test [(B), (C), (G), and (H)] or a one-way analysis of variance (ANOVA) followed by Tukey’s HSD test [(D) to (F)].
Fig. 3.
Fig. 3.. Host-derived electron acceptors license E. coli choline catabolism in vivo.
Mice were reared and maintained on a low-fat diet supplemented with 1% choline or a high-fat diet supplemented with 1% choline unless indicated otherwise. (A) Mice (C57BL/6J) were inoculated with E. coli strain MS 200-1 (wt) or an isogenic cydA napA narG narZ mutant, and CFU of E. coli in the feces were determined. (B and C) Mice (C57BL/6J) were inoculated with the indicated E. coli MS 200-1 strain mixtures, and the CI in the feces was determined 14 (B) or 7 (C) days later. (D) Mice (C57BL/6J) were inoculated with E. coli strain MS 200-1 (wt) or an isogenic cutC mutant, and CFU of E. coli in the feces were determined. (E and F) Mice (C57BL/6J) were mock-treated or received drinking water supplemented with the iNOS-inhibitor aminoguanidine (AG). (E) Nitrate concentrations were determined in colonic mucus. (F) Mice were inoculated with a 1:1 mixture of E. coli strain MS 200-1 (wt); an isogenic cutC mutant and CFU of each E. coli strain in the feces were determined to calculate the CI. (G) Germ-free (Swiss Webster) mice were mono-associated with the indicated E. coli strains, and TMAO levels in the plasma were determined 28 days later. (H) Germ-free (Swiss Webster) mice were engrafted with a defined microbial community containing either E. coli strain MS 200-1 or an isogenic cutC mutant. TMAO levels in the plasma were determined 28 days later. (I) Conventional (C57BL/6J) mice were engrafted with E. coli strain MS 200-1 and maintained on the indicated diet. TMAO levels in the plasma were determined 14 days later. (A to I) Each dot represents data from one animal (biological replicate). *P < 0.05; **P < 0.01; ***P < 0.001 using an unpaired two-tailed Student’s t test [(A) to (F), (H), and (I)] or a one-way ANOVA followed by Tukey’s HSD test (G).
Fig. 4.
Fig. 4.. Restoring normal epithelial physiology blunts an E. coli–induced increase in circulating TMAO levels.
(A and B) Mice (C57BL/6J) maintained on a low- or high-fat diet supplemented with 1% choline were engrafted with E. coli MS 200-1 and received drinking water supplemented with AG or no supplementation (mock). (A) CFU of E. coli in the feces were determined. (B) TMAO levels in the plasma were determined. (C to H) Mice (C57BL/6J) maintained on a low- or high-fat diet supplemented with 1% choline were engrafted with a mixture of E. coli MS 200-1 wild type (wt) and cutC mutant, and received chow supplemented with 5-ASA or no 5-ASA supplementation (mock). (C and D) Mice were injected with pimonidazole one hour before euthanasia. Binding of pimonidazole was detected using hypoxyprobe-1 primary antibody and a Cy-3 conjugated goat anti-mouse secondary antibody (red fluorescence) in the sections of proximal colon that were counterstained with DAPI nuclear stain (blue fluorescence). (C) Representative images of colonic sections from conventional mice are shown. (D) Pimonidazole staining was quantified by scoring blinded sections of proximal colon from conventional mice. (E) Fold change in epithelial Nos2 transcripts was determined by quantitative real-time PCR. Bars represent geometric means ± geometric error. (F and G) The CI was determined 14 (F) and 28 (G) days after engraftment. (H) TMAO levels in the plasma were determined. (A, B, D, and F to H) Each dot represents data from one animal (biological replicate). *P < 0.05; **P < 0.01 using an unpaired two-tailed Student’s t test [(A), (B), and (E)to (H)] or a one-tailed Mann-Whitney test (D).

References

    1. Martínez-del Campo A et al. , mBio 6, e00042–e15 (2015).
    1. Wang Z et al. , Nature 472, 57–63 (2011). - PMC - PubMed
    1. Zhu Y et al. , Proc. Natl. Acad. Sci. U.S.A 111, 4268–4273 (2014). - PMC - PubMed
    1. Devkota S et al. , Nature 487, 104–108 (2012). - PMC - PubMed
    1. Fei N, Zhao L, ISME J. 7, 880–884 (2013). - PMC - PubMed

Publication types

MeSH terms