. 2021 Aug 12;12(1):4900.
doi: 10.1038/s41467-021-25185-3.

PERM1 interacts with the MICOS-MIB complex to connect the mitochondria and sarcolemma via ankyrin B

Affiliations

PERM1 interacts with the MICOS-MIB complex to connect the mitochondria and sarcolemma via ankyrin B

Theresa Bock et al. Nat Commun. .

Abstract

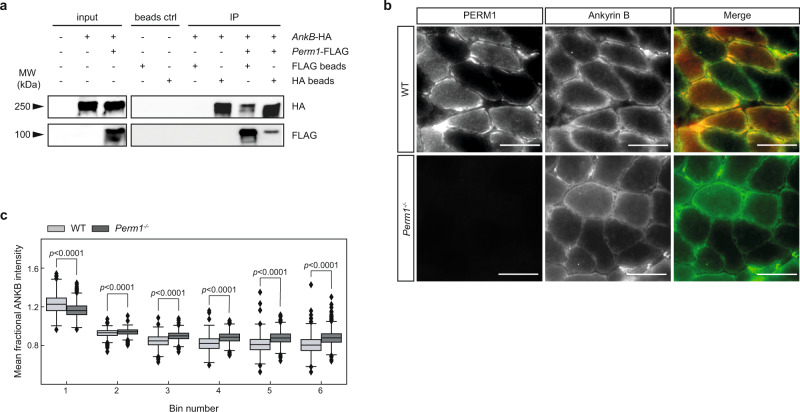
Skeletal muscle subsarcolemmal mitochondria (SSM) and intermyofibrillar mitochondria subpopulations have distinct metabolic activity and sensitivity, though the mechanisms that localize SSM to peripheral areas of muscle fibers are poorly understood. A protein interaction study and complexome profiling identifies PERM1 interacts with the MICOS-MIB complex. Ablation of Perm1 in mice reduces muscle force, decreases mitochondrial membrane potential and complex I activity, and reduces the numbers of SSM in skeletal muscle. We demonstrate PERM1 interacts with the intracellular adaptor protein ankyrin B (ANKB) that connects the cytoskeleton to the plasma membrane. Moreover, we identify a C-terminal transmembrane helix that anchors PERM1 into the outer mitochondrial membrane. We conclude PERM1 functions in the MICOS-MIB complex and acts as an adapter to connect the mitochondria with the sarcolemma via ANKB.


Conflict of interest statement

The authors declare no competing interests.

Figures

Fig. 1
Fig. 1. Deletion of Perm1 reduces muscle force and alters the localization of subsarcolemmal mitochondria.
a Western blot depicting successful depletion of Perm1 in Perm1−/− TA muscle. Correct genotype was confirmed by western blotting for each mouse used in the whole study (n > 20 mice per group). b, c Forced running experiments with metabolic respiratory exchange ratio (RER) measurements. b Percentage of wild-type and Perm1−/− mice that succeeded or failed to run at the indicated speed for two minutes each (n = 9 mice per group). c RER (VCO2/VO2) of wild-type and Perm1−/− mice running at the indicated speed (n = 9 mice per group). d Inverted screen test; the time Perm1−/− and wild-type mice held their body weight on an inverted grid is shown (n = 9 mice per group). e Weight test; the time Perm1−/− and wild-type mice grasped increasing weights is shown (n = 9 mice per group). f Succinate dehydrogenase (SDH) of soleus muscle from Perm1−/− mice indicated an altered overall distribution of mitochondria compared to wild-type control. Scale 25 µm. g qPCR analysis showed decreased in mtDNA copy number in Perm1−/− soleus muscle compared to wild-type controls (n = 3 mice per group). h Left: Electron microscopic inspection of TA muscle showed decreased mitochondrial density at capillaries in Perm1−/− mice compared to wild-type mice. Scale 1 µm. Right: Number of mitochondria per capillary in Perm1−/− and wild-type mice (n = 2 mice per group, 10 quantified capillaries). i Immunohistochemical staining of soleus muscle indicated co-localization of PERM1 (red) with TOM20 (green). Scale 50 µm. Schematic visualization of bin scaling of a single muscle fiber for TOM20 intensity quantification. j Mean fractional intensity of TOM20 signals in bins 1–6 from Perm1−/− and wild-type soleus muscle fibers. Intensity is reduced at subsarcolemmal sites and increased within interfibrillar mitochondria in Perm1−/− muscles compared to wild-type control (n = 2 mice per group, 507 quantified fibers). Data (c, e) are presented as mean values ±0.95 CI. Box plots (d, g, h, j) represent the median, 25th, and 75th percentiles, maximum and minimum are connected through whiskers, and individual data points are added on top (d, g, h). Outliers are defined as Q1− 1.8 interquartile range (IQR) and Q3+1.8 IQR. (ce, g, h) unpaired two-sided Student’s t test, (j) unpaired two-sided Mann–Whitney U-test. Source data are provided as Source Data file.
Fig. 2
Fig. 2. PERM1 is specifically enriched in SSM, and SSM are altered in Perm1−/− muscles.
a, b Volcano plot (a) and boxplot (b) depicting the regulation of PERM1, MitoCarta-annotated, OMM, and MICOS–MIB proteins in isolated IFM and SSM from wild-type TA muscle. Mitochondrial and OMM proteins are enriched in IFM. Inversely, PERM1 is clearly more abundant in the SSM fraction (n = 3 mice per group). c, d Comparison of log2 differences in MitoCarta 2.0 proteins compared to the complete dataset revealed no changes in the overall regulation of mitochondrial proteins in (c) isolated IFM of Perm1−/− TA muscle compared to wild-type control, though MitoCarta-annotated proteins were significantly reduced in (d) isolated SSM from Perm1−/− TA muscle compared to wild-type control (n = 3 mice per group). e, f) Volcano plots highlighting the regulation of sarcomeric proteins and proteins of the MICOS–MIB complex in (e) isolated IFM from Perm1−/− TA compared to wild-type control and in (f) isolated SSM from Perm1−/− TA compared to wild-type control (n = 3 mice per group). Box plots (b, c, d, e) represent the median, 25th, and 75th percentiles, maximum and minimum are connected through whiskers. Outliers are defined as Q1–1.8 IQR and Q3+1.8 IQR. bd unpaired two-sided Mann-Whitney U-test. Source data are provided in Supplementary Data 1.
Fig. 3
Fig. 3. Inactivation of Perm1 affects mitochondrial proteins related to transportation and breakdown of ROS.
a Protein levels of PERM1 at different timepoints in TA muscle determined by western blotting. Normalized protein levels are expressed relative to the mean levels of each protein in the stain-free control (n = 3 mice per time point). b Comparison of the log2 differences in MitoCarta 2.0 proteins compared to the complete dataset revealed overall downregulation of mitochondrial proteins in TA muscle isolated from Perm1−/− mice compared to wild-type controls (n = 2 mice per group). c Western blot and quantification of TOM20 in Perm1−/− TA muscle and wild-type controls, substantiating the reduced mitochondrial content (n = 3 mice per group). d, e Volcano plots depicting significantly regulated proteins in Perm1−/− TA muscle (d) and isolated TA muscle mitochondria (e) at 11 pm compared to wild-type controls (n = 2 mice per group). Cut-off was defined as p < 0.05 with a fold change >1.5. Darker colors indicate the MitoCarta 2.0 annotations. f Western blot and quantification, depicting downregulation of BNIP3 in TA muscle and isolated TA muscle mitochondria from Perm1−/− mice. BNIP3 levels are expressed relative to the mean levels in wild-type control samples (n = 2 mice per group). Box plot (b) represents the median, 25th, and 75th percentiles, maximum and minimum are connected through whiskers. Outliers are defined as Q1–1.8 IQR and Q3+1.8 IQR. a, d, e Unpaired two-sided Student’s t test, S0=0.1, (c) unpaired two-sided Student’s t test, (b) unpaired two-sided Mann–Whitney U-test. Source data are provided as Source Data file and in Supplementary Data 2.
Fig. 4
Fig. 4. Perm1-deficient muscles show reduced oxygen flux and faster turnover of mitochondrial proteins.
a High-resolution respirometry of isolated muscle mitochondria showing decreased specific oxygen flux in isolated Perm1−/− mitochondria compared to wild-type controls (n = 3 mice per group). b FDB muscle fibers were loaded with 2.5 nM TMRM. Arrows indicate the addition of 5 µM oligomycin and 4 µM FCCP (n = 10 fibers in wild-type, n = 20 fibers in Perm1−/−). c Comparison of the Lys6-incorporation rates of all proteins, mitochondrial proteins, OMM proteins, IMM proteins, and proteins of the MICOS–MIB complex in wild-type mice fed a SILAC diet for 14 days (n = 3 mice per group). DNAJC11 and PERM1 had higher incorporation rates than other MICOS–MIB proteins. d Ratios of Perm1−/− to wild-type control Lys6-incorporation rates for MitoCarta 2.0 proteins and MICOS–MIB proteins in comparison to the complete TA muscle dataset after feeding with a SILAC diet for 14 days. Enhanced labeling of mitochondrial proteins and MICOS–MIB proteins was observed in Perm1−/− mice (n = 3 mice per group). e, f Density plots of the ratios of Perm1−/− to wild-type control Lys6-incorporation for non-MitoCarta 2.0 and MitoCarta 2.0-annotated proteins, showing enhanced labeling of mitochondrial proteins in Perm1−/− (e) TA but not in (f) Perm1−/− brain. Data (a) are presented as mean values ± 0.95 CI. Box plots (c, d) represent the median, 25th, and 75th percentiles, maximum and minimum are connected through whiskers. Outliers are defined as Q1–1.8 IQR and Q3+1.8 IQR. (a) paired two-sided Student’s t test, (d, e, f) unpaired two-sided Mann-Whitney U-test. Source data are provided as Source Data file and in Supplementary Data 3. PMG (pyruvate, malate, glutamate), S (succinate), ETS (electron transfer system), ROX (residual oxygen consumption), Olm (oligomycin).
Fig. 5
Fig. 5. PERM1 interacts with components of the mitochondrial intermembrane bridging complex.
a Volcano plot depicting significantly enriched proteins after immunoprecipitation of endogenous PERM1 in TA muscle (n = 3 mice per group). Cut-off was set to p < 0.05 with a fold change >1.5. Dark circles indicate MitoCarta 2.0 annotation. b Bar diagram showing the number of significantly enriched proteins (same cut-off as in volcano plot) identified in one, two, three, or all four immunoprecipitation approaches highlighting the most frequently found proteins. cf Complexome profiling of muscle mitochondria; iBAQ-values were maximum normalized. Arrows indicate the three main complex assemblies. c Single profiles of the MICOS complex proteins MIC60, MIC19, and MIC27. d Summary plot of all MICOS complex members detected (MIC10, MIC19, MIC26, MIC27, and MIC60). e Single profiles of the SAM complex proteins SAM50 and MTX2, as well PERM1. f Summary plot of all detected MICOS complex members (red line), SAM components (green line; SAM50, MTX2), and PERM1 (blue line). g Deletion of the transmembrane helix in PERM1 resulted in loss of PERM1 in the mitochondrial fraction, as visualized by immunoblotting of cytosolic and mitochondrial fractions obtained from HEK-293T cells transfected with FLAG-tagged wild-type Perm1 and FLAG-tagged ΔTM mutant. h Volcano plot depicting significantly enriched proteins after immunoprecipitation of PERM1 in HEK-293T cells transfected with FLAG-tagged wild-type Perm1 and FLAG-tagged ΔTM mutant (n = 3 samples per group). The cut-off was an FDR < 0.05; dark circles indicate MitoCarta 2.0 annotations. MICOS proteins MIC60 and MIC19 were only found in wild-type immunoprecipitates, while ANKB and PERM1 were similarly enriched in wild-type and ΔTM immunoprecipitates. a unpaired two-sided Student’s t test, S0 = 0.1, h unpaired two-sided Student’s t test, S0=0.1, permutation-based FDR=0.05, 500 randomizations. Source data are provided as Source Data file and in Supplementary Data 4.
Fig. 6
Fig. 6. PERM1 associates with ankyrin B and the interaction with the MICOS–MIB complex is dependent on the transmembrane helix.
a PERM1 interacts with ANKB, as indicated by immunoprecipitation of FLAG-tagged Perm1 and HA-tagged ankyrin-B in TREx-293 cells stably expressing Perm1-FLAG. Protein lysates were immunoprecipitated with anti-FLAG beads and anti-HA beads and immunoblotted with anti-FLAG and anti-HA antibodies. b Immunohistochemical staining of soleus muscle revealed co-localization of PERM1 (red) with ANKB (green). Scale, 50 µm. c Mean fractional intensity of ANKB signals in bins 1–6 from Perm1−/− and wild-type soleus muscle fibers. ANKB staining intensity was reduced at subsarcolemmal sites and increased within interfibrillar mitochondria in Perm1−/− muscles compared to wild-type controls (n = 4 mice per group, 2299 quantified fibers). Box plot (c) represents the median, 25th, and 75th percentiles, maximum and minimum are connected through whiskers. Outliers are defined as Q1–1.8 IQR and Q3+1.8 IQR. (c) unpaired two-sided Mann-Whitney U-test. Source data are provided as Source Data file.

References

    1. Schiaffino S, Reggiani C. Fiber types in mammalian skeletal muscles. Physiol. Rev. 2011;91:1447–1531. doi: 10.1152/physrev.00031.2010. - DOI - PubMed
    1. Hawley JA, Hargreaves M, Joyner MJ, Zierath JR. Integrative biology of exercise. Cell. 2014;159:738–749. doi: 10.1016/j.cell.2014.10.029. - DOI - PubMed
    1. Riva A, Tandler B, Loffredo F, Vazquez E, Hoppel C. Structural differences in two biochemically defined populations of cardiac mitochondria. Am. J. Physiol. Heart Circ. Physiol. 2005;289:H868–H872. doi: 10.1152/ajpheart.00866.2004. - DOI - PubMed
    1. Glancy B, et al. Mitochondrial reticulum for cellular energy distribution in muscle. Nature. 2015;523:617–620. doi: 10.1038/nature14614. - DOI - PMC - PubMed
    1. Koves TR, et al. Subsarcolemmal and intermyofibrillar mitochondria play distinct roles in regulating skeletal muscle fatty acid metabolism. Am. J. Physiol. Cell Physiol. 2005;288:C1074–C1082. doi: 10.1152/ajpcell.00391.2004. - DOI - PubMed

Publication types

MeSH terms