. 2021 Aug 12;12(1):4906.
doi: 10.1038/s41467-021-25103-7.

An N-Cadherin 2 expressing epithelial cell subpopulation predicts response to surgery, chemotherapy and immunotherapy in bladder cancer

Affiliations

An N-Cadherin 2 expressing epithelial cell subpopulation predicts response to surgery, chemotherapy and immunotherapy in bladder cancer

Kenneth H Gouin 3rd et al. Nat Commun. .

Abstract

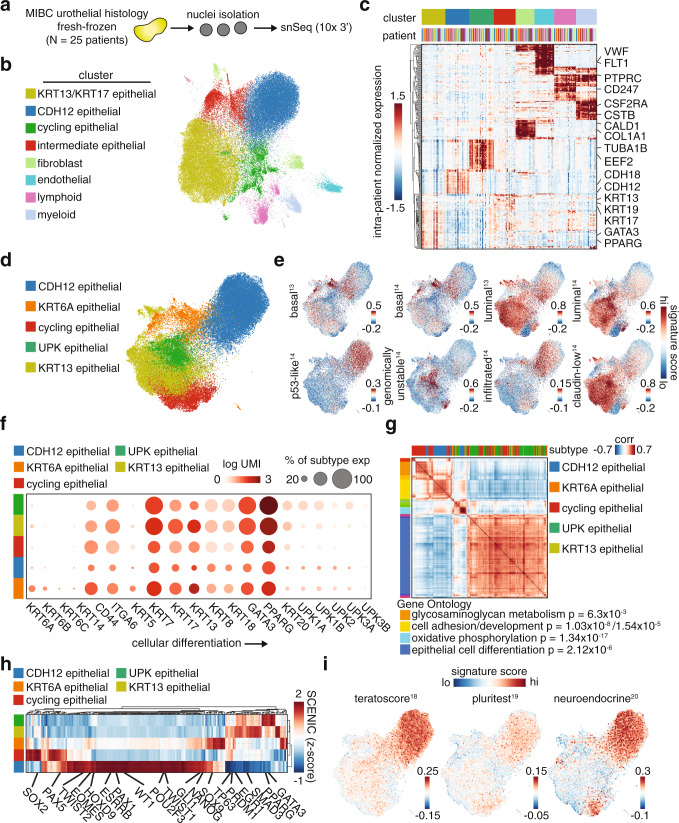
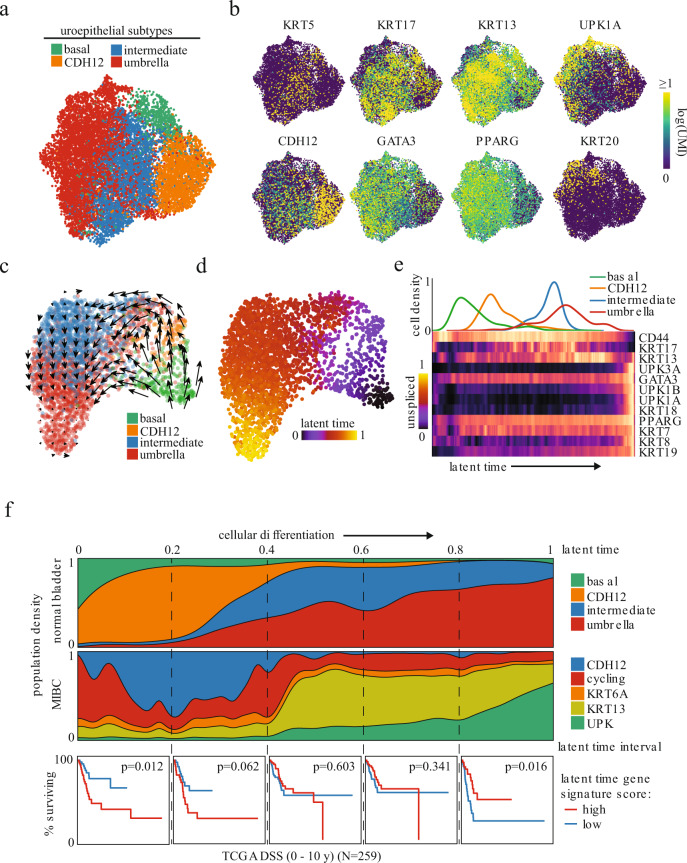
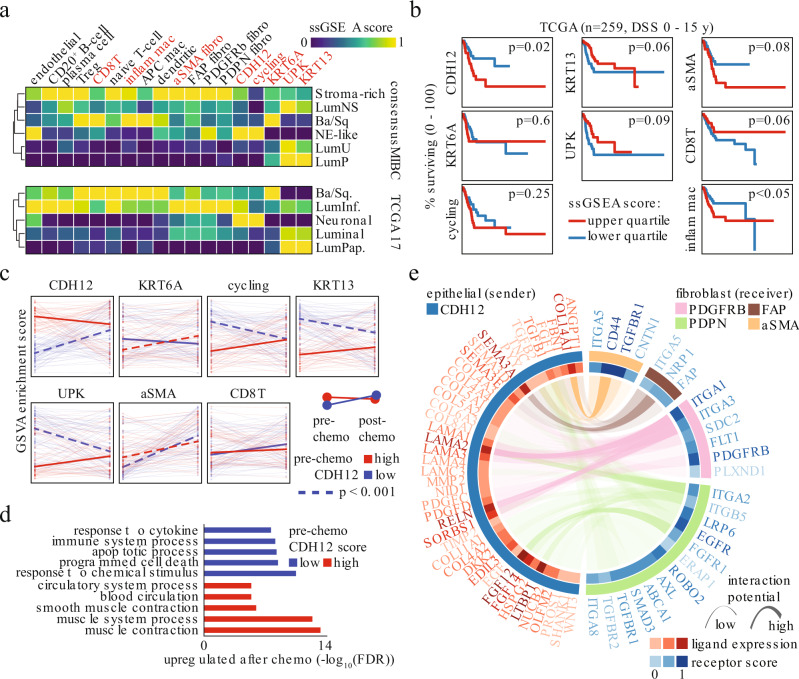
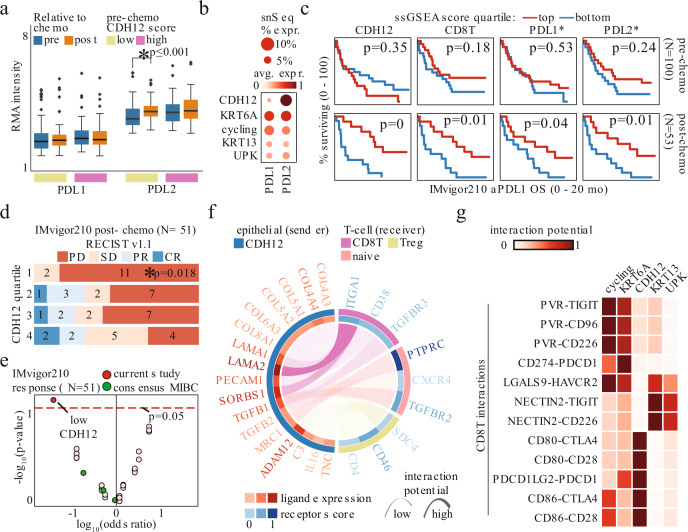
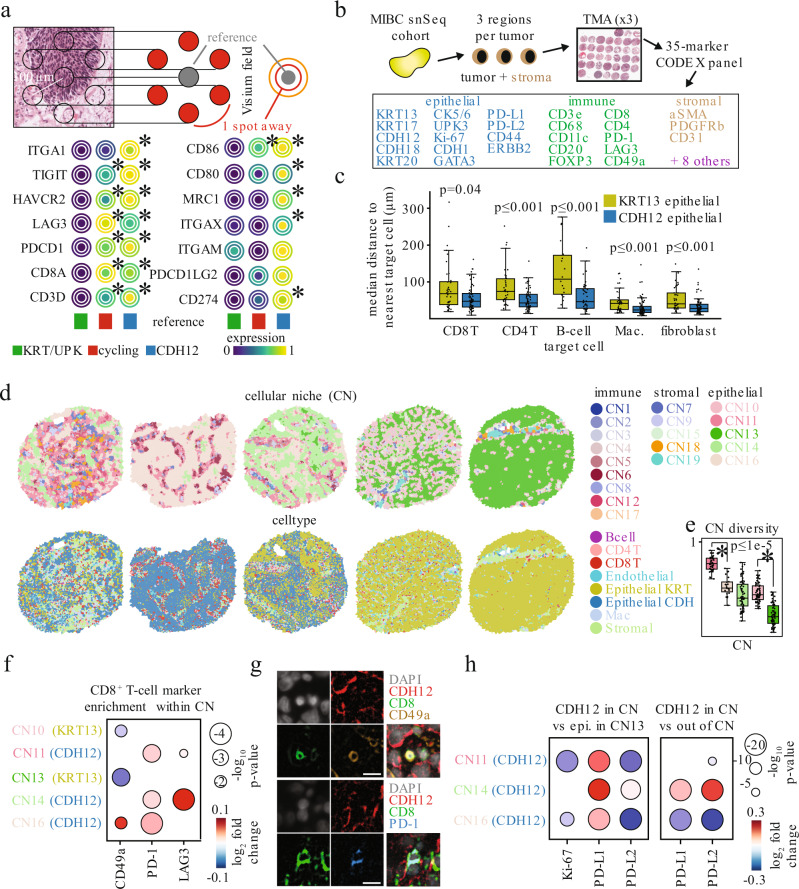
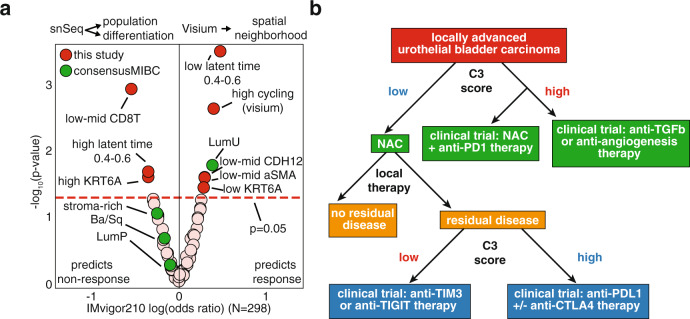
Neoadjuvant chemotherapy (NAC) prior to surgery and immune checkpoint therapy (ICT) have revolutionized bladder cancer management. However, stratification of patients that would benefit most from these modalities remains a major clinical challenge. Here, we combine single nuclei RNA sequencing with spatial transcriptomics and single-cell resolution spatial proteomic analysis of human bladder cancer to identify an epithelial subpopulation with therapeutic response prediction ability. These cells express Cadherin 12 (CDH12, N-Cadherin 2), catenins, and other epithelial markers. CDH12-enriched tumors define patients with poor outcome following surgery with or without NAC. In contrast, CDH12-enriched tumors exhibit superior response to ICT. In all settings, patient stratification by tumor CDH12 enrichment offers better prediction of outcome than currently established bladder cancer subtypes. Molecularly, the CDH12 population resembles an undifferentiated state with inherently aggressive biology including chemoresistance, likely mediated through progenitor-like gene expression and fibroblast activation. CDH12-enriched cells express PD-L1 and PD-L2 and co-localize with exhausted T-cells, possibly mediated through CD49a (ITGA1), providing one explanation for ICT efficacy in these tumors. Altogether, this study describes a cancer cell population with an intriguing diametric response to major bladder cancer therapeutics. Importantly, it also provides a compelling framework for designing biomarker-guided clinical trials.


Conflict of interest statement

K.H.G., N.I., C.J.R., S.R.V.K., and D.T. have filed a provisional patent (Application no. 63/197,129 “USE OF CANCER CELL EXPRESSION OF CADHERIN 12 AND CADHERIN 18 TO TREAT MUSCLE INVASIVE AND METASTATIC BLADDER CANCERS”) based on the biomarker features of the CDH12 population defined in this work. All other authors declare no competing interests.

Figures

Fig. 1
Fig. 1. Discovery of a CDH12+ tumor cell population by single-nucleus sequencing.
a Workflow for single nucleus sequencing; MIBC—muscle invasive bladder cancer. b UMAP of all nuclei (71,832) in MIBC dataset colored by unsupervised clustering. c Average gene expression per patient of marker genes for each cell type in b. d UMAP of all epithelial nuclei (52,983) in MIBC dataset colored by epithelial population. e Gene signature scores for published MIBC subtype gene sets. f Uroepithelial differentiation-related marker gene expression in each epithelial population, where the dot size indicates the percent of cells within the subtype with non-zero expression of the respective gene. g Gene-gene correlations partitioned into co-expression modules annotated for epithelial population enrichment. Gene ontology (GO) annotations are included with g:SCS multiple testing corrected p-values for hypergeometric testing. h Activity scores for SCENIC transcription factor regulons in each epithelial population. i Gene signature scores for stem-cell and neuroendocrine differentiation gene sets.
Fig. 2
Fig. 2. CDH12+ tumor population resembles characteristics of early undifferentiated urothelial cells and correlates with poor clinical outcome.
a UMAP of 12,819 uroepithelial nuclei obtained from histologically normal bladder and colored by unsupervised clustering. b Uroepithelial differentiation-related marker gene expression. c RNA velocity latent time trajectory in healthy bladder epithelial nuclei from a representative patient. d RNA velocity-based latent time of the nuclei shown in c. e Epithelial population density (top) and heatmap of uroepithelial marker gene expression (bottom) in nuclei from d ordered by increasing latent time. f Epithelial population distribution across latent time for all normal samples combined (top row) or MIBC samples based on normal nearest neighbor analysis (middle row). Normal samples were combined by collating the latent times from velocity analyses performed on each of the 4 samples independently. Disease-specific survival of high-grade MIBC in TCGA stratified by gene signature scores derived from MIBC nuclei in the latent time intervals demarcated by the dashed lines (bottom row, log-rank test between top and bottom quartiles N = 259).
Fig. 3
Fig. 3. High CDH12 scores predict chemoresistance and fibroblast activation.
a Average snSeq-derived signature scores in molecular subtypes of TCGA MIBC cases (N = 259). Signatures highlighted in orange are shown in b. b Disease specific survival of high-grade MIBC in TCGA stratified by snSeq population signatures (log-rank test between top and bottom quartiles, N = 259). c Tracking of 7 snSeq population signature scores in matched pre-chemo (left edge) and post-chemo samples (right edge) stratified by their pre-chemo CDH12 signature score (dark line indicates median of all samples shown as light lines, blue lines—low pre-chemo CDH12 score, red lines—high pre-chemo CDH12 score) (dashed line indicates p < 0.001 for post-versus pre-chemo scores, Wilcoxon paired one-sided rank-sum test). d GO term enrichment (hypergeometric overlap test) for genes up-regulated post-chemo in tumors with low or high CDH12 score in the pre-chemo setting. e snSeq-derived receptor-ligand interactions significantly enriched between the CDH12 population and each fibroblast population (see Methods for details).
Fig. 4
Fig. 4. Post-chemo CDH12 score predicts favorable response to immune checkpoint therapy.
a PDL1 and PDL2 in matched pre-chemo and post-chemo samples (* - Wilcoxon paired two-sided rank-sum test p < 0.05; n = 65 for low CDH12, n = 49 for high CDH12). Boxplots are drawn as the inter-quartile range (IQR) with a line indicating the median, and outliers defined as points that fall outside of the range demarcated by 1.5*IQR. Source data are available as a Source data file. b PDL1 and PDL2 expression in snSeq tumor epithelial cells. c Overall survival in IMvigor 210 Cohort 2 bladder tumors sequenced pre-chemo (top, N = 100) or post-chemo (bottom, N = 53) stratified by snSeq-derived population signature scores, or gene expression value (log-rank test, p = 0 indicates p < 0.001; * indicates gene expression). d RECIST v1.1 response in bladder tumors profiled post-chemo stratified by CDH12 score quartile; progressive disease (PD), stable disease (SD), partial response (PR), complete response (CR) (* - Fisher exact test for PD vs PR/CR in quartile 1 vs quartile 4, N = 51). e Association of snSeq-derived signature scores, or consensus MIBC subtypes, with RECIST v1.1 response in the IMvigor 210 Cohort 2 cases shown in d (Fisher exact test, N = 51). f snSeq-derived receptor-ligand interactions significantly enriched between CDH12 population and each T-cell population. g snSeq-derived receptor-ligand interaction potential of co-inhibitory signaling from epithelial populations to the CD8T population.
Fig. 5
Fig. 5. CDH12 tumor cells preferentially colocalize with T-cells expressing CD49a, PD-1, and LAG3.
a Schematic for topological analysis on the Visium spot hexagonal grid where the average expression of a gene is shown in a reference spot (gray) along with the average expression of the same gene in the spots located 1 spot away from the reference (red) or 2 spots away from the reference (orange) (top). Average expression of T-cell exhaustion and other immune markers surrounding spots enriched for each of 3 different Visium-derived epithelial signatures (bottom). * indicates p < 0.05 using a Fisher exact test for testing the association of expression of a given gene with enrichment of a given epithelial score. b Schematic of a MIBC tissue microarray (TMA) for multiplexed immunohistochemistry via CO-Detection by indEXing (CODEX). The CODEX panel consisted of 35 markers targeting epithelial, immune, and stromal cell types identified via snSeq analysis. c Median spatial distance per TMA spot of KRT13+ (yellow) or CDH12+ (blue) epithelial cells to the nearest B-cell, CD4+ T-cell, CD8+ T-cell, macrophage, or fibroblast. * - Mann-Whitney, two-sided, p < 0.05. n = 36, 63, 34, 63, 18, 40, 40, 66, 41, 68 for each box from left to right. Source data are available as a Source data file. d Voronoi diagrams of cellular neighborhoods (CN; top) and cell types (bottom). CN’s were identified by k-means clustering the distribution of cell types neighboring each cell. Spots were chosen based on the number of cells belonging to each of the 5 epithelial cell enriched CN’s. e Cellular diversity measured by the Shannon entropy of the cell types composing each of 5 epithelial enriched CN’s. * - Mann-Whitney, two-sided, p < 0.05. n = 42, 23, 63, 68, 67 for each box from left to right. Source data are available as a Source data file. f Marker intensity enrichment on CD8+ T-cells residing within each CN, compared against CD8+ T-cells residing in any other CN. Only Wilcoxon (two-sided) p < 0.05 are shown. g Sample images from n = 1 representative sample depicting a CD49a+ CD8+ T-cell (top), and PD-1+ CD8+ T-cell (bottom) in the immediate vicinity of CDH12+ epithelial cells in-situ. Scale bar - 11 μm. h Marker intensity enrichment on CDH12+ epithelial cells within each CDH12 enriched CN compared with CDH12- epithelial cells within CN13 (left) or CDH12+ cells residing in any other CN (right). Only Wilcoxon (two-sided) p < 0.05 are shown. Boxplots are drawn as the inter-quartile range (IQR) with a line indicating the median, and outliers defined as points that fall outside of the range demarcated by 1.5*IQR.
Fig. 6
Fig. 6. Gene signatures derived from single-nuclei sequencing and spatial transcriptomics outperforms bulk-RNA sequencing-based consensus classifiers in predicting response to immune checkpoint therapy.
a Association of snSeq/Visium-derived signature scores, or consensus MIBC subtypes, with RECIST v1.1 response in IMvigor 210 Cohort 2 (N = 298, Fisher exact test). b Flow chart for incorporating a CDH12 score into clinical decision making for treatment-naïve and chemoresistant tumors.

Comment in

References

    1. Nadal R, Bellmunt J. Management of metastatic bladder cancer. Cancer Treat. Rev. 2019;76:10–21. doi: 10.1016/j.ctrv.2019.04.002. - DOI - PubMed
    1. Witjes JA, et al. European association of urology guidelines on muscle-invasive and metastatic bladder cancer: summary of the 2020 guidelines. Eur. Urol. 2020 doi: 10.1016/j.eururo.2020.03.055. - DOI - PubMed
    1. Patel, V. G., Oh, W. K. & Galsky, M. D. Treatment of muscle-invasive and advanced bladder cancer in 2020. CA Cancer J. Clin., 10.3322/caac.21631 (2020). - PubMed
    1. Tran, L., Xiao, J., Agarwal, N., Duex, J. E. & Theodorescu, D. Scientific advances transforming bladder cancer care. Nat. Rev. Cancer (2021, in press). - PMC - PubMed
    1. Hedegaard J, et al. Comprehensive transcriptional analysis of early-stage urothelial carcinoma. Cancer Cell. 2016;30:27–42. doi: 10.1016/j.ccell.2016.05.004. - DOI - PubMed

Publication types

MeSH terms