. 2021 Aug 12;7(1):67.
doi: 10.1038/s41522-021-00238-z.

CO2 enhances the formation, nutrient scavenging and drug resistance properties of C. albicans biofilms

Affiliations

CO2 enhances the formation, nutrient scavenging and drug resistance properties of C. albicans biofilms

Daniel R Pentland et al. NPJ Biofilms Microbiomes. .

Abstract

C. albicans is the predominant human fungal pathogen and frequently colonises medical devices, such as voice prostheses, as a biofilm. It is a dimorphic yeast that can switch between yeast and hyphal forms in response to environmental cues, a property that is essential during biofilm establishment and maturation. One such cue is the elevation of CO2 levels, as observed in exhaled breath for example. However, despite the clear medical relevance, the effect of CO2 on C. albicans biofilm growth has not been investigated to date. Here we show that physiologically relevant CO2 elevation enhances each stage of the C. albicans biofilm-forming process: from attachment through maturation to dispersion. The effects of CO2 are mediated via the Ras/cAMP/PKA signalling pathway and the central biofilm regulators Efg1, Brg1, Bcr1 and Ndt80. Biofilms grown under elevated CO2 conditions also exhibit increased azole resistance, increased Sef1-dependent iron scavenging and enhanced glucose uptake to support their rapid growth. These findings suggest that C. albicans has evolved to utilise the CO2 signal to promote biofilm formation within the host. We investigate the possibility of targeting CO2-activated processes and propose 2-deoxyglucose as a drug that may be repurposed to prevent C. albicans biofilm formation on medical airway management implants. We thus characterise the mechanisms by which CO2 promotes C. albicans biofilm formation and suggest new approaches for future preventative strategies.


Conflict of interest statement

The authors declare no competing interests.

Figures

Fig. 1
Fig. 1. The effect of high CO2 (5%) on C. albicans biofilm formation.
a Reference strain biofilms were seeded and grown for 24 or 48 h in 0.03% or 5% CO2; the resulting biofilms were quantified using the XTT assay with absorbance at 492 nm as a readout. b Representative images of C. albicans (SN250 strain) biofilms grown in 0.03% and 5% CO2 for 48 h (red colouration due to XTT assay). c SN250 biofilms were seeded on chamber slides and grown for 24 or 48 h in 0.03% or 5% CO2 before staining with SPYRO Ruby biofilm matrix stain. Z-stacks were taken using ×20 objective magnification and biofilm thickness was quantified. Graphs represent three biological replicates, error bars denote standard deviation. Paired two-tail t tests were carried out: ***p < 0.001, n.s. = not significant.
Fig. 2
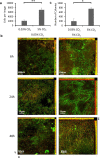
Fig. 2. The effects of CO2 on C. albicans biofilm growth.
a Attachment: C. albicans CAI-4 cells were seeded onto silicone-coated microscope slides under 0.03% or 5% CO2 and images were taken at ×20 objective magnification. Cells per image were counted and the mean was calculated across three biological replicates (five images per replicate). A paired two-tail t test was carried out: **p < 0.01. Error bars denote standard deviation. b Maturation: Biofilms were seeded on silicone-coated microscope slide and grown for 6, 24 and 48 h. Biofilms were stained with ConA-FITC (green) and FUN-1 (red). Z-stack images were taken using ×20 (6 h) and ×40 (24 and 48 h) magnifications. Experiments were repeated in triplicate and representative maximum intensity images are presented as well as Z-stack profiles. c Dispersion: Spent media was collected from biofilms grown for 48 h in 0.03% or 5% CO2 and diluted 1:10 before being plated to assess the number of colonies. Three biological replicates each containing technical triplicates were conducted, error bars denote standard deviation. A paired two-tail t test was carried out: *p < 0.05.
Fig. 3
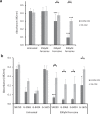
Fig. 3. Biofilm growth assays of C. albicans Ras1-Cyr1-PKA pathway and central biofilm regulator null mutants.
Cells were seeded and counted or grown as biofilms for 48 h before XTT quantification. a Biofilm growth assay using Ras1-Cyr1(Cdc35)-PKA pathway null mutants. b Attachment assay on silicone surface using ras1Δ/Δ and cdc35Δ/Δ mutants. c Biofilm growth assay using central biofilm regulator null mutants. Graphs represent three biological replicates, error bars denote standard deviation. Two-way ANOVAs followed by Tukey tests for multiple comparisons were carried out: *p < 0.05, **p < 0.01, ***p < 0.001. Asterisks directly above the bars indicate a significant difference to the wild type in the same CO2 environment.
Fig. 4
Fig. 4. The effect of high (5%) CO2 on iron homoeostasis in C. albicans biofilms.
a Biofilm growth assay using iron homoeostatic pathway null mutants. Biofilms were seeded and grown for 48 h before XTT quantification. b Iron homoeostatic mutants were seeded on a silicone surface and the number of attached cells were quantified from microscopic images. Graphs represent at least three biological replicates each containing technical triplicates, error bars denote standard deviation. Two-way ANOVAs followed by Tukey tests for multiple comparisons were carried out: *p < 0.05, **p < 0.01, ***p < 0.001. c Immunoblot of Sef-Myc and PGK1 (internal standard) from 48 h biofilms in wild-type, sfu1Δ/Δ, and ssn3Δ/Δ backgrounds.
Fig. 5
Fig. 5. The effect of high (5%) CO2 on iron starvation in C. albicans biofilms.
Biofilms were seeded and grown for 48 h in the presence of the Fe2+ chelator Ferrozine before XTT quantification. a Iron starvation biofilm growth assay using the SN250 reference strain. Graph represents six biological replicates each containing technical triplicates, error bars denote standard deviation. b Iron starvation biofilm growth assay using clinical isolates. Graph represents three biological replicates each containing technical triplicates, error bars denote standard deviation. Two-way ANOVAs followed by Tukey tests for multiple comparisons were carried out: *p < 0.05, **p < 0.01, ***p < 0.001.
Fig. 6
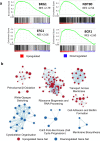
Fig. 6. Global gene expression changes in 5% CO2 vs. 0.03% CO2C. albicans biofilms.
a GSEA enrichment plots of central biofilm regulator gene sets with altered expression levels as assessed by RNA Sequencing; four of the nine identified core regulators of biofilm formation (Brg1, Efg1, Ndt80, and Bcr1) were identified as having positive GSEA scores. Vertical black lines represent individual genes in the significantly differentially expressed ranked gene list from upregulated (left) to downregulated (right). The enrichment score increases if there are lots of genes towards the beginning of the ranked list (upregulated). NES normalised enrichment score; positive NES indicates enrichment in the upregulated group of genes. b Gene set cluster map showing the most upregulated and downregulated gene sets as determined by GSEA along with their cellular functions. Each circle is a gene set and the lines between them depict how much they overlap, thicker line = more genes in common.
Fig. 7
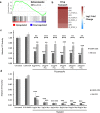
Fig. 7. Adhesion and transport processes are upregulated in 5% CO2C. albicans biofilms.
a GSEA enrichment plot of the BIOLOGICAL ADHESION_BIO and TRANSPORTER ACTIVITY_MOL, AMINO ACID TRANSPORT_BIO and CARBOHYDRATE TRANSPORTER ACTIVITY_MOL gene sets containing genes under the GO terms ‘transporter activity’ and ‘amino acid transport’. NES normalised enrichment score; positive NES indicates enrichment in the upregulated group of genes. b Heat map of significantly differentially expressed genes associated with cell adhesion, amino acid transport and glucose transport as identified by GO Slim process analysis. The colours saturate at log2 fold change of 2 and −2.
Fig. 8
Fig. 8. Antifungal sensitivity of C. albicans biofilms grown in high (5%) CO2.
a GSEA enrichment plot of the KETOCONAZOLE_UP gene set containing genes upregulated in C. albicans cells grown in the presence of Ketoconazole. NES normalised enrichment score; positive NES indicates enrichment in the upregulated group of genes. b Heat map of genes associated with drug transport, including the multidrug efflux pump gene MDR1. c Biofilm growth assay of CAI4pSM2 in the presence of Fluconazole. d Biofilm growth assay of CAI4pSM2 in the presence of Nystatin. The relative XTT activity is presented with the 0.03% CO2 biofilms being normalised to the 0.03% CO2 untreated control and the 5% CO2 biofilms being normalised to the 5% CO2 untreated control. Two-way ANOVAs followed by Tukey tests for multiple comparisons were carried out: *p < 0.05, **p < 0.01, ***p < 0.001. Asterisks directly above the bars indicate a significant difference to untreated in the same CO2 environment.
Fig. 9
Fig. 9. Efficacy of potential treatments to combat C. albicans biofilms grown in high (5%) CO2.
Biofilms were seeded and grown for 48 h before XTT quantification. a Biofilm growth assay of SN250 in the presence of the Fe3+ chelator Deferasirox. Graph represents two biological replicates each containing technical triplicates, error bars denote standard deviation. b Biofilm growth assay of SN250 in the presence of the glycolytic inhibitor 2-DG. Graph represents three biological replicates each containing technical triplicates, error bars denote standard deviation. Two-way ANOVAs followed by Tukey tests for multiple comparisons were carried out: *p < 0.05, ***p < 0.001. Asterisks directly above the bars indicate a significant difference to the untreated SN250 in the same CO2 environment. c Representative images of SN250 biofilms grown in 5% CO2 ± 2-DG for 48 h.
Fig. 10
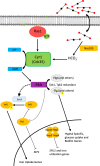
Fig. 10. Predicted model of the interplay between CO2 signalling and iron homoeostasis in C. albicans biofilms on silicone surfaces.
High environmental levels of CO2 drive biofilm formation via the Ras1-Cyr1-PKA pathway in the same way as previously shown for hyphal morphogenesis in planktonic cells. This is accompanied by an increase in iron-scavenging capability by biofilm-associated cells. Our data are consistent with a CO2-mediated activation of PKA via Cyr1 resulting in increased abundance and activity of Sef1 in an Ssn3-dependent manner (this process may also involve the inhibition of Sfu1). Subsequent increased expression of iron uptake genes thus enables more effective scavenging of environmental iron.

Similar articles

Cited by

References

    1. Berman J, Sudbery PE. Candida albicans: a molecular revolution built on lessons from budding yeast. Nat. Rev. Genet. 2002;3:918–930. doi: 10.1038/nrg948. - DOI - PubMed
    1. Ganguly S, Mitchell AP. Mucosal biofilms of Candida albicans. Curr. Opin. Microbiol. 2011;14:380–385. doi: 10.1016/j.mib.2011.06.001. - DOI - PMC - PubMed
    1. Douglas LJ. Candida biofilms and their role in infection. Trends Microbiol. 2003;11:30–36. doi: 10.1016/S0966-842X(02)00002-1. - DOI - PubMed
    1. Berman J. Candida albicans. Curr. Biol. 2012;22:620–622. doi: 10.1016/j.cub.2012.05.043. - DOI - PubMed
    1. Talpaert MJ, et al. Candida biofilm formation on voice prostheses. J. Med. Microbiol. 2015;64:199–208. doi: 10.1099/jmm.0.078717-0. - DOI - PubMed

Publication types

MeSH terms