. 2021 Aug 12;11(1):15166.
doi: 10.1038/s41598-021-94157-w.

Thoracic weighting of restrained subjects during exhaustion recovery causes loss of lung reserve volume in a model of police arrest

Affiliations

Thoracic weighting of restrained subjects during exhaustion recovery causes loss of lung reserve volume in a model of police arrest

Mark Campbell et al. Sci Rep. .

Abstract

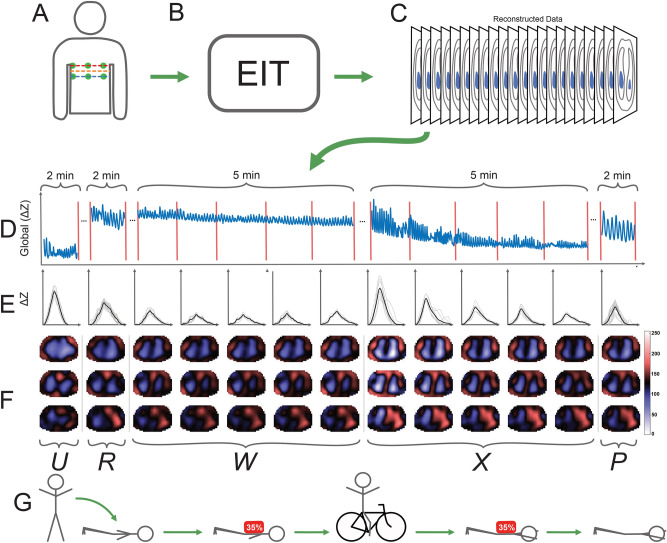
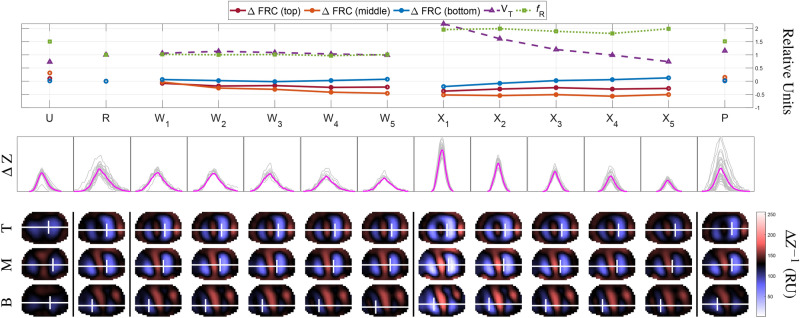
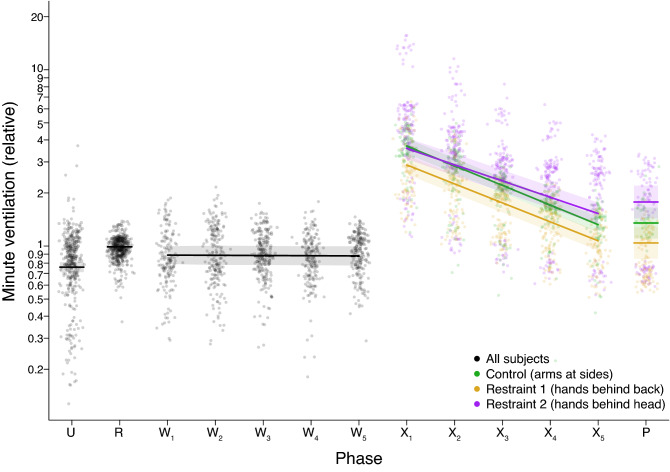
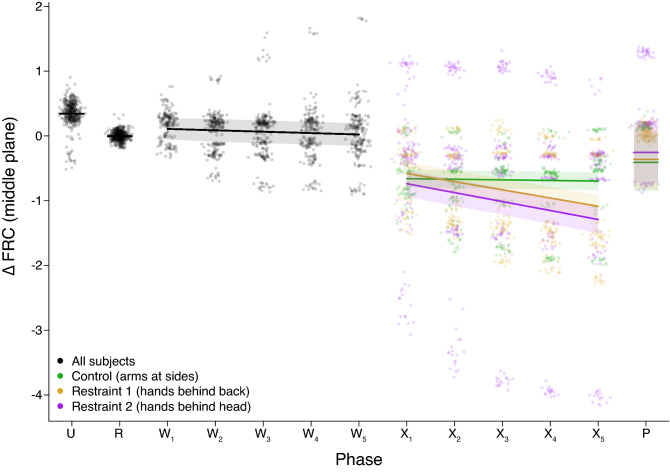
Restraint asphyxia has been proposed as a mechanism for some arrest-related deaths that occur during or shortly after a suspect is taken into custody. Our analysis of the literature found that prone positioning, weight applied to the back, recovery after simulated pursuit, and restraint position have led to restrictive, but non life-threatening respiratory changes when tested in subsets. However, the combined effects of all four parameters have not been tested together in a single study. We hypothesized that a complete protocol with high-sensitivity instrumentation could improve our understanding of breathing physiology during weighted restraint. We designed an electrical impedance tomography (EIT)-based protocol for this purpose and measured the 3D distribution of ventilation within the thorax. Here, we present the results from a study on 17 human subjects that revealed FRC declines during weighted restrained recovery from exercise for subjects in the restraint postures, but not the control posture. These prolonged FRC declines were consistent with abdominal muscle recruitment to assist the inspiratory muscles, suggesting that subjects in restraint postures have increased work of breathing compared to controls. Upon removal of the weighted load, lung reserve volumes gradually increased for the hands-behind-the-head restraint posture but continued to decrease for subjects in the hands-behind-the-back restraint posture. We discuss the possible role this increased work of breathing may play in restraint asphyxia.


Conflict of interest statement

The authors declare no competing interests.

Figures

Figure 1
Figure 1
Overview of experimental protocol. (A) Two planes of EIT electrodes (2 × 16) were placed on the subject and connected to the SenTec EIT Pioneer Set in a square pattern. (B) EIT measurements were recorded for 5 experimental phases: standing upright (U), unweighted prone (R), weighted prone (W), weighted prone in the restraint posture after exercise (X), and unweighted prone in the restraint posture (P). (C) Conductivity values reconstructed from voltage data were obtained and used for calculation of parameters. Breath detection was applied on the global sum of ΔZ values of each frame in each phase. (D) The global pixel waveform is shown for a sample of each phase (weighted phases were divided into 1-min periods). (E) In each phase, breaths were detected (shown as thin lines) from the global ΔZ and the average breath (bold line) was calculated. (F) VT images (see text for details) were reconstructed for 3 planes (show in (A)) using the selected breaths shown in (E). (G) Schematic of experimental phases. The strenuous bicycle exercise task (10 min) is illustrated between phases W and X. (A,B,C,G) were drawn using Inkscape v1.0 (https://inkscape.org). (DF) were generated in MATLAB2019a using the EIDORS software package.
Figure 2
Figure 2
Detailed results for a single subject in the control posture. Experimental phases are labelled as in Fig. 1. Each column in phases W and X were 1-min periods, while phase U, R, and P were a 2-min periods. (Top) plots of ΔFRC the top (red), middle (orange), and bottom (blue) reconstruction planes, VT (purple), and fR (green) for each phase. Error bars were omitted for clarity. Inter-subject variability is shown in Figs. 3 and 4. (Middle) accepted breaths for each phase are plotted in gray along with the average breath in magenta (ΔZ = impedance change from reference frame). All breaths across phases were plotted on the same scale. (Bottom) the internal conductivity distributions for the top (T), middle (M), and bottom (B) reconstruction planes for each phase, with the subject shown face-down. Conductivity (ΔZ-1) values were scaled across phases, with lower conductivity values corresponding to larger volumes of air in the lungs. The center of ventilation for each reconstruction plane is shown with a white crosshair. The colour bar indicates relative conductivity from low (blue-white) to high (red-white).
Figure 3
Figure 3
Minute ventilation (V˙E), expressed as a ratio of the mean V˙E in phase R, shown on a ln scale. Each datapoint represents the V˙E for an individual breath. The solid lines are predicted means derived from the statistical analyses assuming the average age and BMI. The shaded regions show the 95% confidence interval on these model predictions. Postures were either a control posture identical to that of phase W, with arms at the side (N = 5), hands clasping each other on the small of the back (N = 6), or both hands on the back of the head (N = 6). Note that in phase P, the number of subjects was reduced to only N = 1 (control), N = 3 (hands-back) and N = 3 (hands-head).
Figure 4
Figure 4
The ΔFRC for each breath in each phase, shown as a relative volume by expressing as a ratio of the mean phase R VT, for the middle imaging plane. The solid lines are predicted means derived from the statistical analyses assuming the average age and BMI. The shaded regions show the 95% confidence interval on these model predictions. Postures were either a control posture identical to that of phase W, with arms at the side (N = 5), hands clasping each other on the small of the back (N = 6), or both hands on the back of the head (N = 6). Note that in phase P, the number of subjects was reduced to only N = 1 (control), N = 3 (hands-back) and N = 3 (hands-head).

References

    1. Burch, A. Arrest-related deaths, 2003-2009—statistical tables. Tech. Rep. NCJ 235385, Bureau of Justice Statistics (2011).
    1. Reay D, Howard J, Flinger C, Ward R. Effects of positional restraint on saturation and heart rate following exercise. Am. J. Forensic Med. Pathol. 1988;9:16–18. doi: 10.1097/00000433-198803000-00005. - DOI - PubMed
    1. Chan T, Vilke G, Neuman T, Clausen J. Restraint position and positional asphyxia. Ann. Emerg. Med. 1997;30:578–586. doi: 10.1016/S0196-0644(97)70072-6. - DOI - PubMed
    1. Schmidt P, Snowden T. The effects of positional restraint on heart rate and oxygen saturation. J. Emerg. Med. 1999;17:777–782. doi: 10.1016/S0736-4679(99)00083-9. - DOI - PubMed
    1. Michalewicz B, et al. Ventilatory and metabolic demands during aggressive physical restraint in healthy adults. Forensic Sci. 2007;52:171–175. doi: 10.1111/j.1556-4029.2006.00296.x. - DOI - PubMed

Publication types