. 2021 Nov;5(11):1336-1347.
doi: 10.1038/s41551-021-00779-w. Epub 2021 Aug 12.

Control of the activity of CAR-T cells within tumours via focused ultrasound

Affiliations

Control of the activity of CAR-T cells within tumours via focused ultrasound

Yiqian Wu et al. Nat Biomed Eng. 2021 Nov.

Abstract

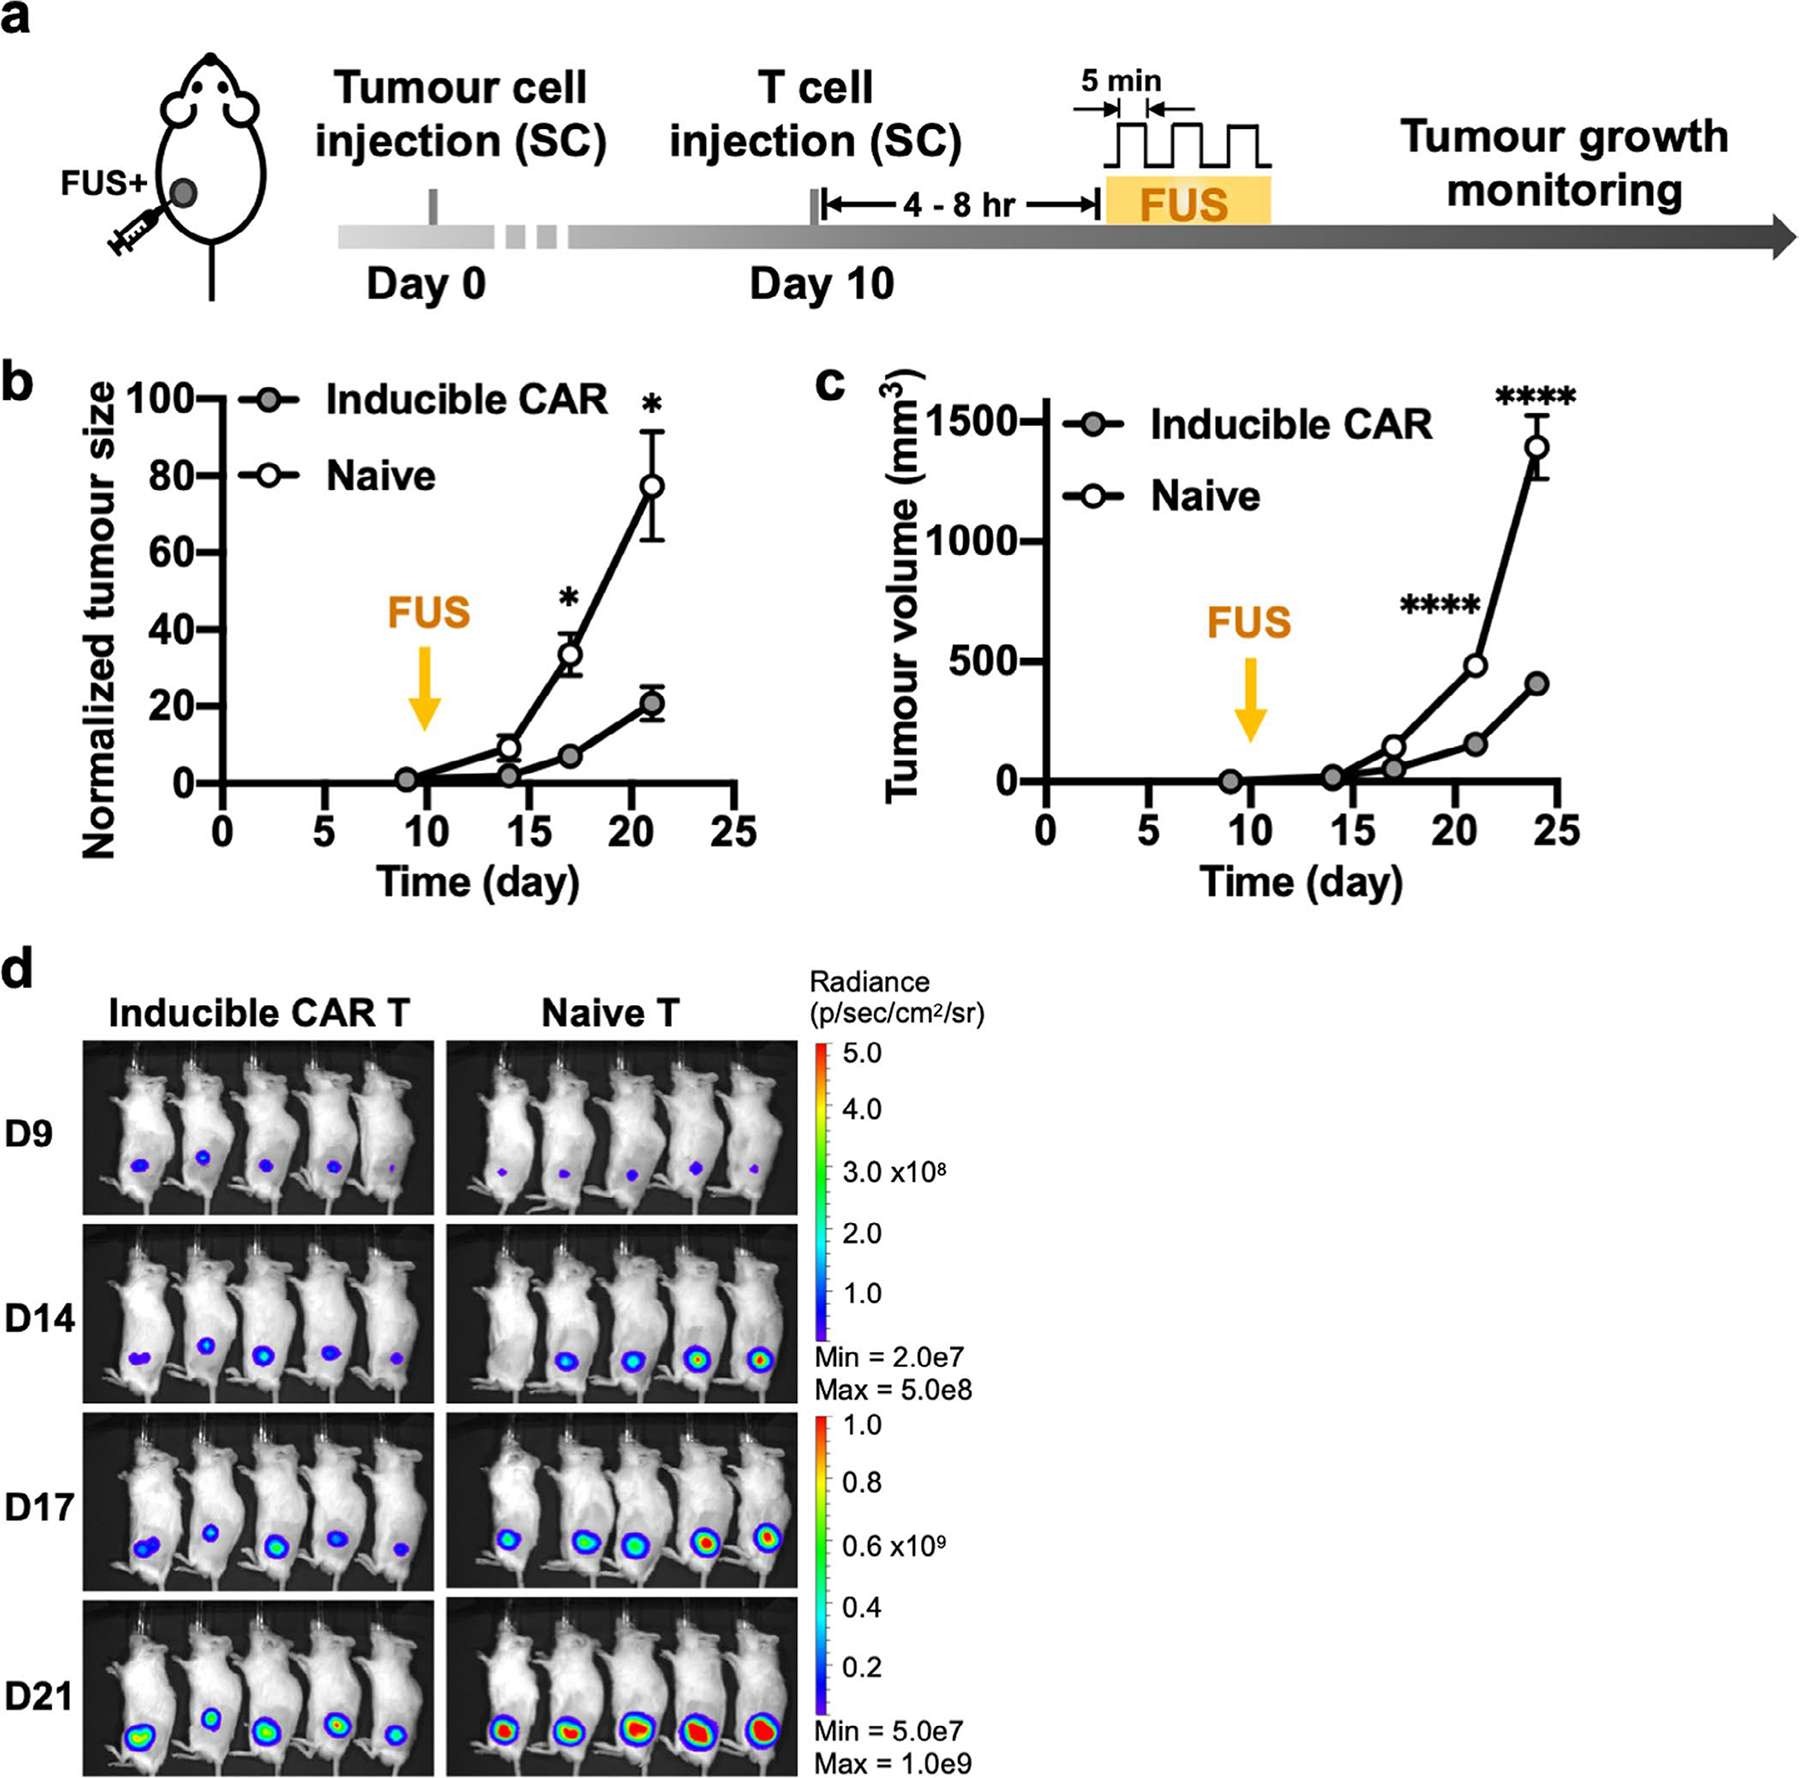
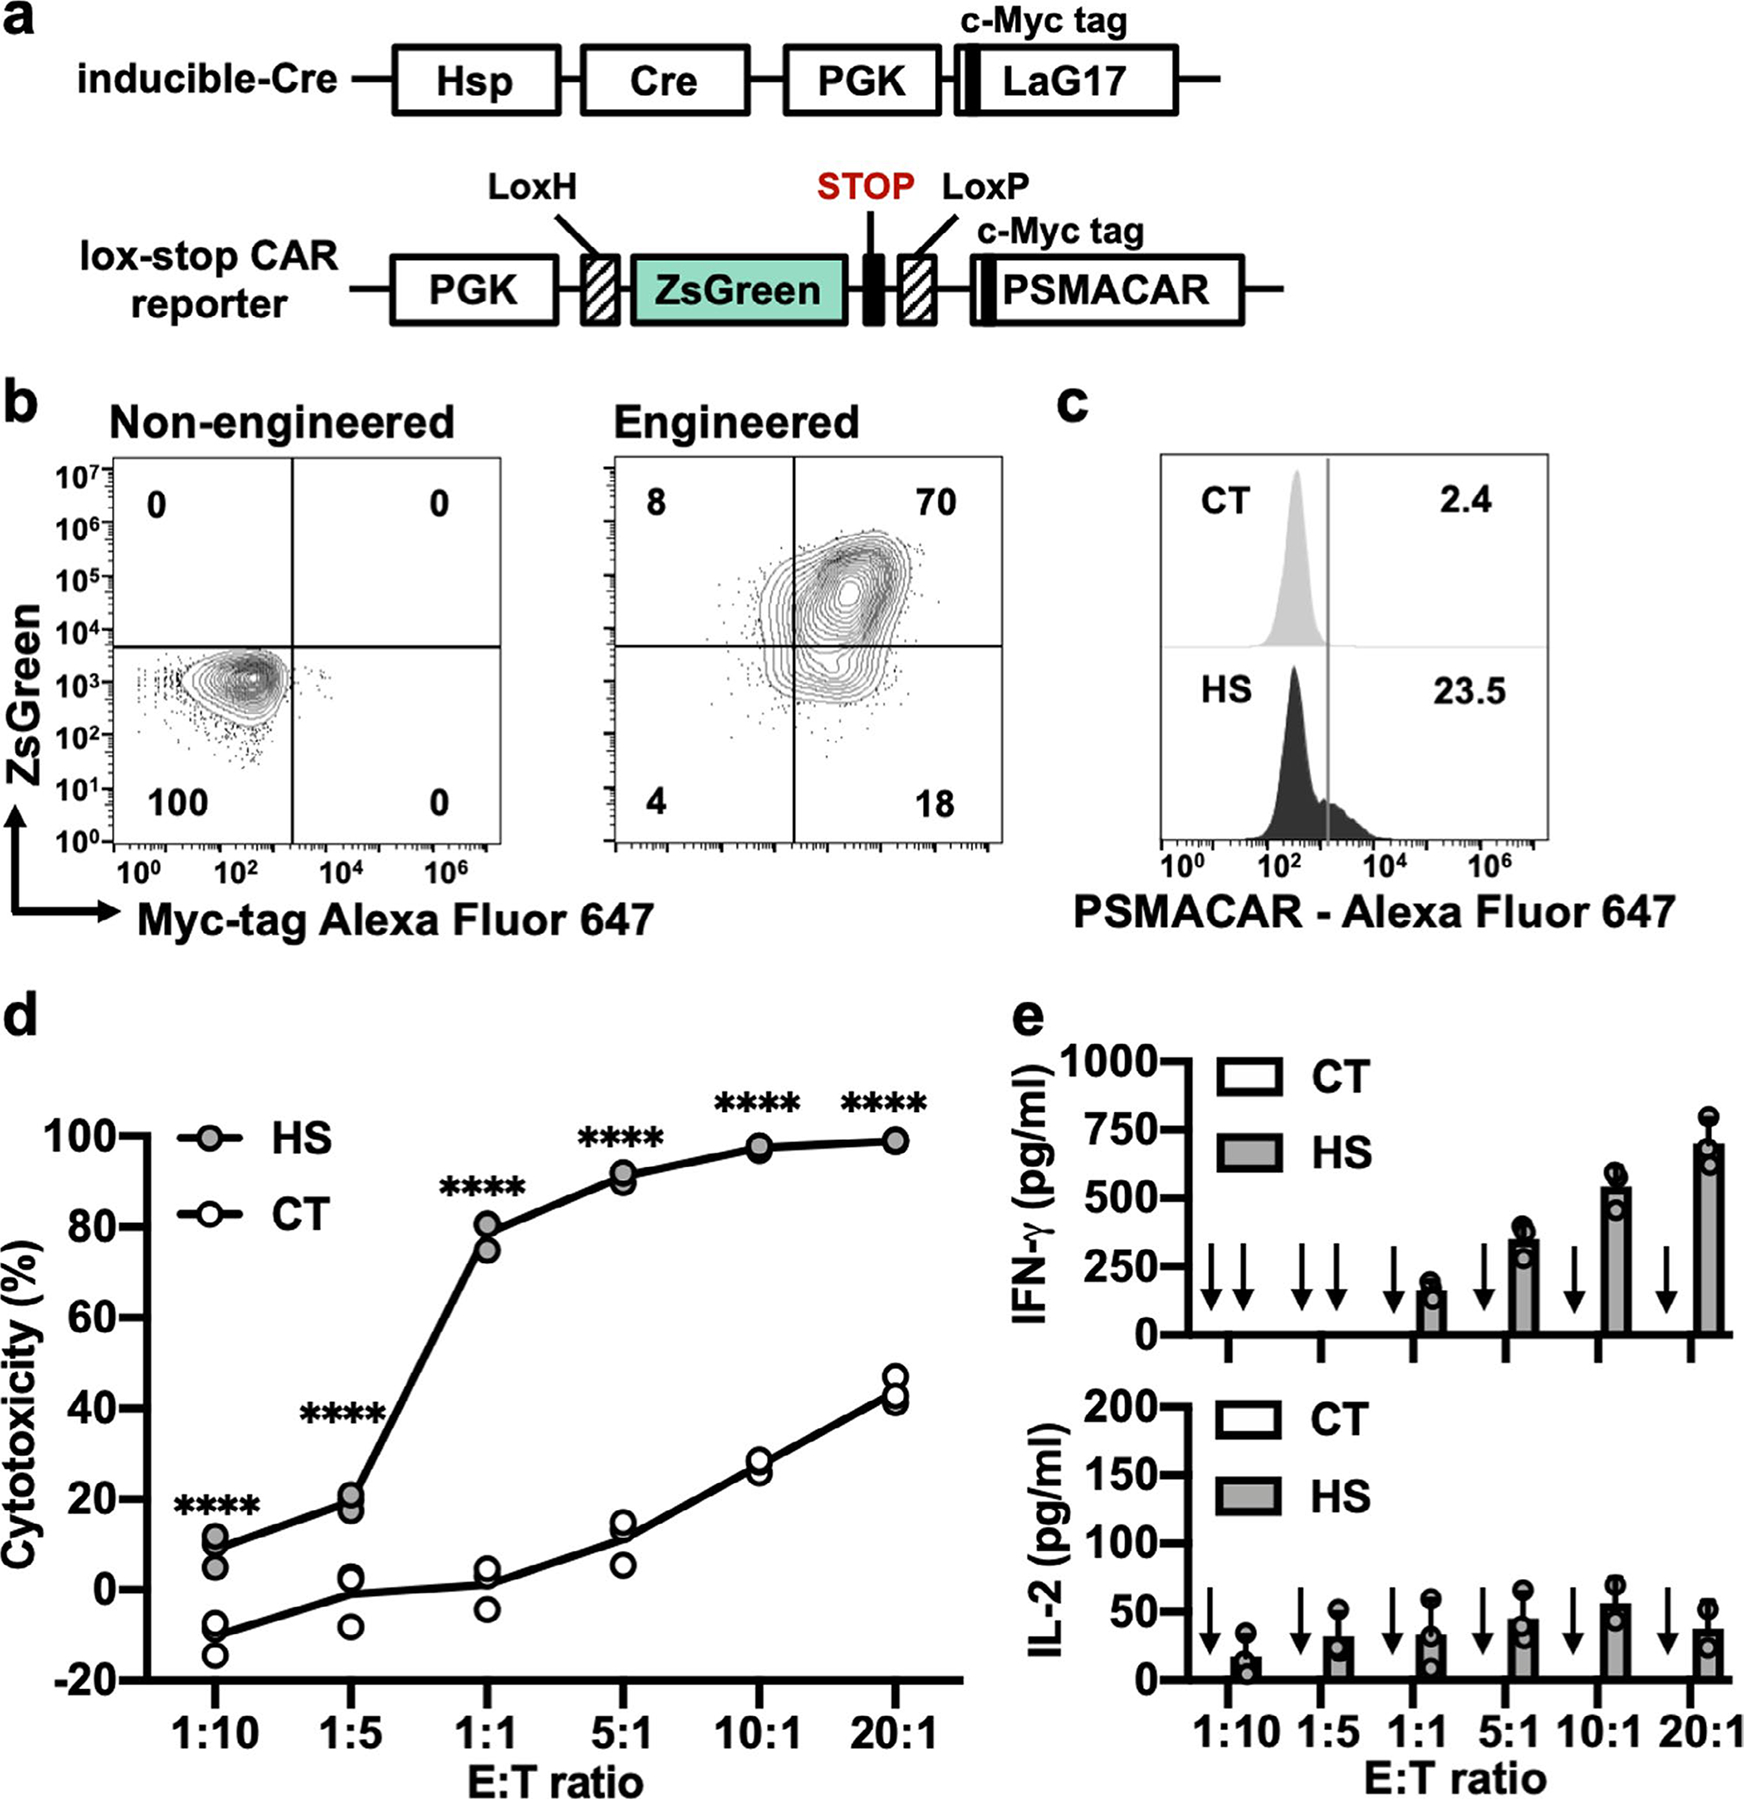
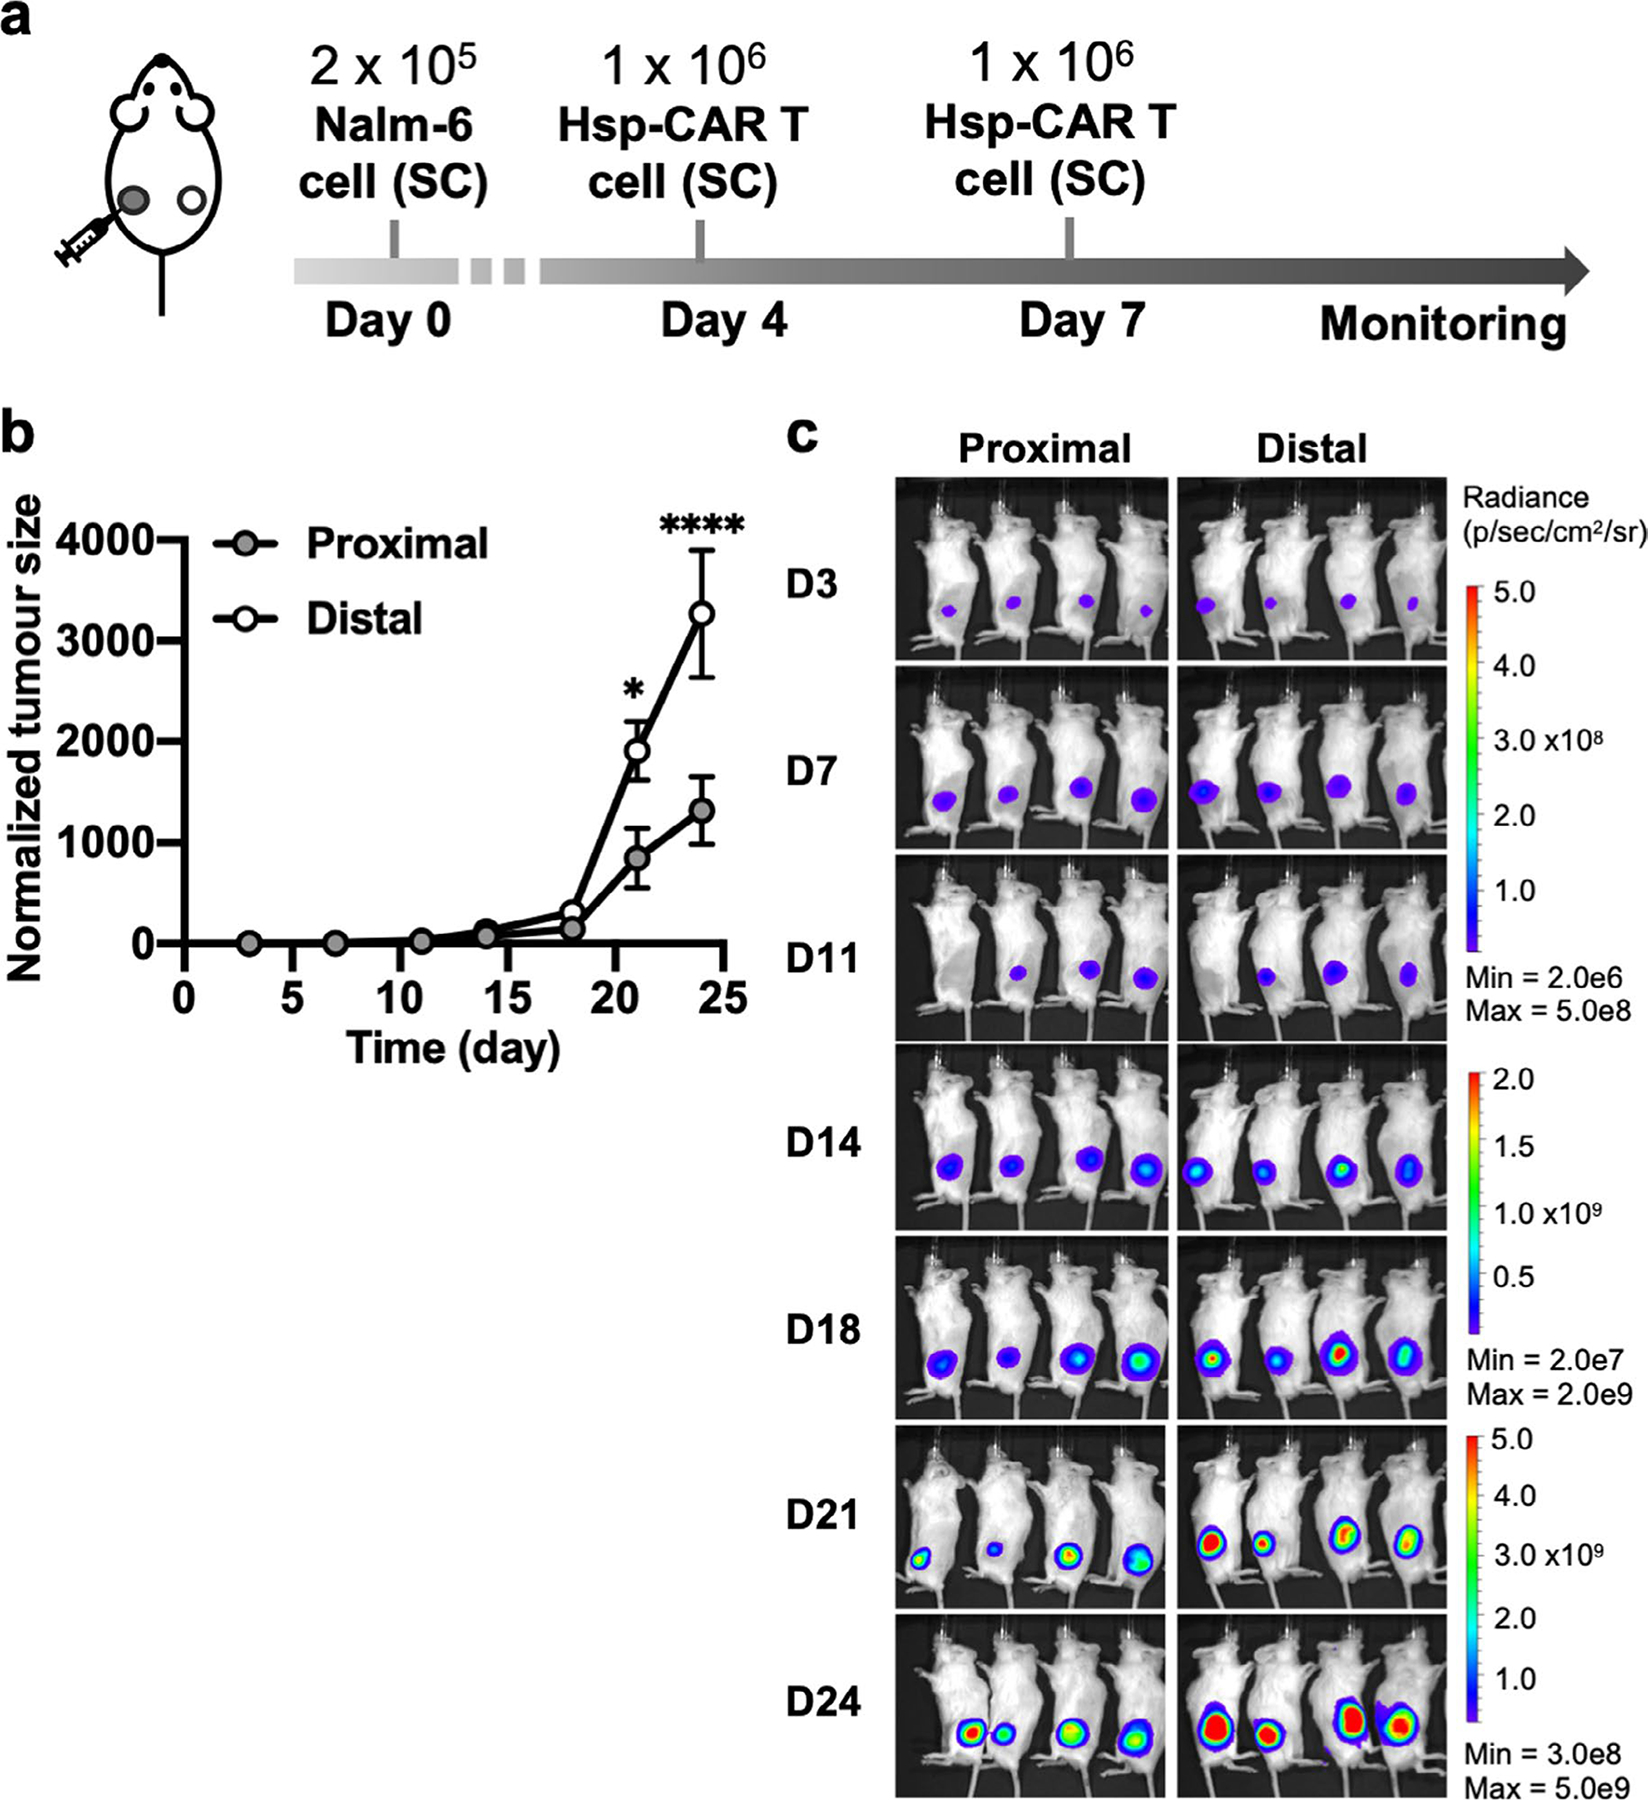
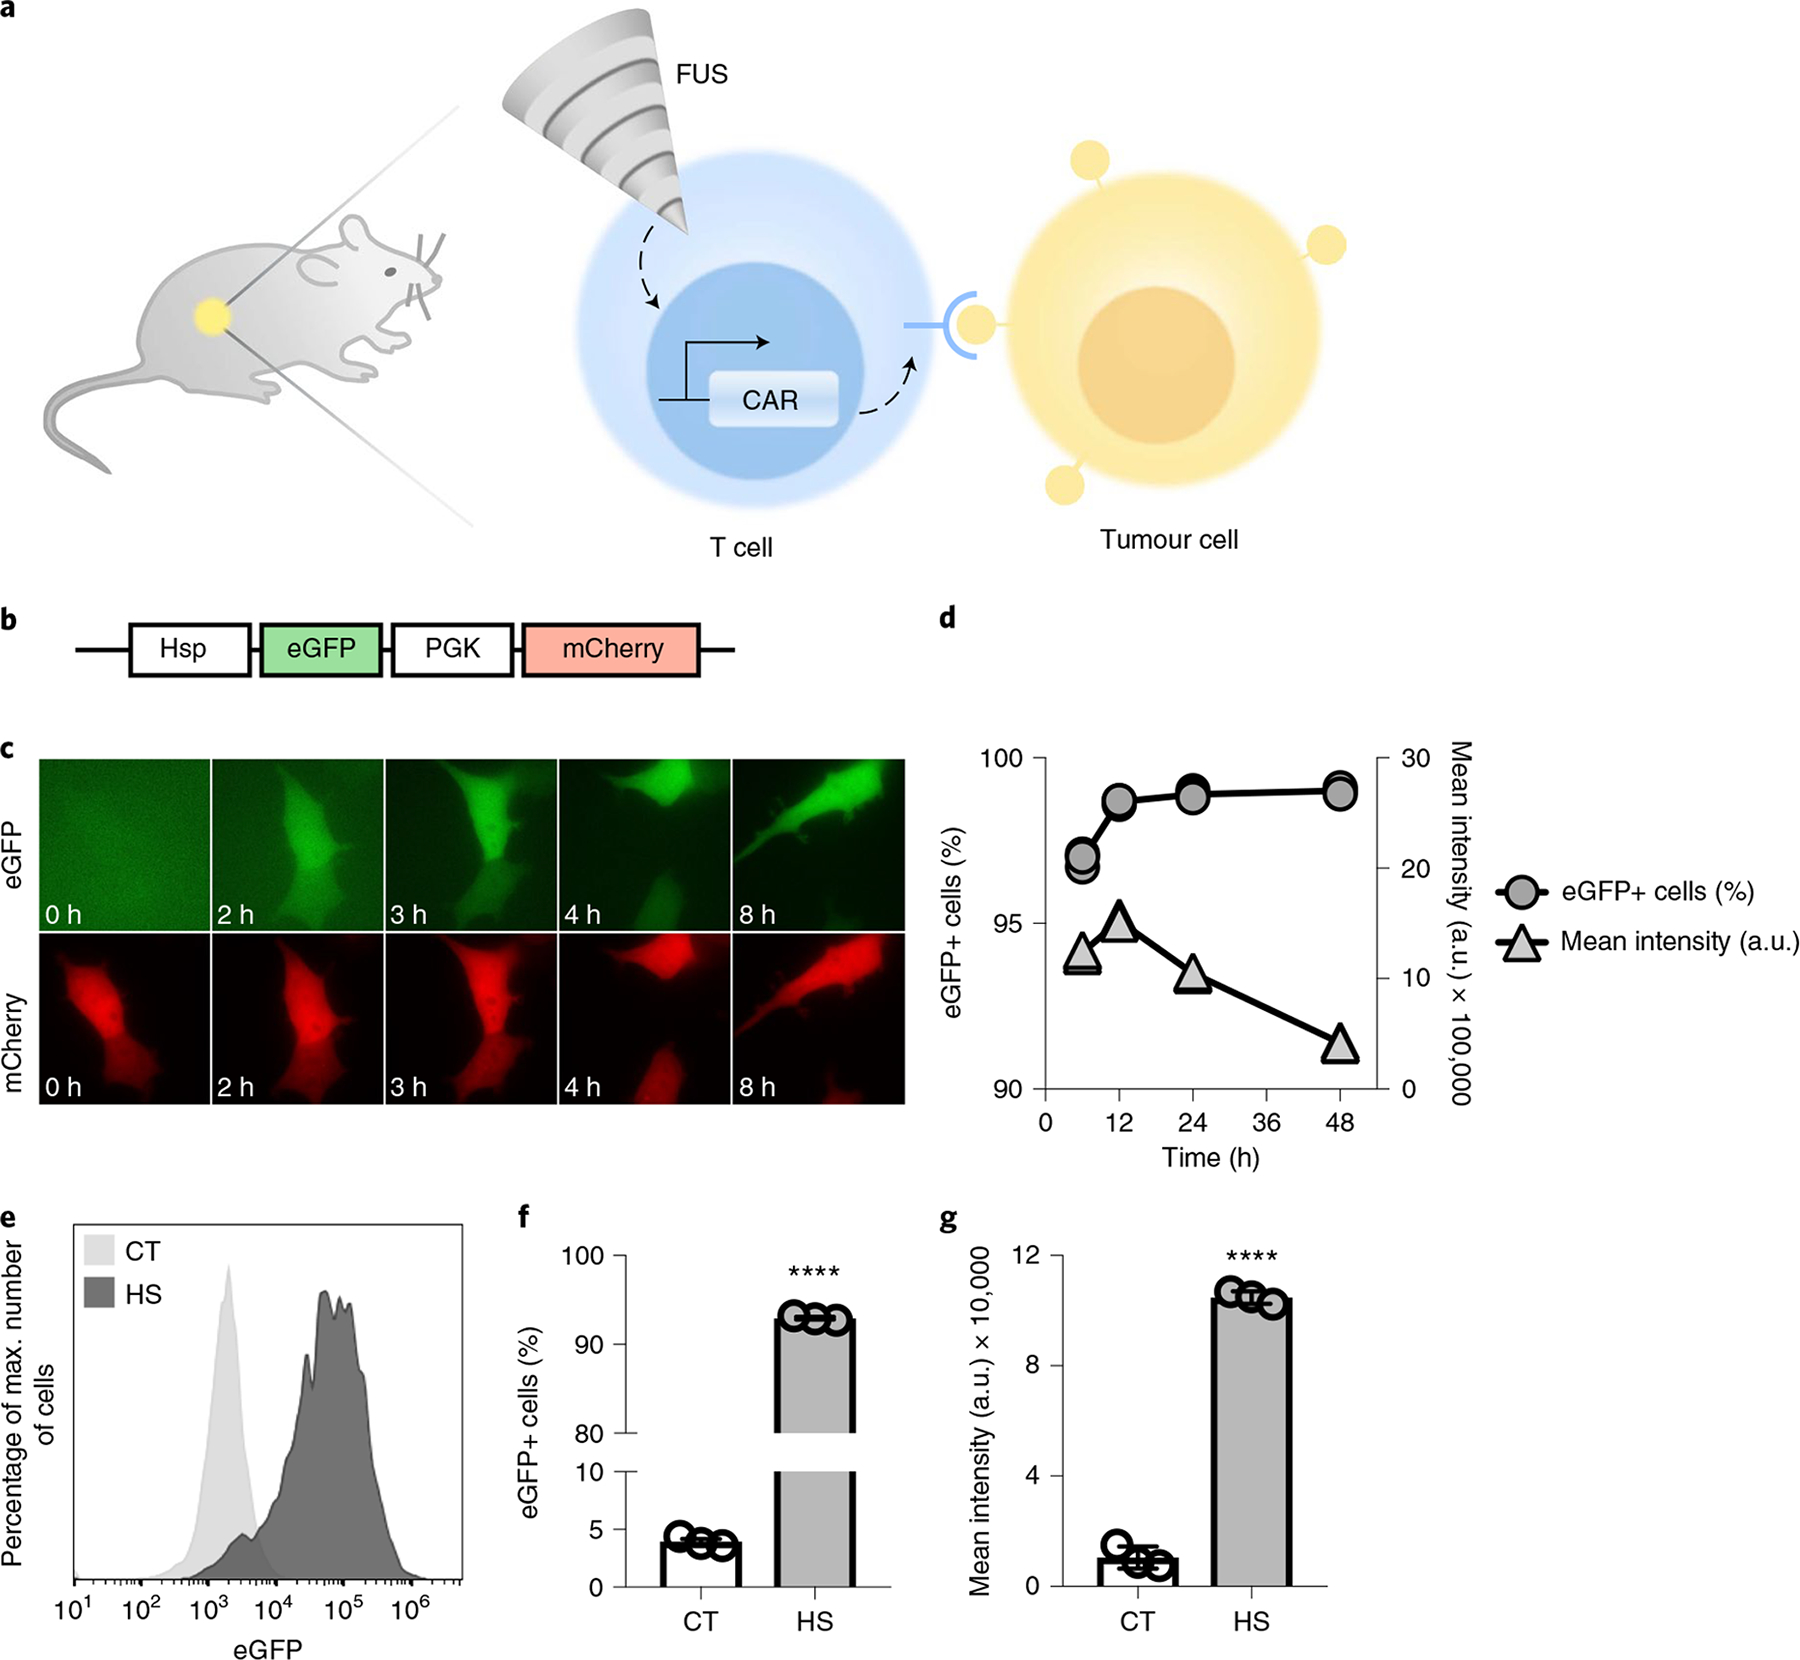
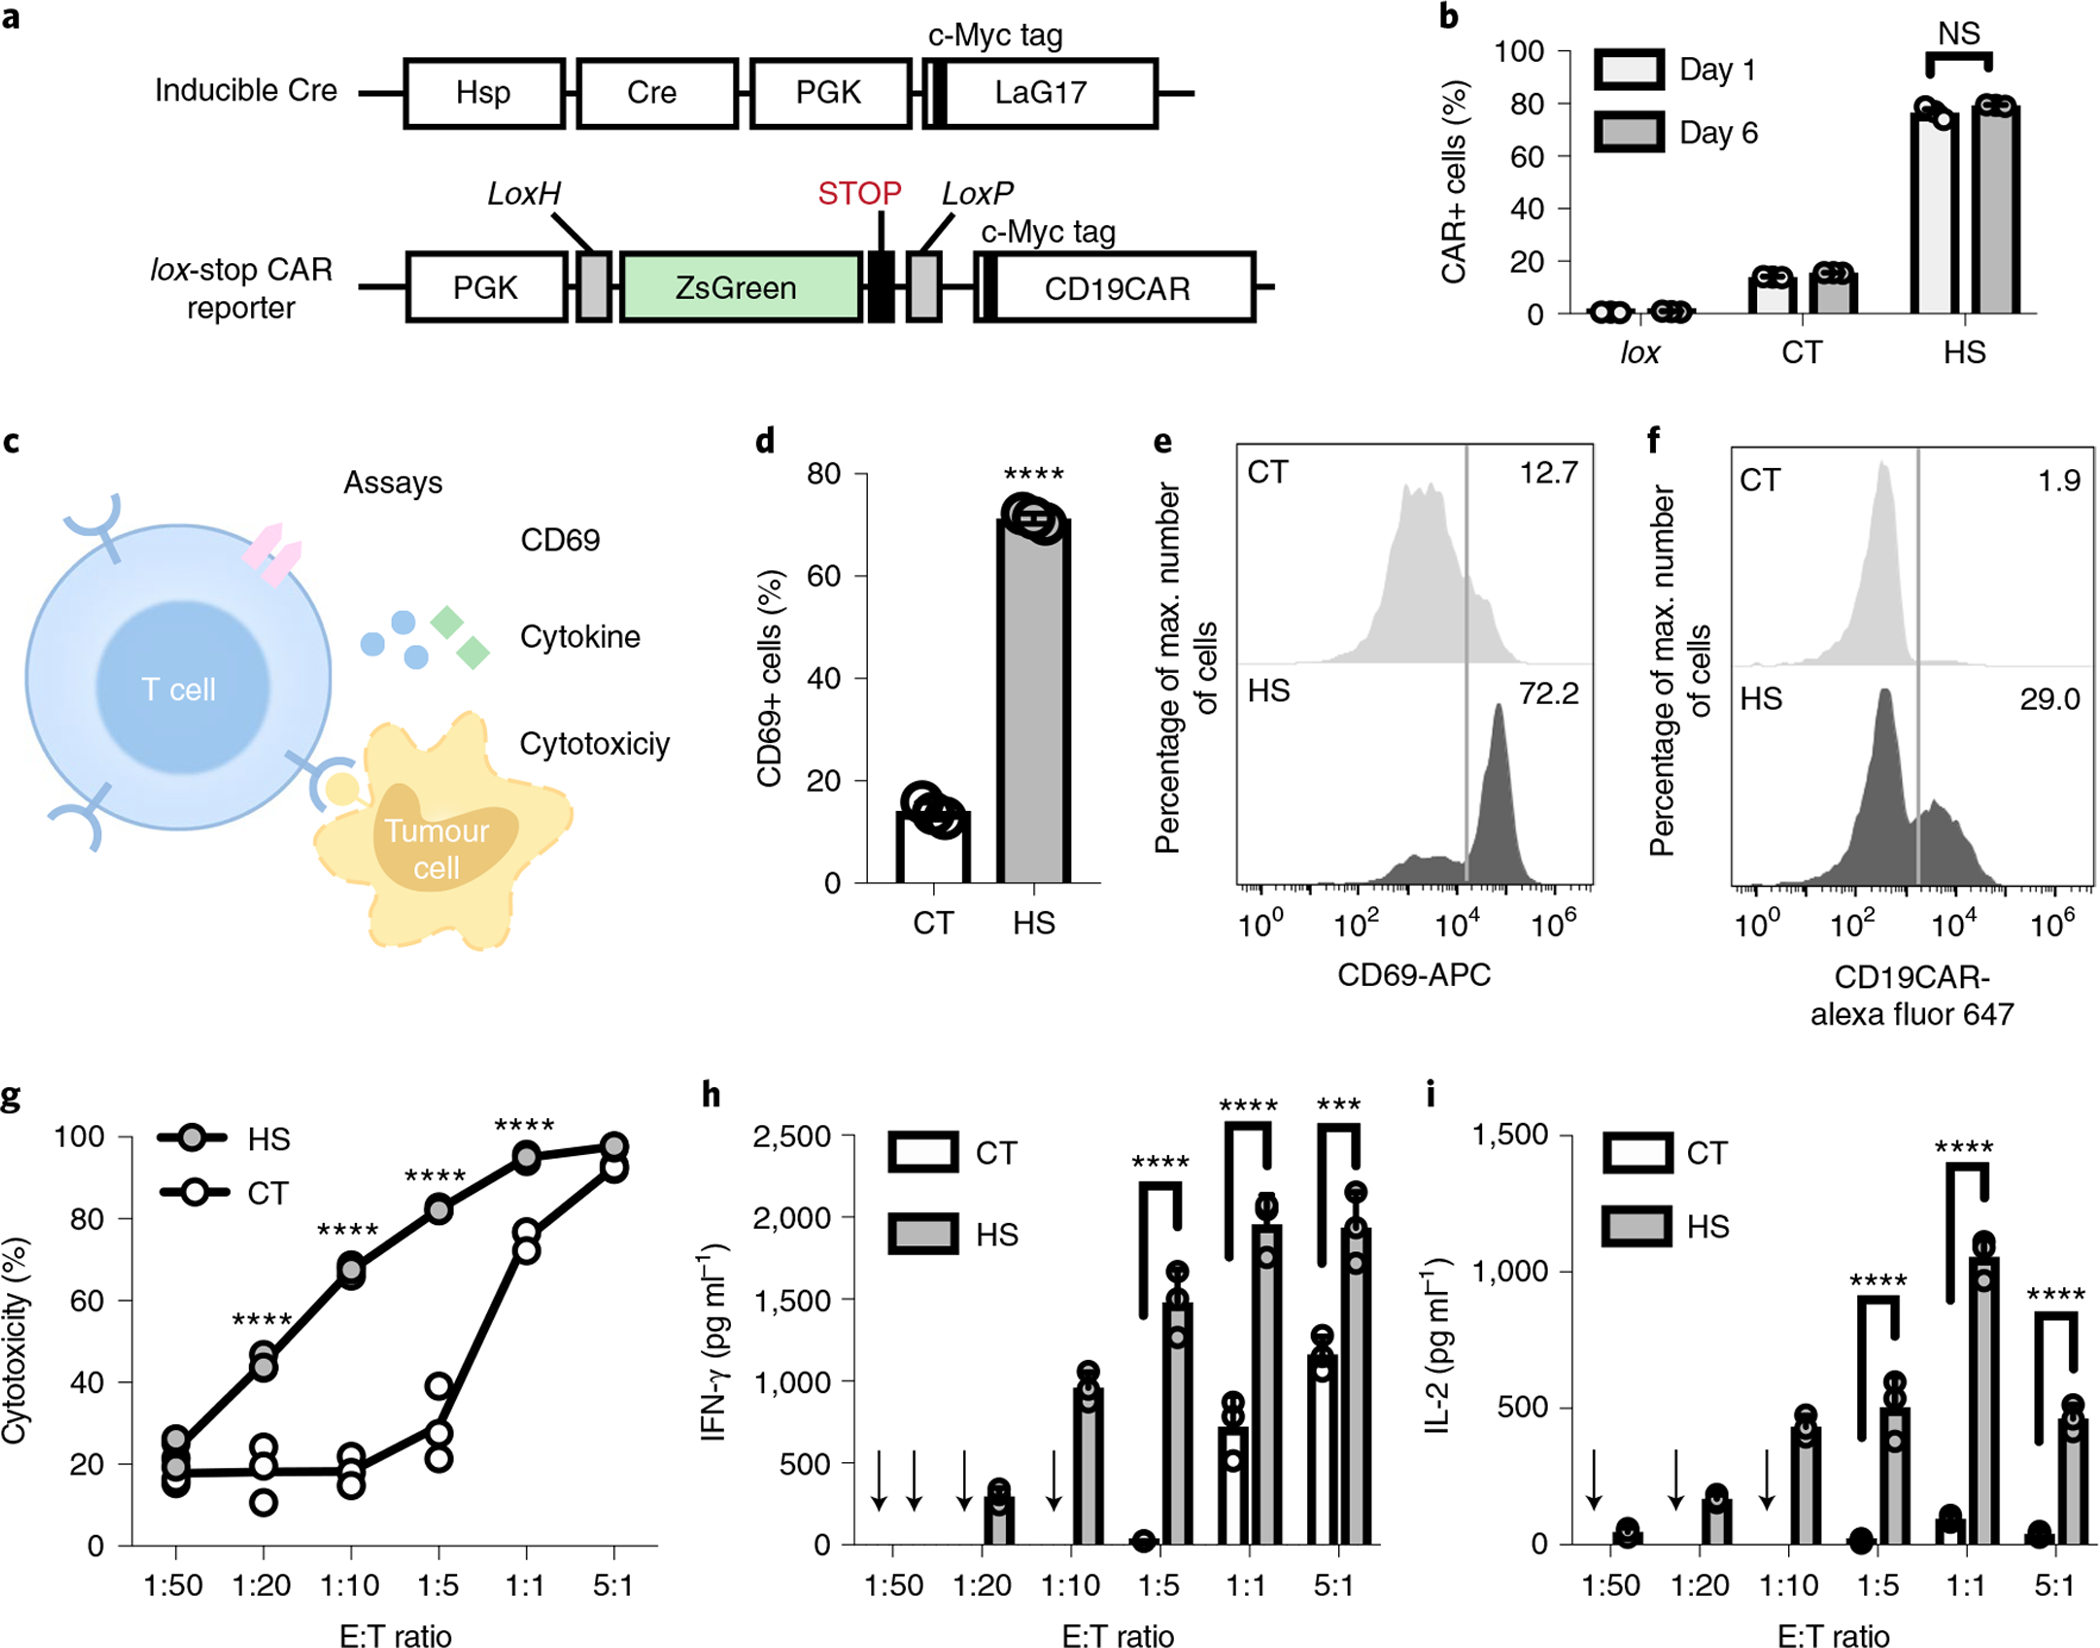
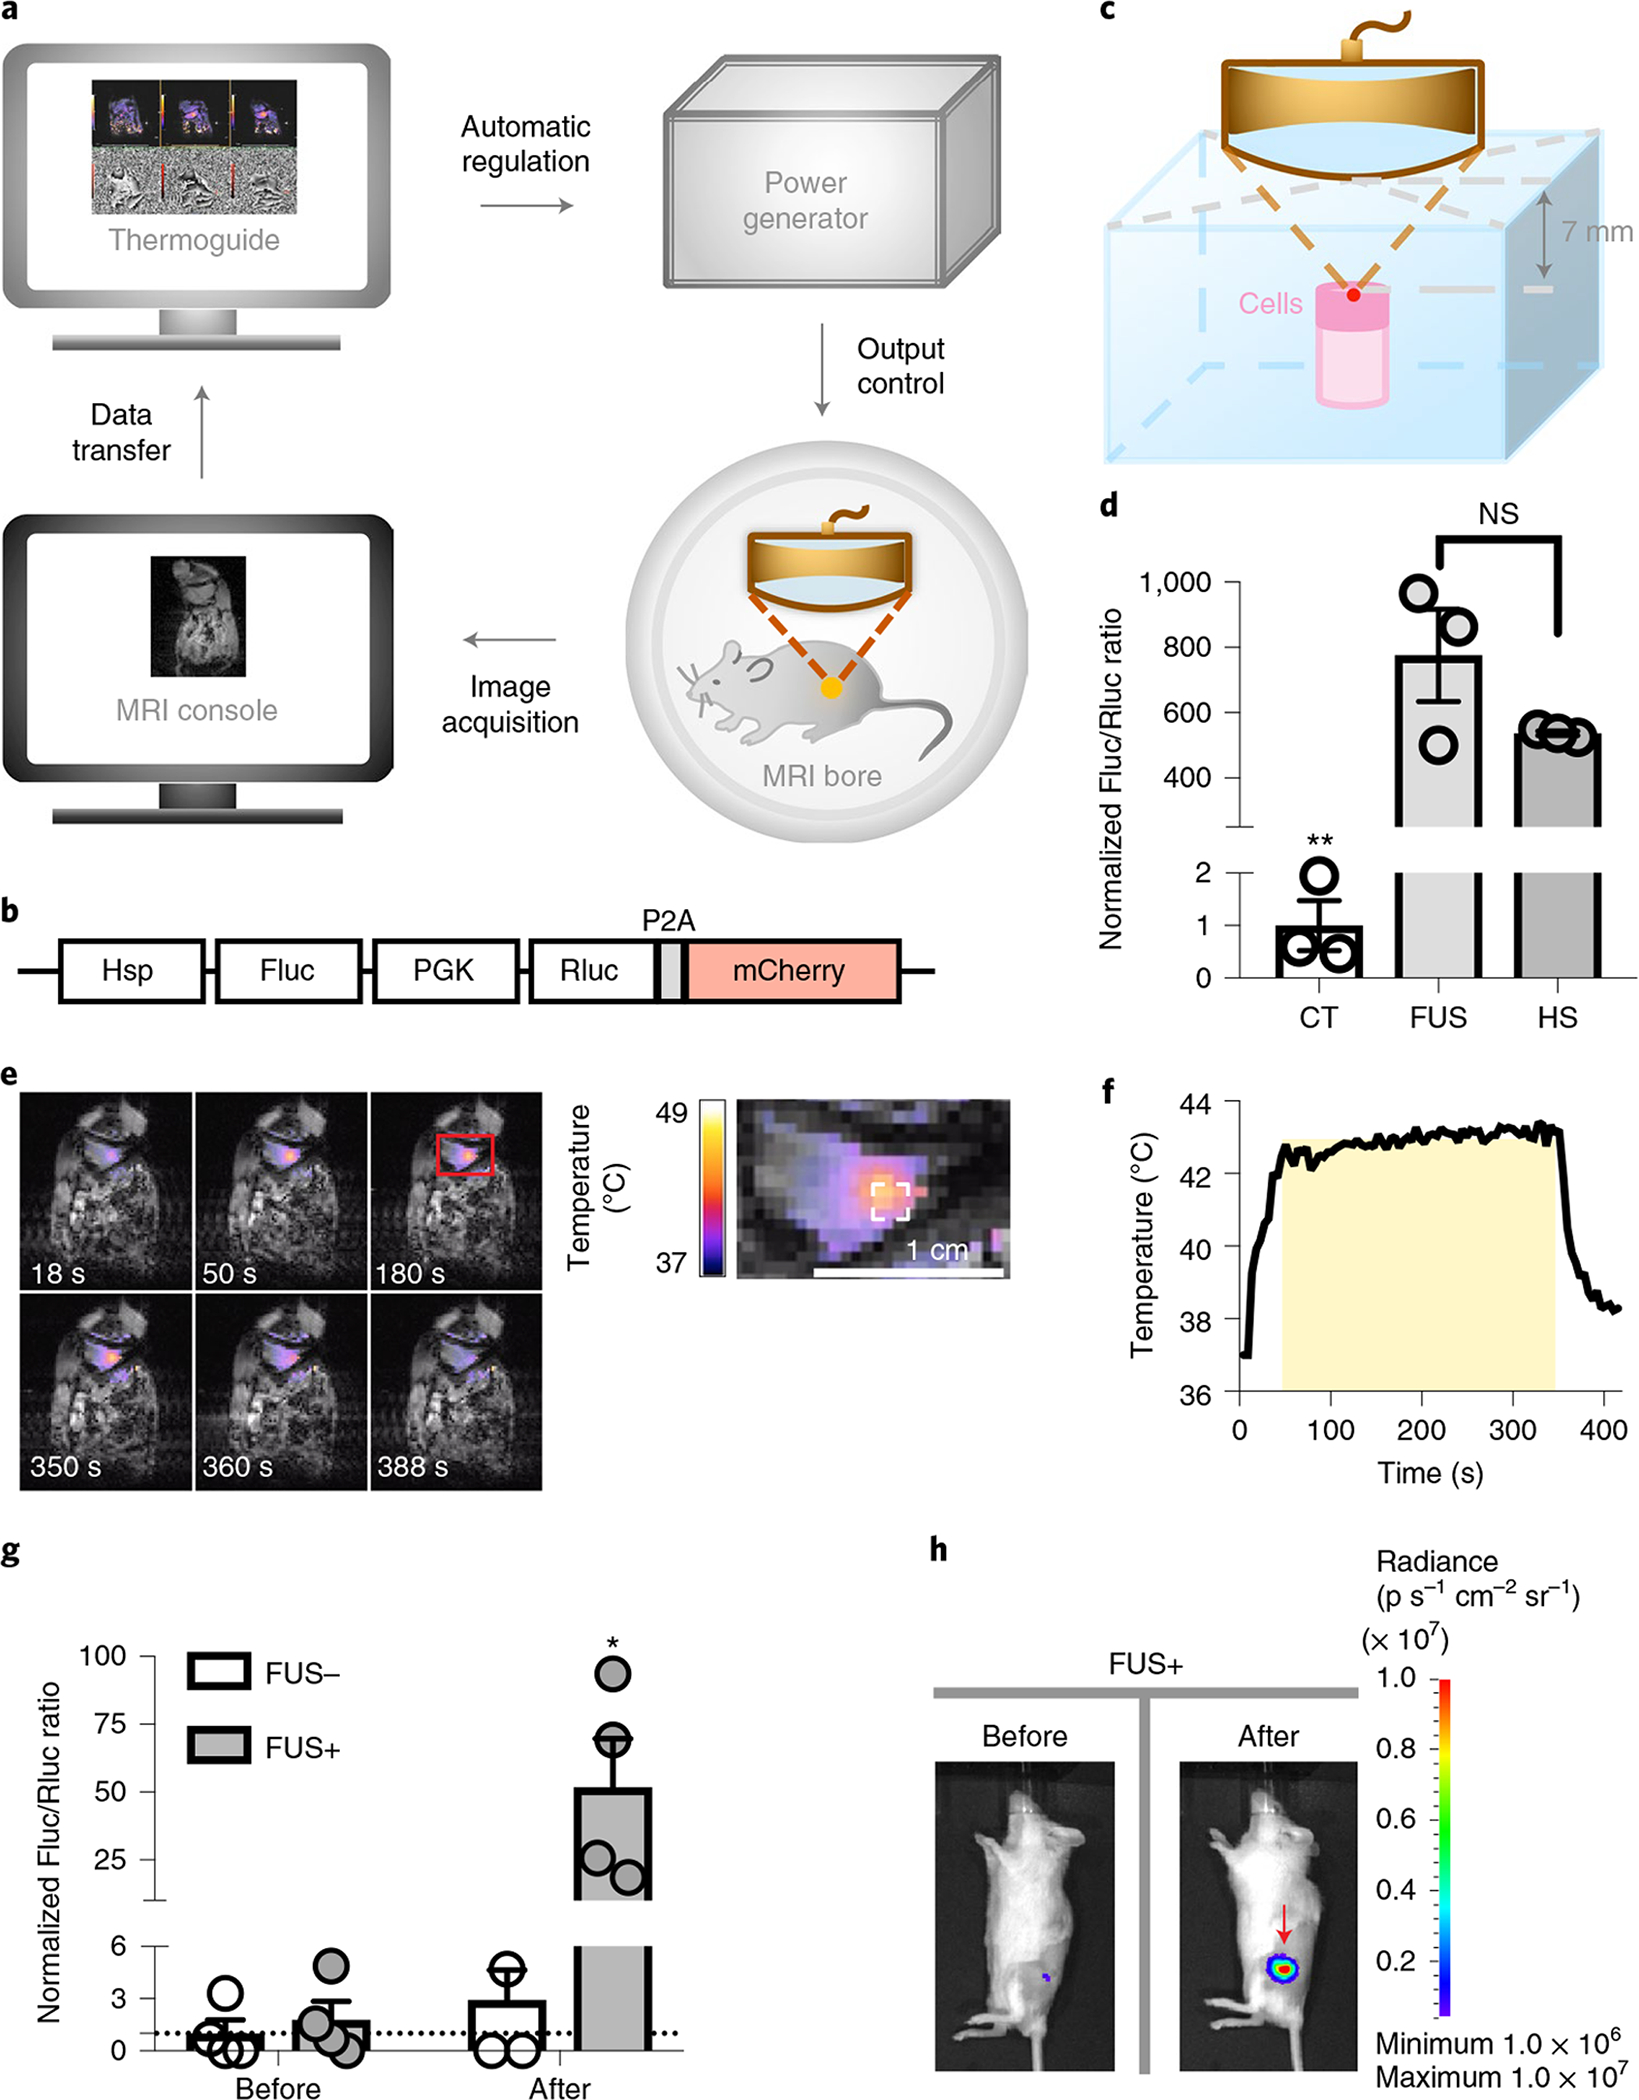
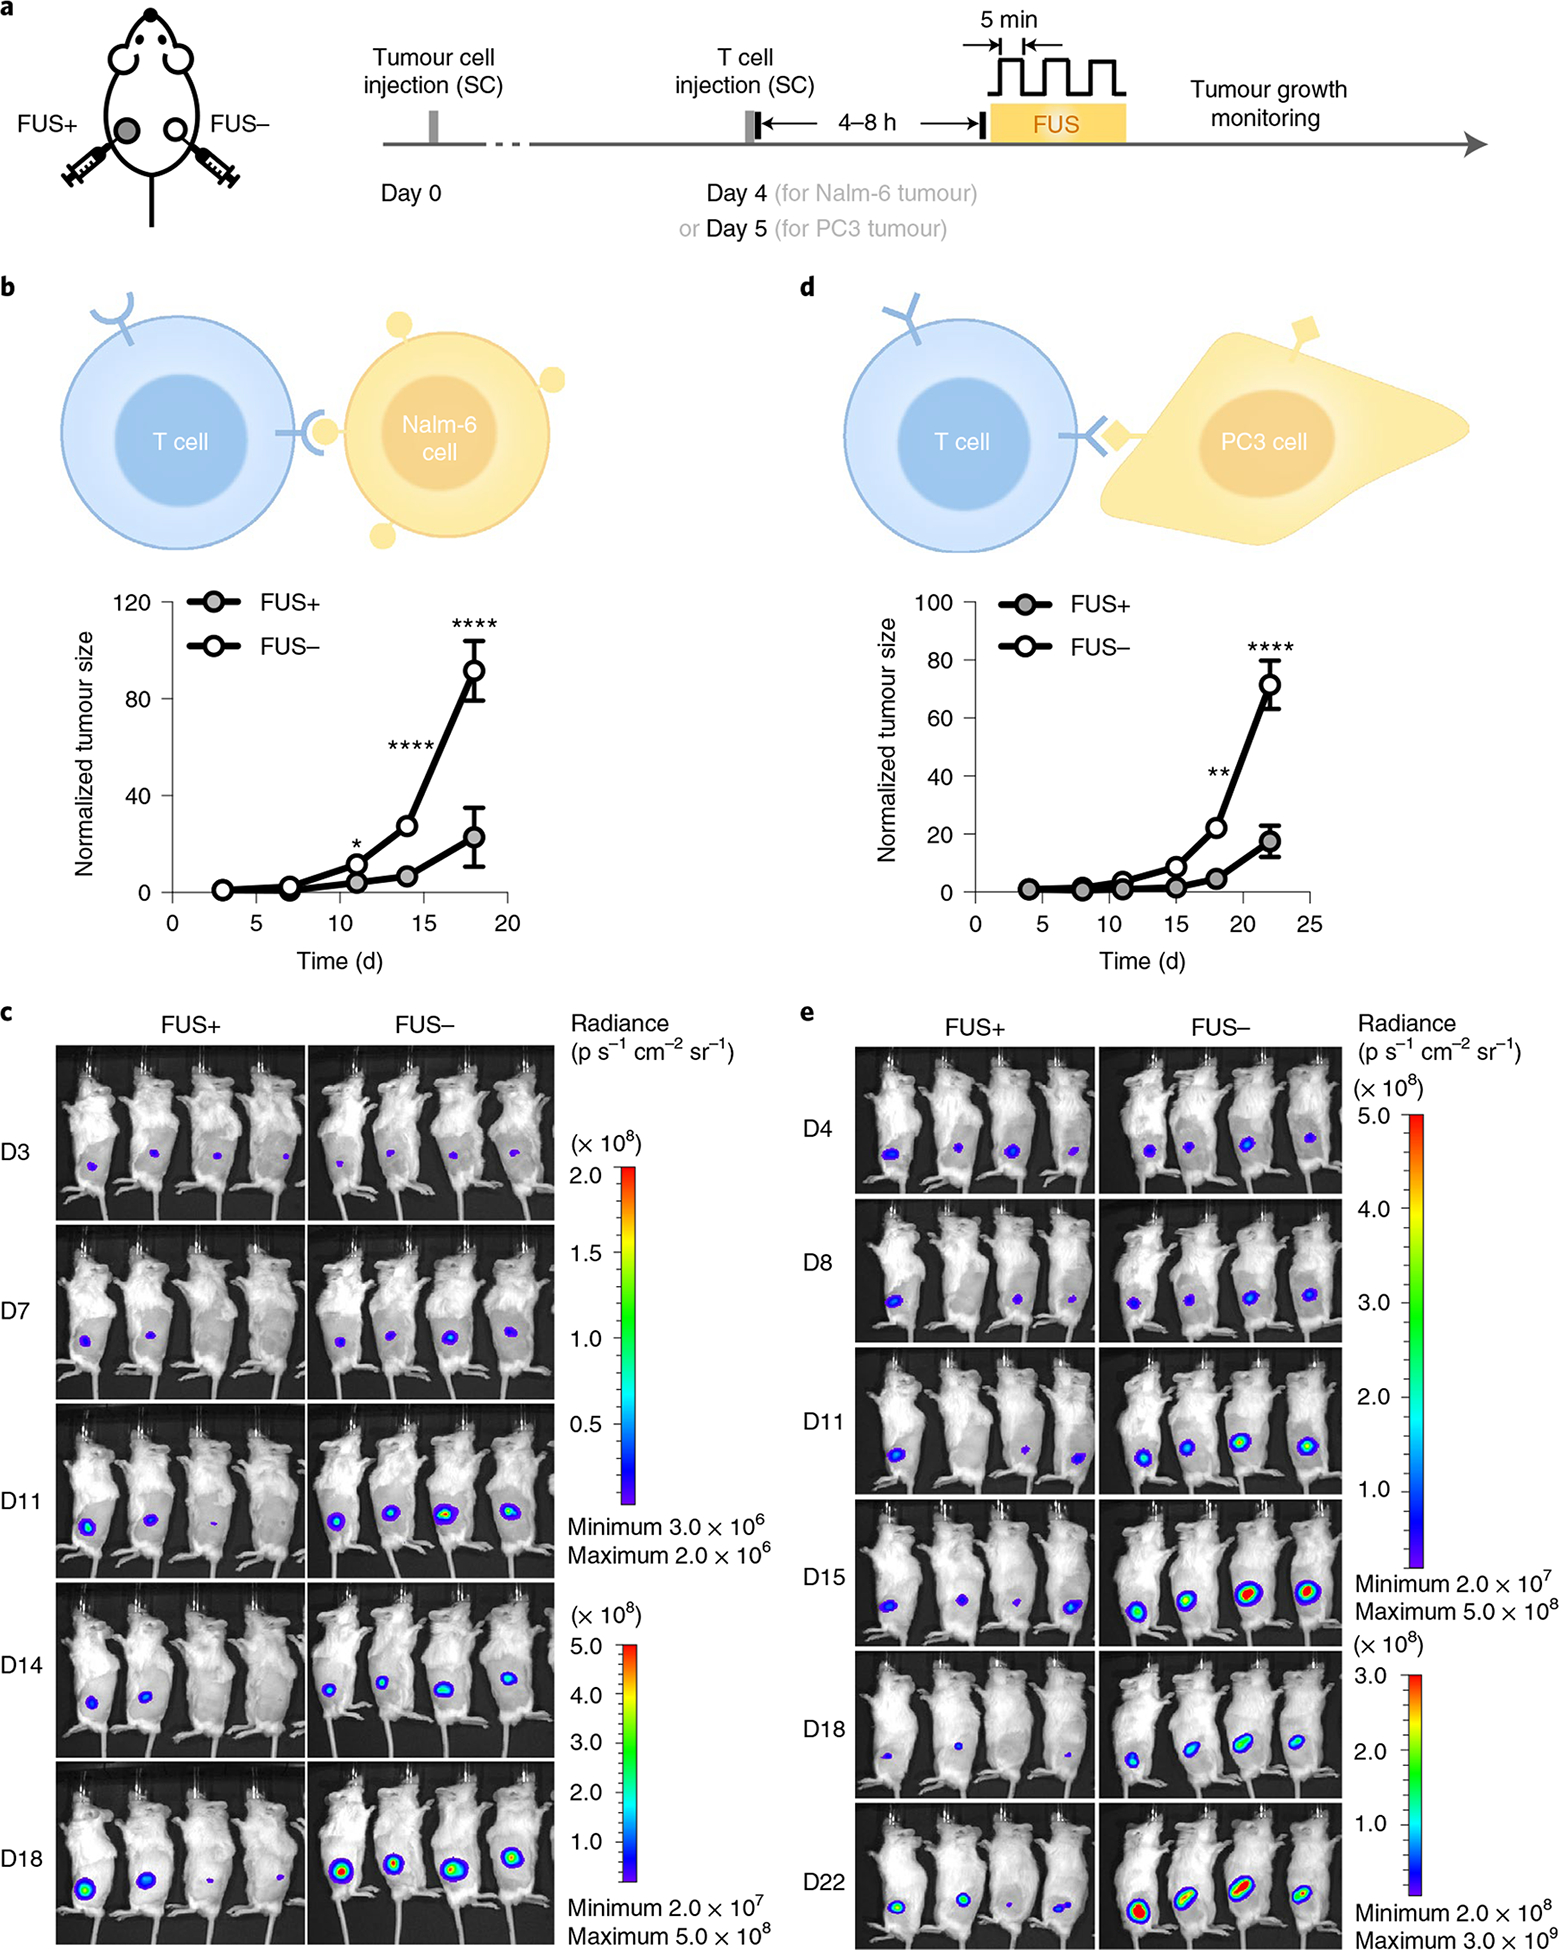
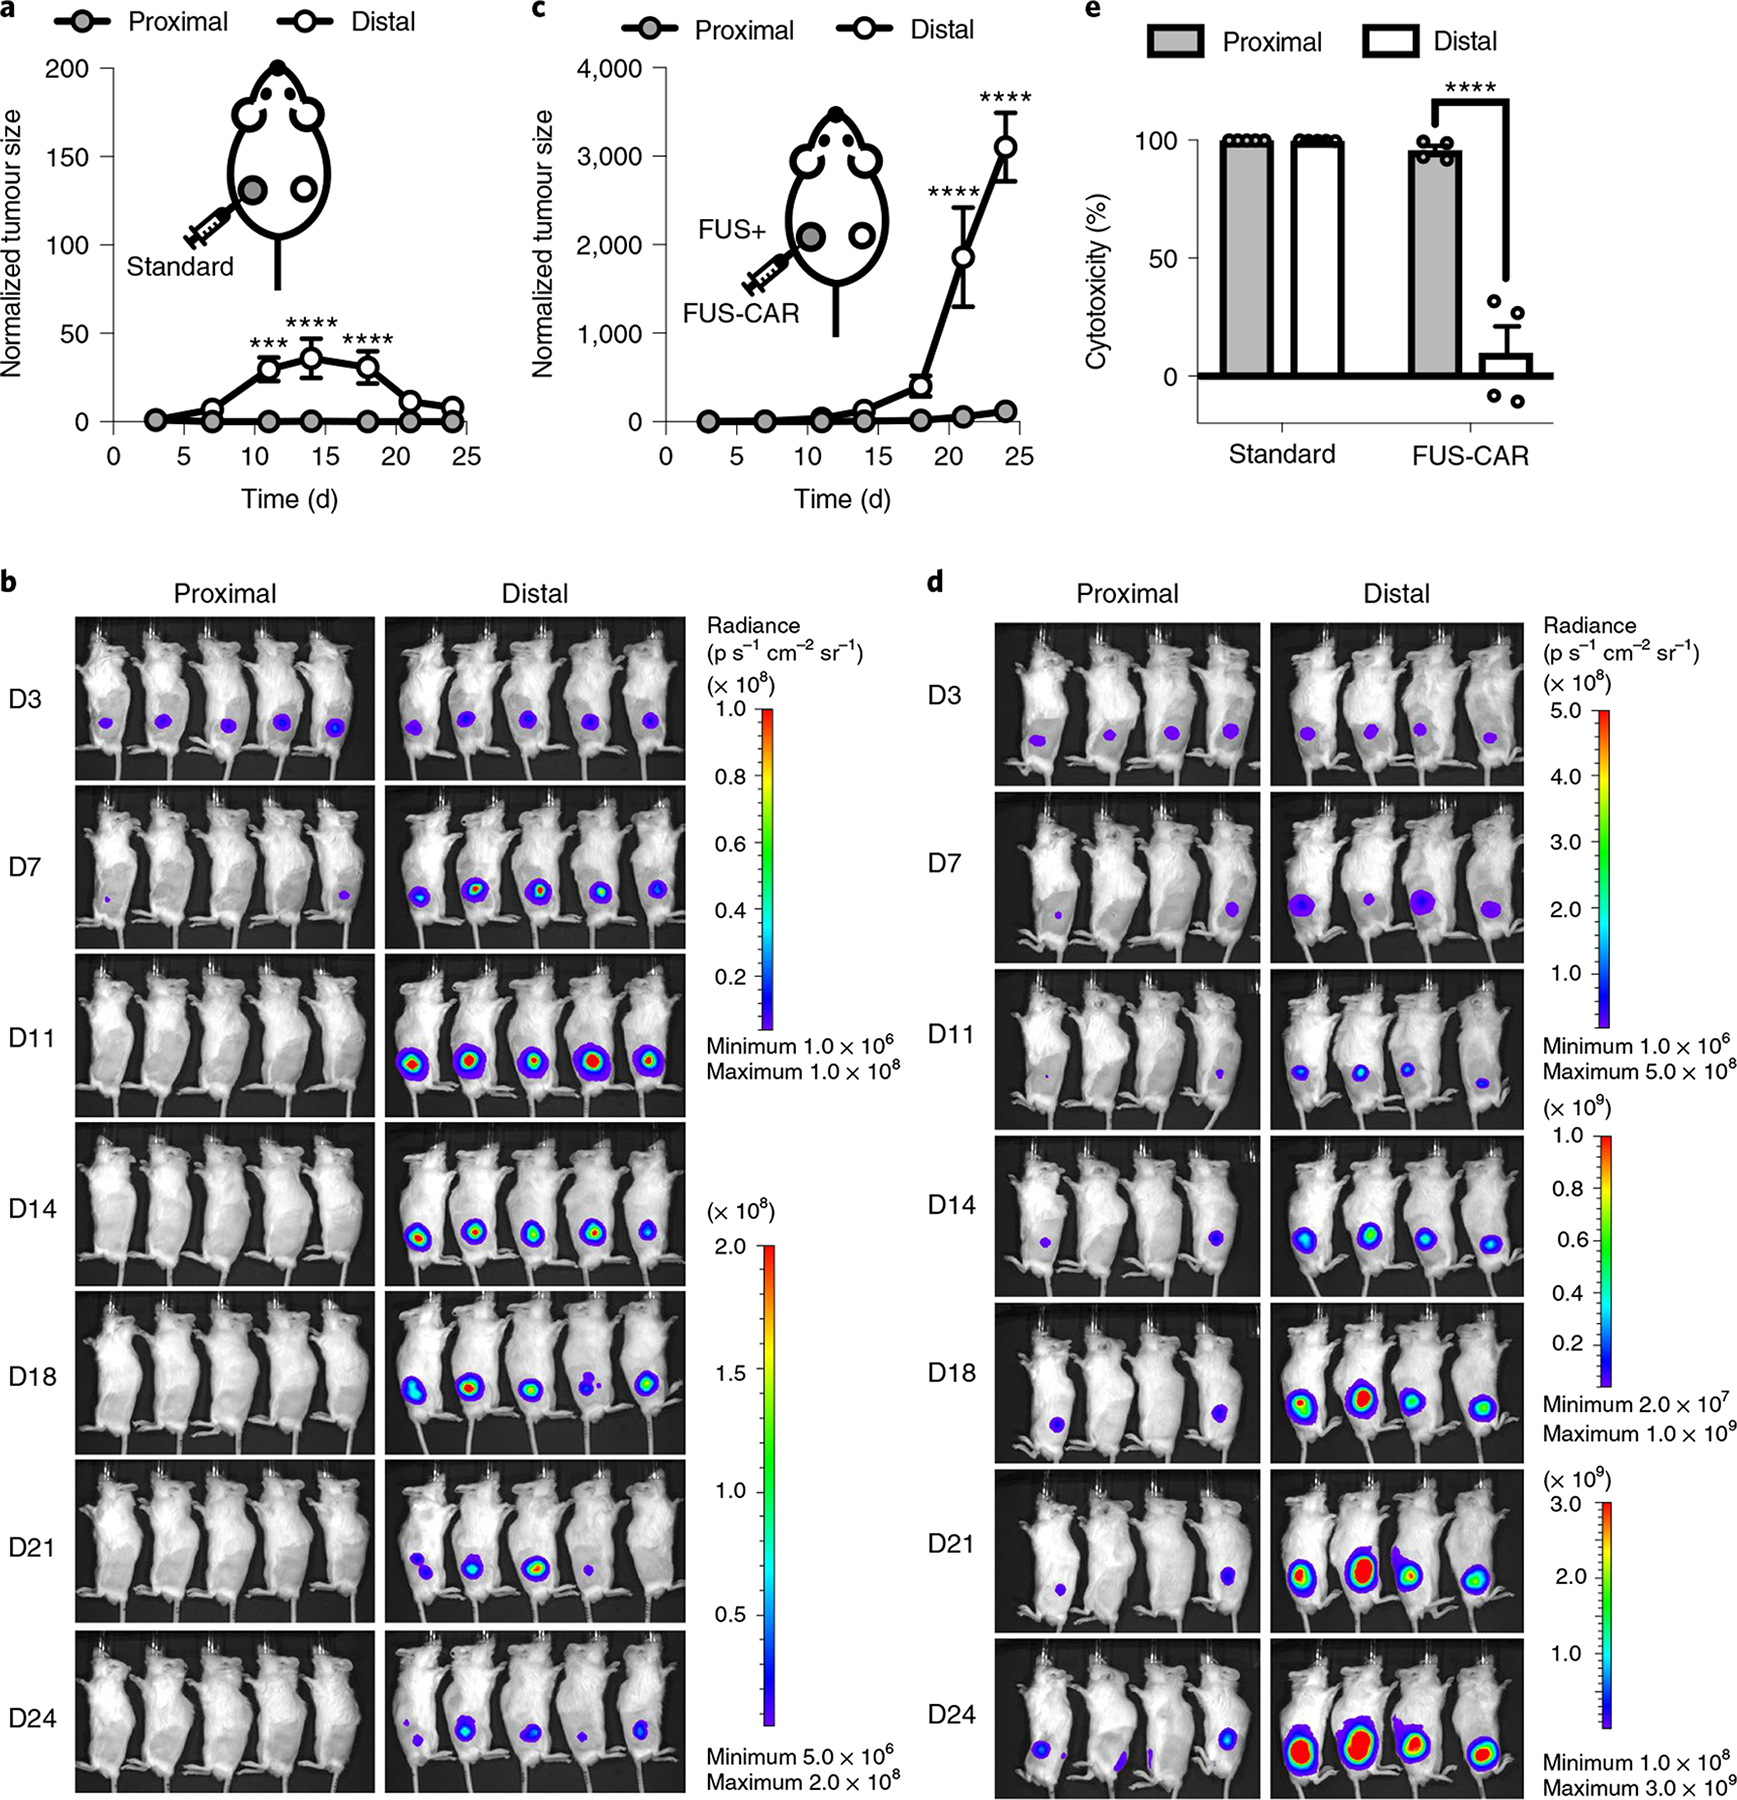
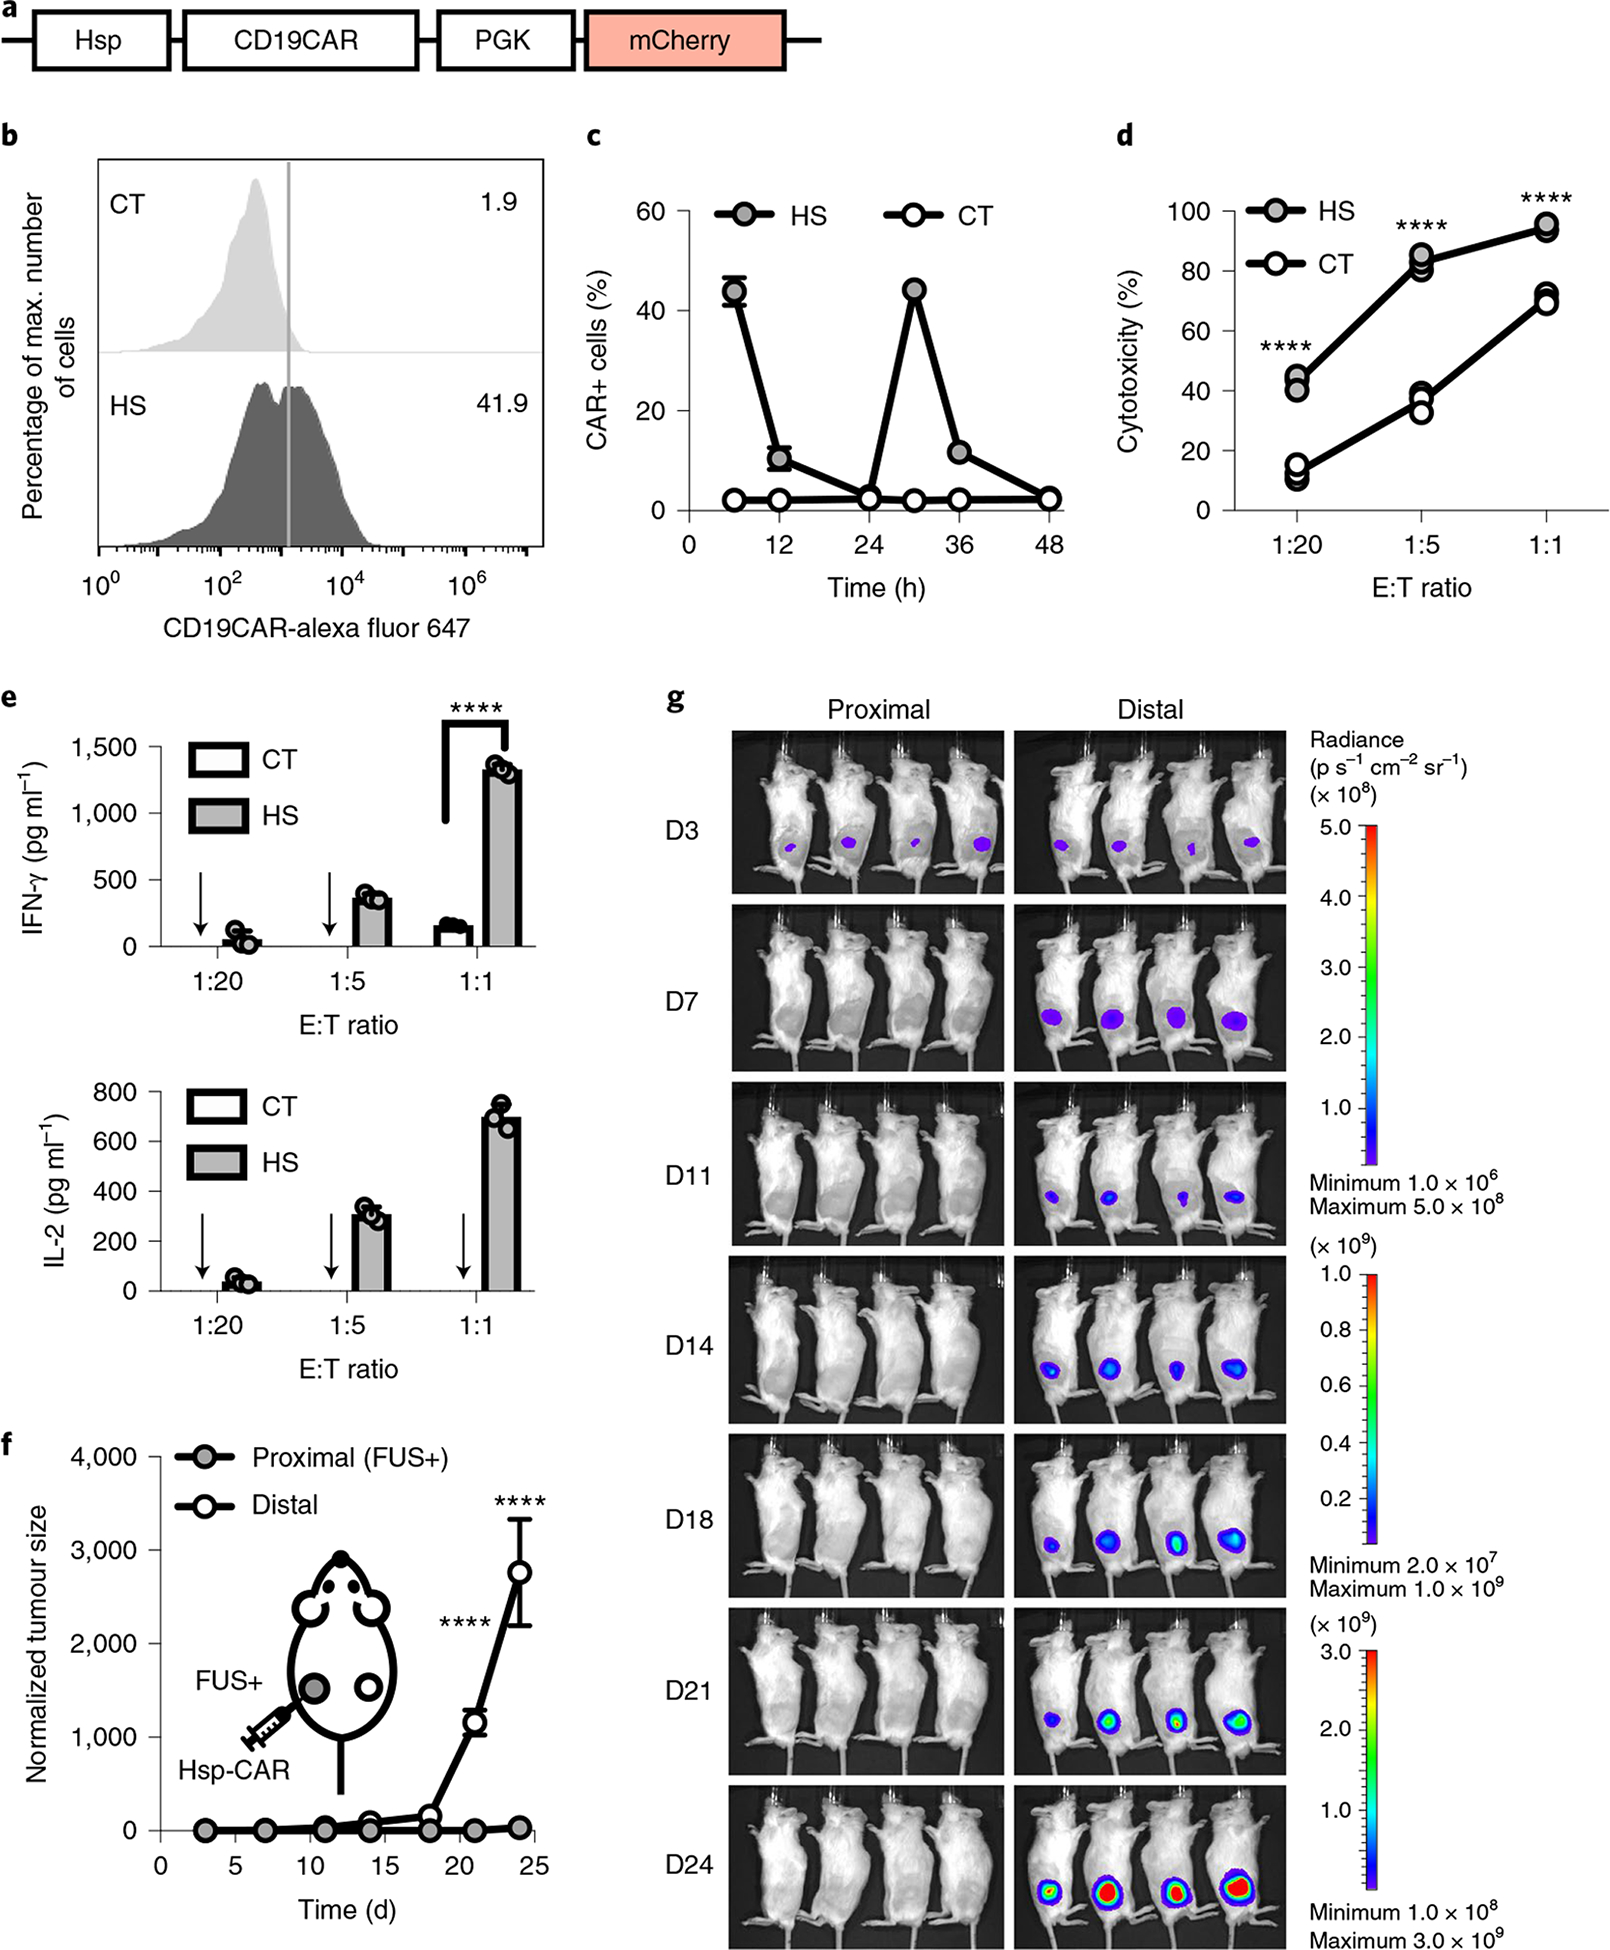
Focused ultrasound can deliver energy safely and non-invasively into tissues at depths of centimetres. Here we show that the genetics and cellular functions of chimeric antigen receptor T cells (CAR-T cells) within tumours can be reversibly controlled by the heat generated by short pulses of focused ultrasound via a CAR cassette under the control of a promoter for the heat-shock protein. In mice with subcutaneous tumours, locally injected T cells with the inducible CAR and activated via focused ultrasound guided by magnetic resonance imaging mitigated on-target off-tumour activity and enhanced the suppression of tumour growth, compared with the performance of non-inducible CAR-T cells. Acoustogenetic control of the activation of engineered T cells may facilitate the design of safer cell therapies.


Conflict of interest statement

Competing interests

Y. Wang is scientific co-founder of Cell E&G Inc. and Acoustic Cell Therapy Inc. These financial interests do not affect the design, conduct or reporting of this research.

Figures

Extended Data Fig. 1 |
Extended Data Fig. 1 |. Effectiveness of FUS-CAR T cells in the single-tumour model.
a, Timeline of the experiment. Fluc+ Nalm-6 tumour cells were injected subcutaneously into NSG mice to generate single tumour model. Ten days after tumour challenge, FUS-inducible CAR T or naive T cells were locally injected at the tumour site, followed by FUS stimulation. b-d, Normalized tumour size (*P = 0.027 at D17, *P = 0.021 at D21) (b), tumour volume (****P = 2.4 × 10⁻⁵, ****P < 1.0 × 10⁻¹⁵) (c) and BLI images (d). Tumour size was quantified using the integrated Fluc luminescence intensity of the tumour region and normalized to that of the same tumour on the first measurement. Tumour volume was calculated based on caliper measurement as described in Methods. Two-way ANOVA followed by Sidak’s multiple comparisons test. Data points and error bars represent means of 5 mice ± SEM.
Extended Data Fig. 2 |
Extended Data Fig. 2 |. Functionality of FUS-inducible PSMACAR T cells in vitro.
a, Schematics of transgenes: heat-inducible Cre and lox-stop PSMACAR reporter. b, Representative flow cytometry data of the percentage of double positive T cells after MACS. c, Representative PSMACAR induction by HS. d, Cytotoxicities of the T cells engineered with the transgenes in a against Fluc+ PSMA + PC3 tumour cells at various E:T ratios. From left to right: ****P = 3.09 × 10⁻⁶, P = 1.11 × 10⁻⁶, P < 1 × 10⁻¹⁵, P < 1 × 10⁻¹⁵, P < 1 × 10⁻¹⁵, P = 3 × 10⁻¹⁵. e, Quantification of IFN-γ and IL-2 cytokine release associated with d. Arrow: cytokine level not detectable. In c to e, CT: without HS. HS: with a continuous 15-min HS. Two-way ANOVA followed by Sidak’s multiple comparisons test. Bar heights and error bars represent means of 3 biological replicate ± SEM.
Extended Data Fig. 3 |
Extended Data Fig. 3 |. ‘Tumour only’ in vivo control experiment associated with Fig. 5.
a, Timeline of the ‘tumour only’ control group used as the reference for calculating in vivo cytotoxicity in Fig. 5e. NSG mice were subcutaneously injected with Nalm-6 tumours on both sides and received no other treatment. b–d, Monitoring of tumour aggressiveness: normalized tumour size (b), tumour volume (c) and BLI images (d). Tumour size was quantified using the integrated Fluc luminescence intensity of the tumour region and normalized to that of the same tumour on the first measurement. Tumour volume was calculated based on caliper measurement as described in Methods. No significant difference was detected by mixed-effects analysis followed by Sidak’s multiple comparisons test. Data points and error bars represent means of 4 mice ± SEM. One mouse was sacrificed on D24 according to euthanasia criteria.
Extended Data Fig. 4 |
Extended Data Fig. 4 |. Repeated FUS stimulation in vivo control experiment associated with Fig. 6.
a, Timeline of the experiment. Bilateral tumour-bearing mice received local FUS stimulation without T cell injection at the left tumour on Day 4 and Day 7. The right tumour received no treatment. b,c, Normalized tumour size (b) and BLI images of the tumours on both sides (c). Tumour size was quantified using the integrated Fluc luminescence intensity of the tumour region and normalized to that of the same tumour on the first measurement. Data points and error bars represent means of 4 mice ± SEM.
Extended Data Fig. 5 |
Extended Data Fig. 5 |. Unstimulated reversible FUS-CAR T in vivo control experiment associated with Fig. 6.
a, Timeline of the experiment. Bilateral tumour-bearing mice received local injections of the reversible FUS-CAR (Hsp-CAR) T cells without FUS stimulation at the left tumour (proximal) on Day 4 and Day 7. The right tumour (distal) received no treatment. b,c, Normalized tumour size (*P = 0.011, ****P = 1.4 × 10⁻⁵, Two-way ANOVA followed by Sidak’s multiple comparisons test) (b) and BLI images of the proximal and distal tumours (c). Tumour size was quantified using the integrated Fluc luminescence intensity of the tumour region and normalized to that of the same tumour on the first measurement. Data points and error bars represent means of 4 mice ± SEM.
Fig. 1 |
Fig. 1 |. Heat-inducible gene activation.
a, Design of the FUS-CAR-T-cell therapy technology. MRI-guided FUS induces localized activation of FUS-CAR-T cells to recognize and eradicate target tumour cells. b, Schematics of the dual-promoter eGFP reporter. c,d, HEK293 T cells containing the dual-promoter reporter received a 15 min, 43 °C HS at t = 0 h. Shown are fluorescent images of inducible eGFP and constitutive mCherry (c) and the percentages of eGFP+ cells and their mean fluorescence intensities (d). eg, Gene induction in primary human T cells with the dual-promoter eGFP reporter. Shown are representative flow cytometry profiles of eGFP expression (e), the percentages of eGFP+ cells (****P = 5.5 × 10⁻¹⁴) (f) and their mean fluorescence intensities (****P = 5.0 × 10⁻¹⁰) (g). Plots in f and g are parts of complete bar graphs shown in Supplementary Fig. 3d,e, with one-way analysis of variance (ANOVA) followed by Tukey’s multiple comparisons test. Bar heights and error bars represent means of three biological replicates ± s.e.m. mCherry+ cells were gated for eGFP expression analysis.
Fig. 2 |
Fig. 2 |. Heat-inducible CD19CAR expression and functionality in Jurkat and primary T cells.
a, Schematics of transgenes: inducible Cre and lox-stop CAR reporter. b, Inducible CAR expression in Jurkat cells hosting the lox-stop CAR reporter alone (lox), or both transgenes in a with HS or without HS (CT); NS, no significant difference, P = 0.086. c, Schematics of assays accessing the functionality of the heat-induced CAR-T cells, including CD69 expression, cytotoxicity and cytokine release. d, The percentage of CD69+ cells in Jurkat with both transgenes in a. ****P = 6.1 × 10⁻⁶, two-tailed Student’s t-test. e, Representative flow cytometry histograms of CD69 expression in d. f, Representative flow cytometry histograms of the percentage of CD19CAR-expressing cells in primary T cells with both transgenes in a. gi, T cells from f were co-cultured with Nalm-6 tumour cells at various E:T ratios for 24 h. Shown are quantified cytotoxicities of the T cells (****P = 8.3 × 10⁻⁸ at 1:20, ****P = 3.1 × 10⁻¹³ at 1:10, ****P = 5.9 × 10⁻¹⁴ at 1:5, ****P = 1.2 × 10⁻⁵ at 1:1) (g), and the associated release of cytokines IFN-γ (****P = 5.2 × 10⁻⁶ at 1:5, ****P = 8.7 × 10⁻⁶ at 1:1, ****P = 6.1 × 10⁻⁴ at 5:1) (h) and IL-2 (****P = 1.0 × 10⁻⁶ at 1:5, ****P = 4.9 × 10⁻¹⁰ at 1:1, ****P = 4.8 × 10⁻⁶ at 5:1) (i). Arrows in h and i indicate that cytokine level was not detectable. Two-way ANOVA followed by Sidak’s multiple comparisons test was used in b, gi. Bar heights and error bars represent means of three biological replicates ± s.e.m.
Fig. 3 |
Fig. 3 |. MRI-guided FUS-inducible gene activation in phantom and in vivo.
a, Schematics of the MRI-guided FUS system. b, Schematics of the dual-luciferase reporter. P2A, 2A self-cleaving peptide derived from porcine teschovirus-1. c, Experimental setup of FUS stimulation on cells in a tofu phantom. d, Gene induction level in Nalm-6 cells containing the dual-luciferase reporter with three pulses of 5 min heating by MRI-guided FUS in tofu phantom (FUS) or by thermal cycler (HS). Gene induction level was quantified by the Fluc/Rluc ratio and normalized to CT. **P = 0.0013 between CT and FUS; **P = 8.4 × 10⁻³ between CT and HS; NS, no significant difference, P = 0.1767. One-way ANOVA followed by Tukey’s multiple comparisons test. N = 3 biological replicates. e, Left: colour-coded temperature map superimposed on MRI images at different time points during a 5 min FUS stimulation at 43 °C on the hindlimb of an anaesthetised mouse. Right: close-up of the red rectangle region on the left. The dashed white square outlines the region of interest for temperature regulation. f, The average temperature of the region of interest during FUS stimulation in e. The yellow shadow represents the predefined target temperature (43 °C) and duration (300 s) of FUS stimulation. g, Gene induction in vivo by MRI-guided FUS on Nalm-6 cells with the dual-luciferase reporter. FUS+ or FUS−, with or without two pulses of 5 min FUS stimulation at 43 °C. Gene induction was quantified by the in vivo Fluc/Rluc ratio and normalized to the ‘FUS−, Before’ group, as indicated by the dotted line (y = 1). *P = 1.09 × 10⁻² between ‘FUS+, After’ and ‘FUS−, After’; **P = 9.3 × 10⁻³ between ‘FUS+, After’ and ‘FUS+, Before’. Two-way ANOVA followed by Sidak’s multiple comparisons test. N = 4 mice. h, Representative BLI images of Fluc expression before and after FUS stimulation in g. Bar heights and error bars represent mean ± s.e.m.
Fig. 4 |
Fig. 4 |. Tumour suppression by FUS-CAR-T cells in vivo.
a, Timeline of in vivo experiment using NSG mice bearing matched bilateral tumours. Both tumours received local subcutaneous (SC) injection of engineered CAR-T cells. The tumour on the left received FUS stimulation (FUS+) and the one on the right received no FUS (FUS−). be, Normalized tumour sizes (b,d) and representative BLI images (c,e) of Nalm-6 tumours (b,c) and PC3 tumours (d,e). Tumour size was quantified using the integrated Fluc luminescence intensity of the tumour region and normalized to that of the same tumour on the first measurement. In b, *P = 2.7 × 10⁻² at day 11 (D11), ****P = 4.52 × 10⁻⁶ at D14, ****P = 5.12 × 10⁻¹² at D18. In d, **P = 2.6 × 10⁻³ at D18, ****P = 3.5 × 10⁻⁹ at D22. Two-way ANOVA followed by Sidak’s multiple comparisons test. Data points and error bars represent means of four mice ± s.e.m.
Fig. 5 |
Fig. 5 |. Comparison of on-target off-tumour side effect between standard and FUS-CAR-T-cell therapy.
ad, Tumour growth (a,c) and BLI images (b,d) of the proximal and distal tumours in mice receiving standard CD19CAR T cells (a,b) or FUS-inducible CD19CAR (FUS-CAR) T cells (c,d). Tumour size was quantified using the integrated Fluc luminescence intensity of the tumour region and normalized to that of the same tumour on the first measurement. In a, ***P = 1.6 × 10⁻⁴ at D11, ****P = 5.5 × 10⁻⁶ at D14, ****P = 9.0 × 10⁻⁵ at D18. In c, ****P = 3.7 × 10⁻⁶ at D21, ****P = 1.7 × 10⁻⁹ at D24. e, Quantified in vivo cytotoxicities of standard and FUS-CAR-T cells against proximal and distal tumours on day 24 after tumour challenge. ****P = 3.2 × 10⁻⁸ between proximal and distal tumours in the FUS-CAR group. Two-way ANOVA followed by Sidak’s multiple comparisons test. N = 5 and 4 mice for standard and FUS-CAR groups, respectively. Data points in a and c and bar heights in e represent means. Error bars represent s.e.m.
Fig. 6 |
Fig. 6 |. Reversible FUS-CAR-T cells.
a, Schematics of the Hsp-CD19CAR transgene. b, Representative flow cytometry data of CAR expression profile 6 h after HS. c, Dynamics of CAR expression in cells with repeated HS stimulation at 0 h and 24 h. d,e, Cytotoxicities of the engineered T cells against Nalm-6 cells at different E:T ratios (left to right: ****P = 7.9 × 10⁻⁹, ****P = 5.2 × 10⁻¹¹, ****P = 1.1 × 10⁻⁷) (d) and the associated IFN-γ (****P = 2.8 × 10⁻¹⁴) and IL-2 cytokine secretion (e). Arrow, cytokine level not detectable. N = 3 biological replicates. f,g, Normalized tumour size (f) and BLI images (g) of bilateral tumour-bearing mice with local administration of reversible FUS-CAR-T cells followed by FUS stimulation at the proximal tumour on D4 and D7. Tumour size was quantified using the integrated Fluc luminescence intensity of the tumour region and normalized to that of the same tumour on the first measurement. In f, ****P = 3.6 × 10⁻⁵ at D21, ****P = 9.0 × 10⁻¹⁵ at D24. N = 4 mice. Two-way ANOVA followed by Sidak’s multiple comparisons test. Data points in c and f and bar heights in e represent means. Error bars represent s.e.m.

References

    1. Tsien RY Imagining imaging’s future. Nat. Rev. Mol. Cell Biol 4 (Suppl.), SS16–SS21 (2003). - PubMed
    1. Thanou M & Gedroyc W MRI-guided focused ultrasound as a new method of drug delivery. J. Drug Deliv 2013, 616197 (2013). - PMC - PubMed
    1. Deckers R et al. Image-guided, non-invasive, spatiotemporal control of gene expression. Proc. Natl Acad. Sci. USA 106, 1175–1180 (2009). - PMC - PubMed
    1. Guilhon E et al. Image-guided control of transgene expression based on local hyperthermia. Mol. Imaging 2, 11–17 (2003). - PubMed
    1. Wang S, Zderic V & Frenkel V Extracorporeal, low-energy focused ultrasound for noninvasive and nondestructive targeted hyperthermia. Future Oncol. 6, 1497–1511 (2010). - PubMed

Publication types