. 2021 Sep;53(9):1360-1372.
doi: 10.1038/s41588-021-00906-y. Epub 2021 Aug 12.

Somatic mutations of GNA11 and GNAQ in CTNNB1-mutant aldosterone-producing adenomas presenting in puberty, pregnancy or menopause

Affiliations

Somatic mutations of GNA11 and GNAQ in CTNNB1-mutant aldosterone-producing adenomas presenting in puberty, pregnancy or menopause

Junhua Zhou et al. Nat Genet. 2021 Sep.

Abstract

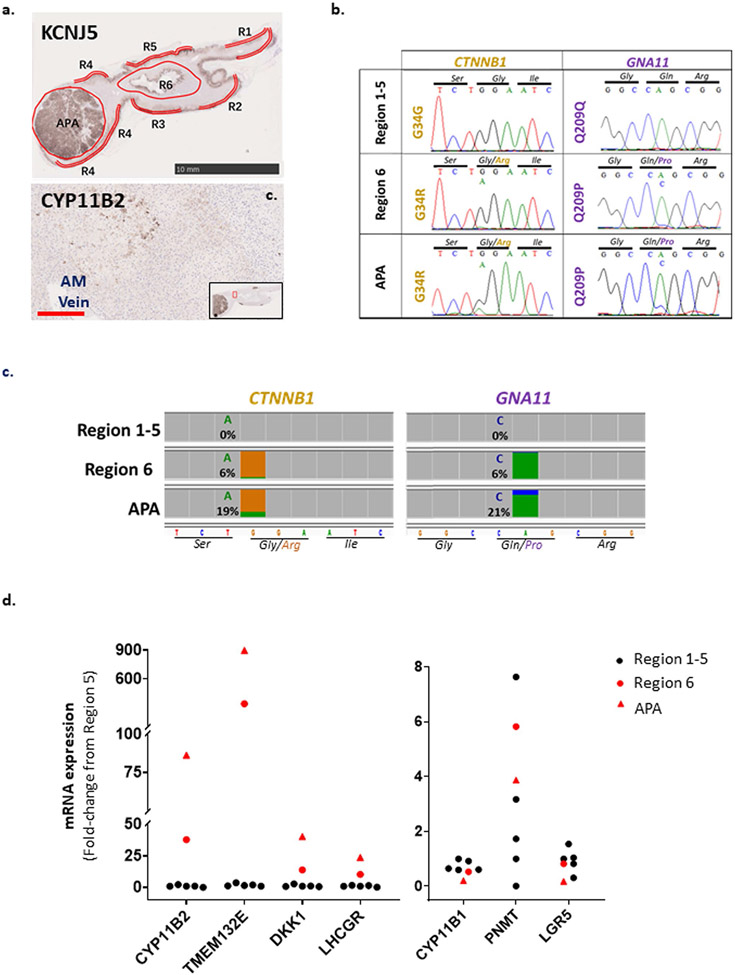
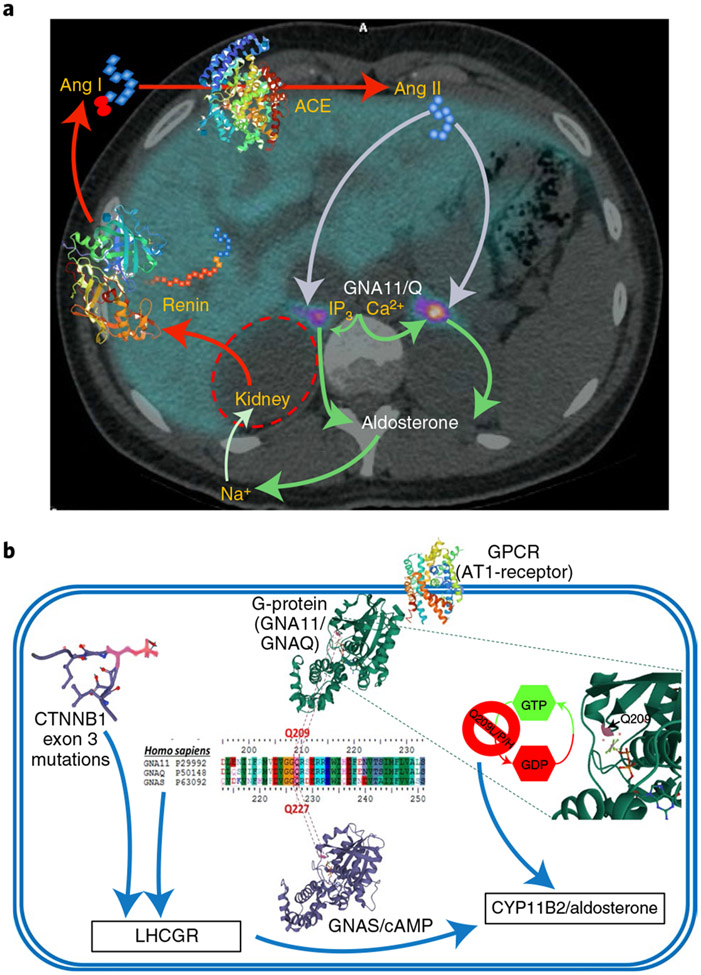
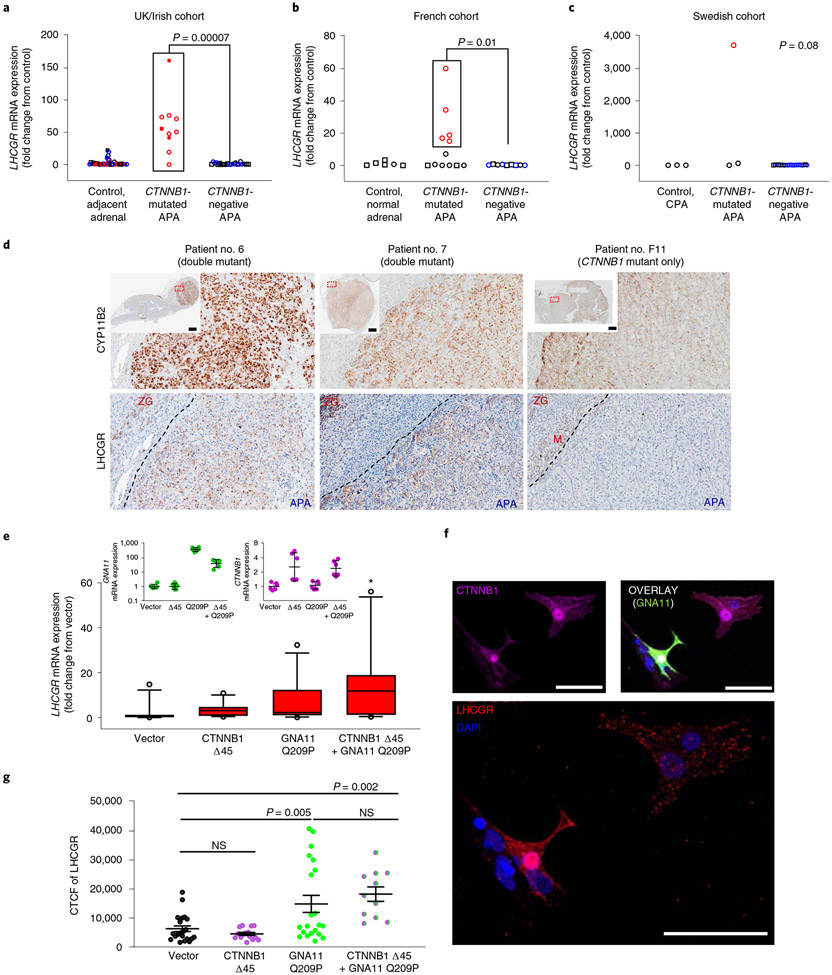
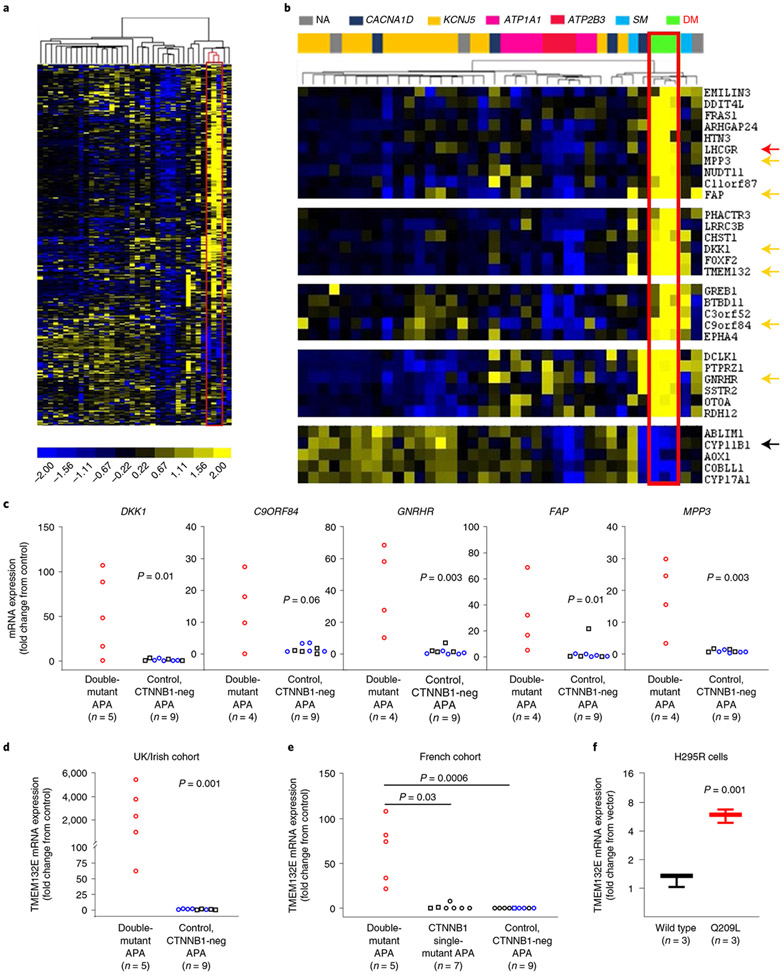
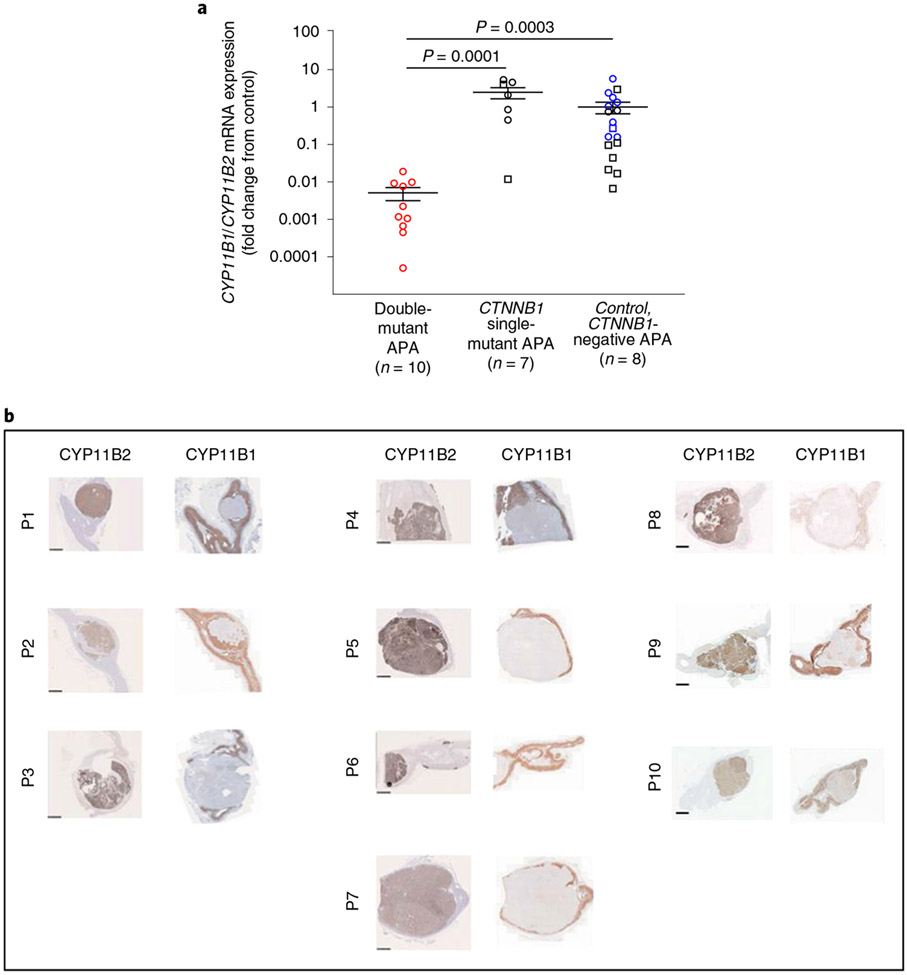
Most aldosterone-producing adenomas (APAs) have gain-of-function somatic mutations of ion channels or transporters. However, their frequency in aldosterone-producing cell clusters of normal adrenal gland suggests a requirement for codriver mutations in APAs. Here we identified gain-of-function mutations in both CTNNB1 and GNA11 by whole-exome sequencing of 3/41 APAs. Further sequencing of known CTNNB1-mutant APAs led to a total of 16 of 27 (59%) with a somatic p.Gln209His, p.Gln209Pro or p.Gln209Leu mutation of GNA11 or GNAQ. Solitary GNA11 mutations were found in hyperplastic zona glomerulosa adjacent to double-mutant APAs. Nine of ten patients in our UK/Irish cohort presented in puberty, pregnancy or menopause. Among multiple transcripts upregulated more than tenfold in double-mutant APAs was LHCGR, the receptor for luteinizing or pregnancy hormone (human chorionic gonadotropin). Transfections of adrenocortical cells demonstrated additive effects of GNA11 and CTNNB1 mutations on aldosterone secretion and expression of genes upregulated in double-mutant APAs. In adrenal cortex, GNA11/Q mutations appear clinically silent without a codriver mutation of CTNNB1.


Figures

Extended Data Fig. 1 ∣
Extended Data Fig. 1 ∣. High LHCGR expression in GNA11 and CTNNB1 double mutant co-transfected primary human adrenal cells.
a, APA 351 T cells transfected with CTNNB1 (untagged plasmid) and GNA11 (GFP-tagged plasmid) wild-type or Q209P (red boxed cell). LHCGR and CTNNB1 expression was visualized as in Fig. 3f using the primary antibody rabbit anti-LHCGR #NLS1436 (1:200; Novus Biologicals, UK) and the primary antibody mouse anti-CTNNB1 #610154 (1:100; BD transduction Lab, USA), respectively. Scale bars, 50 μm. b, Immunofluorescence of LHCGR in APA 351 T cells was quantified using corrected total cell fluorescence (CTCF). LHCGR expression was increased in cells expressing high CTNNB1 and GNA11 Q209P (the exact number, n, of cells quantified from two independent experiment are as indicated below the x-axis; the P-values indicated are according to Kolmogorov–Smirnov statistical test). High CTNNB1 was determined as CTCF > 10,000. Data are presented as mean values +/− s.e.m.
Extended Data Fig. 2 ∣
Extended Data Fig. 2 ∣. GNA11 somatic mutations were found in the adjacent adrenals to double-mutant APA of patient 6.
a, From six different regions (R1-5, at the edges of the adrenal cortex, R6 and APA, within the circled areas) in the formalin fixed paraffin embedded (FFPE) adjacent adrenal gland, genomic DNA samples of patient 6 were genotyped for CTNNB1 and GNA11 mutations. Immunohistochemistry of KCNJ5 and CYP11B2 were used for region selection. Scale bar, 10 mm and 50 μm as indicated. b, Sanger sequencing identified weak chromatogram peaks of CTNNB1 G34R and GNA11 Q209P somatic mutations in region 6 of the adjacent adrenal gland. c, Next generation sequencing confirmed the CTNNB1 G34R and GNA11 Q209P mutations in region 6 of the adjacent adrenal gland. d, qPCR of R1-6 and APA showed a 337-fold higher of TMEM132E, 38-fold higher of CYP11B2, 14-fold higher of DKK1 and 10-fold higher of LHCGR expression in region 6 compared to region 5. Regions 1-5 have similar expression of the above genes. The APA had the highest expression of CYP11B2, TMEM132E, DKK1, LHCGR and lowest expression of CYP11B1 and LGR5 compared to regions 1–6.
Fig. 1 ∣
Fig. 1 ∣. Clinical and cellular schemata showing the critical roles of GNA11/Q, and their p.Gln209 residue, in the production of aldosterone.
a, The renin–angiotensin–aldosterone system is superimposed on an axial PET CT image through the adrenal glands. The image is taken from the 11C-metomidate PET CT of one of the women whose unilateral (left) double-mutant, aldosterone-producing adenoma (APA) was diagnosed by the scan. Renin, a hormone-enzyme, is secreted from the kidneys in response to falls in blood pressure or sodium (Na+). Its substrate, the protein angiotensinogen, is cleaved into an inert decapeptide, Ang I, which is converted on further cleavage by the angiotensin-converting-enzyme (ACE) into the octapeptide, Ang II. This is a potent vasoconstrictor and principal physiological stimulus of aldosterone production in the ZG cells of the outer adrenal cortex. The cellular actions of Ang II are mediated by coupling of its receptor (AT1R) to IP3 and intracellular calcium (Ca2+) release, through a trimeric G-protein whose α-subunit is either Gα11 or Gαq. b, A single cell of a double-mutant APA, illustrating similar two- and three-dimensional (3D) structures of GNA11/Q and GNAS, proximity of the Q209 (GNA11/Q) or Q227 (GNAS) residue to GDP and synergism between somatic mutations of GNA11/Q and CTNNB1, upregulating LHCGR expression and production of aldosterone. The Q209 residue of Gα11 or Gαq (encoded by GNA11 or GNAQ) and analogous residue of other G-proteins is essential for GTPase activity. 3D structures for GNAQ and GNAS show the p.Gln residue in purple. Somatic or mosaic mutation of p.Gln inhibits GTPase activity and constitutively activates downstream signaling. We find that p.Gln mutation of GNA11/Q stimulates aldosterone production and, in the adrenal, always coexists with somatic mutation in exon 3 of CTNNB1. This prevents inactivation by phosphorylation (for example, of p.Ser33 (in purple), in the partial 3D sequence). Double mutation of GNA11/Q and CTNNB1 induces high expression of multiple genes, including LHCGR, the Gαs/cyclic adenosine monophosphate-coupled receptor of luteinizing and pregnancy hormones. The 3D structures of CTNNB1, GNAS, GNAQ, AT1-receptor, renin and ACE were downloaded from models 6M93, 3C14, 4QJ3, 6YV1, 2V0Z and 1O8A, respectively, at www.rcsb.org/.
Fig. 2 ∣
Fig. 2 ∣. Mutations of GNA11/Q Q209 increase aldosterone production in human adrenocortical cells.
a, Transfection of mutations of GNA11 Q209 (Q209L, Q209P and Q209H) into immortalized adrenocortical H295R cells stimulated aldosterone secretion (n = 40 wells examined over five independent experiments, P = 1 × 10⁻¹⁵ by one-way Kruskal–Wallis test, χ2(4) = 105.78). b, CYP11B2 mRNA expression was increased in H295R cells transfected with GNA11 mutations (n = 12–31 biologically independent samples, P = 9 × 10⁻⁹ by one-way Kruskal–Wallis test, χ2(4) = 43.34). c, Effect of GNA11 mutations on aldosterone secretion in H295R cells cotransfected with either scrambled siRNA (SiScrambled) or siRNA targeting CTNNB1 (SiCTNNB1) (n = 12–20 biologically independent samples). d, Effect of GNA11 mutations on aldosterone secretion in H295R cells in the presence of either the selective β-catenin inhibitor ICG-001 (3 μM) or vehicle control (n = 10 wells examined over three independent experiments). e, Cells from APA 351 T, wild type for CTNNB1 and GNA11/Q (genotype presented in Supplementary Table 2), were transfected with either wild-type GNA11 (WT) or GNA11 Q209H/L only (Q209H/L) or cotransfected with either wild-type CTNNB1 (WT + WT) or CTNNB1 Δ45 (Δ45). Double mutations increased aldosterone secretion compared to single mutations (n = 3 independent transfections, P = 0.0003 by one-way ANOVA). f, Effect of GNAQ Q209H mutation on aldosterone secretion in H295R cells (n = 10 wells examined over three independent experiments). a,b,f, In box-and-whisker plots, the central line, box and whiskers indicate the median, interquartile range (IQR) and 10th–90th percentile, respectively. For bar charts (c,d) and scatterplots (e), data are presented as mean values ± s.e.m. Results for a,b,d,f are expressed as fold change from wild-type untreated transfected cells. Results for c,e are expressed as pM of aldosterone per μg of protein. The exact sample numbers (n) are as indicated below the x axes. P values from Dunn’s multiple comparisons test are as indicated in a,b, whereas those indicated in e are from Bonferroni’s multiple comparisons test. P values indicated in c,d,f are from two-tailed Student’s t-test. NS, not significant. The data used to generate these plots are provided as a Source data file.
Fig. 3 ∣
Fig. 3 ∣. High LHCGR expression in GNA11/Q and CTNNB1 double-mutant adrenal cells.
a, LHCGR mRNA in ten double-mutant, CTNNB1-mutated APAs in the discovery UK/Irish cohort was increased compared to 24 CTNNB1-negative APAs and 34 control adjacent adrenals (P = 0.0001 by one-way Kruskal–Wallis test, χ2(2) = 18.02). b, LHCGR mRNA in five double-mutant APAs in the replication French cohort was increased compared to seven APAs with solitary CTNNB1 mutations, nine CTNNB1-negative APAs and six control normal adrenals (P = 0.003 by one-way Kruskal–Wallis test, χ2(3) = 13.70). c, LHCGR mRNA in one double-mutant APA in the replication Swedish cohort compared to two APAs with only CTNNB1 mutations, 20 CTNNB1-negative APAs and three cortisol-producing adenomas (P = 0.08 by one-way Kruskal–Wallis test, χ2(3) = 6.87). d, LHCGR protein is highly expressed in double-mutant APAs that presented at times of high LH/HCG (for example, patient no. 6 during menopause and patient no. 7 during pregnancy) compared to single CTNNB1-mutant APAs (for example, patient no. F11). Scale bars, 2 mm. e, mRNA of GNA11 (green symbols, n = 6), CTNNB1 (magenta symbols, n = 6) and LHCGR in APA 392 T cells transfected with vector control (n = 11), Δ45 CTNNB1-untagged plasmid (n = 11), Q209P GNA11 GFP-tagged plasmid (n = 12) or cotransfected with both Δ45 CTNNB1 and Q209P GNA11 plasmids (n = 10). LHCGR mRNA was increased in double-mutant cells (P = 0.02 by one-way Kruskal–Wallis test, χ2(3) = 9.78). The central line, box and whiskers indicate the median, IQR and 10th–90th percentile, respectively. Error bars represent geometric mean ± s.d. f, Immunofluorescence of GNA11 (green), CTNNB1 (magenta) and LHCGR (red) from cells transfected as in e. Scale bars, 50 μm. g, CTCF of LHCGR in cells transfected as in e,f. Double-mutant cells had higher CTCF compared to vector control (P = 0.00005 by one-way ANOVA). Exact n numbers indicated below the x axis. Data presented as mean values ± s.e.m. P values from Dunn’s multiple comparisons test indicated in a,b,e (*P = 0.02 comparing vector and double-mutant cells), and Holm–Sidak’s multiple comparison test in g. n represents biologically independent samples. Squares, males; circles, females; open symbols, fresh-frozen/RNAlater-solution-preserved tissues; closed symbols, FFPE tissues; red symbols, double mutants; blue symbols, KCNJ5 mutants; black symbols, KCNJ5 wild type. The data used to generate these plots are provided as a Source data file.
Fig. 4 ∣
Fig. 4 ∣. Gene expression profiles in GNA11/Q and CTNNB1 double-mutant adrenal cells.
a, Heat map representation of 362 DEG with large variance (log2 difference >4) among APAs in at least one of three transcriptome studies (2012 microarray, including patient no. 6 (ref. ), and 2015 microarray, including patient no. 4 (ref. ), Swedish RNA-seq). Each column represents the expression profile of the APA (n = 38). Both genes and individual APAs are hierarchically clustered. The unsupervised cluster analysis of samples, indicated by the bracketing above the heat map, separated the expression profiles of GNA11/Q and CTNNB1 double-mutant APAs (boxed red). Yellow and blue colors indicate high and low expression levels, respectively, relative to the mean (as indicated by the color scale bar). b, Zoomed image of the heat map in a featuring six interesting DEG (yellow arrows) separating double-mutant (DM) APAs from single-mutant APAs (SM) and other APA genotypes. LHCGR (red arrow) and CYP11B1 (black arrow) also clustered double-mutant APAs together. c, The DEG highlighted in b were investigated in double-mutant APAs from the UK/Irish cohort compared to CTNNB1-negative APAs. All, except for C9ORF84 (which had a trend), had significantly higher mRNA expression in double-mutant APAs (the P values indicated are based on the Kolmogorov–Smirnov statistical test). d–f, DEG TMEM132E mRNA expression was significantly higher in double-mutant APAs from the UK/Irish cohort compared to CTNNB1-negative APAs (d; P = 0.001 by Kolmogorov–Smirnov test), in double-mutant APAs from the French cohort compared to CTNNB1 single-mutant APAs (e, P = 0.0002 by one-way Kruskal–Wallis test, χ2(2) = 13.01; P values from Dunn’s multiple comparisons test are indicated), and in GNA11 Q209L-transfected H295R cells compared to GNA11 wild-type-transfected cells (f, P = 0.001 by two-tailed Student’s t-test). Central line, box and whiskers indicate the median, IQR and 10th–90th percentile, respectively. GNA11 mRNA expression in GNA11 Q209L- and wild-type-transfected cells was not significantly different. The exact sample number (n), as indicated below the x axes, represents biologically independent samples. Squares, males; circles, females; red symbols, double mutants; blue symbols, KCNJ5 mutants; black symbols, KCNJ5 wild type.
Fig. 5 ∣
Fig. 5 ∣. Expression of aldosterone synthase (CYP11B2) and 11β-hydroxylase (CYP11B1) in GNA11/Q and CTNNB1 double-mutant APAs.
a, Quantitative PCR analysis of CYP11B1 and CYP11B2 mRNA expression demonstrated that double-mutant APAs have a lower CYP11B1/CYP11B2 mRNA expression ratio compared to CTNNB1 single-mutant APAs or APAs wild type for CTNNB1 and GNA11/Q (CTNNB1-negative APA) (P = 0.00004 by one-way Kruskal–Wallis test, χ2(2) = 20.23; P values from Dunn’s multiple comparisons test are as indicated). Results are expressed as fold change from CTNNB1 wild-type APAs (CTNNB1-negative APA). Error bars presents mean ± s.e.m. The exact sample number (n), as indicated below the x axis, represents biologically independent samples. Squares, males; circles, females; red symbols, double mutants; blue symbols, KCNJ5 mutants; black symbols, KCNJ5 wild type. b, Immunohistochemistry of CYP11B2 and CYP11B1 in the UK/Irish cohort using the primary antibody anti-CYP11B2 and anti-CYP11B1 no. MABS502, clone 80-7. The histotype of high CYP11B2 protein expression and low CYP11B1 expression was apparent, correlating with the low CYP11B1/CYP11B2 mRNA expression seen in a. Scale bars, 2.5 mm.
Fig. 6 ∣
Fig. 6 ∣. GNA11 somatic mutations were found in adrenals adjacent to double-mutant APAs.
a–c, Patient no. 7. a, Genomic DNA from six different regions (R1–R6) in the fresh-frozen adrenal sample, and associated RNA from regions 1–3 (R1–R3), were genotyped for CTNNB1 and GNA11 mutations. b, qPCR of samples in a showed 135–151-fold lower mRNA expression level of CYP11B2 and 16,102–23,987-fold lower mRNA expression level of LHCGR in R1 cDNA compared to R2 and R3, respectively. DEG highly expressed in double-mutant APAs but lowly expressed in R1 cDNA are presented in Supplementary Fig. 6a. c, Sanger sequencing of samples in a detected solitary GNA11 Q209H mutation in R1 cDNA and double mutations CTNNB1 S45F and GNA11 Q209H in R2 and R3 cDNA. Interestingly, genotyping of R1 genomic DNA (from the same sample as R1 cDNA) detected a homozygous GNA11 Q209H mutation (Supplementary Fig. 6a). d–f, Patient no. 1. d, Patient no. 1 was found to have hyperplastic ZG in adrenal adjacent to double-mutant APA; ZG hyperplasia was demarcated by lack of subcapsular CYP11B1 (visualized using a custom antibody). The hyperplastic ZG was CYP11B2 negative (visualized using a custom antibody) but LHCGR positive (visualized using the antibody NLS1436). This phenotype was consistently present in the UK/Irish discovery cohort (Supplementary Fig. 5c). e, Genomic DNA from the hyperplastic ZG of nine distinct regions of patient no. 1’s adjacent adrenal were collected systematically using segmental LCM of FFPE adrenal sections stained with cresyl violet. f, Solitary heterozygous and solitary homozygous GNA11 Q209P somatic mutations were detected in LCM ZG genomic DNA collected in e from R1 (ZG1 genomic DNA) and R6 (ZG6 genomic DNA), respectively. ZG samples from other regions were wild type for both CTNNB1 and GNA11, along with the other adrenal zones (Supplementary Fig. 6b). H&E, hematoxylin and eosin.

Similar articles

Cited by

References

    1. Choi M et al. K+ channel mutations in adrenal aldosterone-producing adenomas and hereditary hypertension. Science 331, 768–772 (2011). - PMC - PubMed
    1. Beuschlein F et al. Somatic mutations in ATP1A1 and ATP2B3 lead to aldosterone-producing adenomas and secondary hypertension. Nat. Genet 45, 440–444 (2013). - PubMed
    1. Scholl UI et al. Somatic and germline CACNA1D calcium channel mutations in aldosterone-producing adenomas and primary aldosteronism. Nat. Genet 45, 1050–1054 (2013). - PMC - PubMed
    1. Azizan EA et al. Somatic mutations in ATP1A1 and CACNA1D underlie a common subtype of adrenal hypertension. Nat. Genet 45, 1055–1060 (2013). - PubMed
    1. Azizan EA et al. Microarray, qPCR and KCNJ5 sequencing of aldosterone-producing adenomas reveal differences in genotype and phenotype between zona glomerulosa- and zona fasciculata-like tumors. J. Clin. Endocrinol. Metab 97, E819–E829 (2012). - PubMed

Publication types