. 2021 Sep;22(9):1152-1162.
doi: 10.1038/s41590-021-00987-1. Epub 2021 Aug 12.

TCF-1 controls Treg cell functions that regulate inflammation, CD8+ T cell cytotoxicity and severity of colon cancer

Affiliations

TCF-1 controls Treg cell functions that regulate inflammation, CD8+ T cell cytotoxicity and severity of colon cancer

Abu Osman et al. Nat Immunol. 2021 Sep.

Abstract

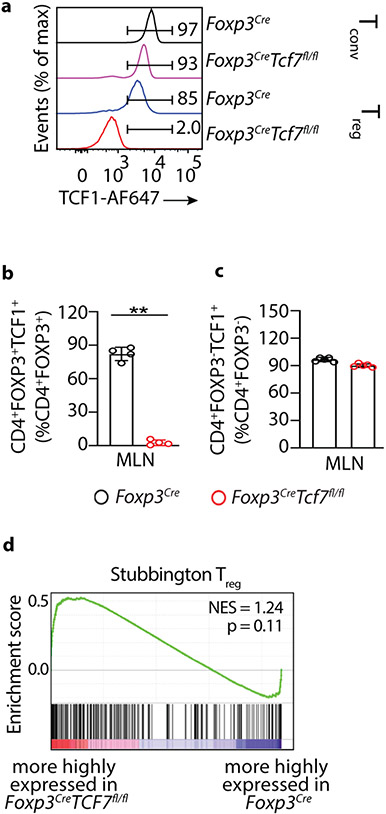
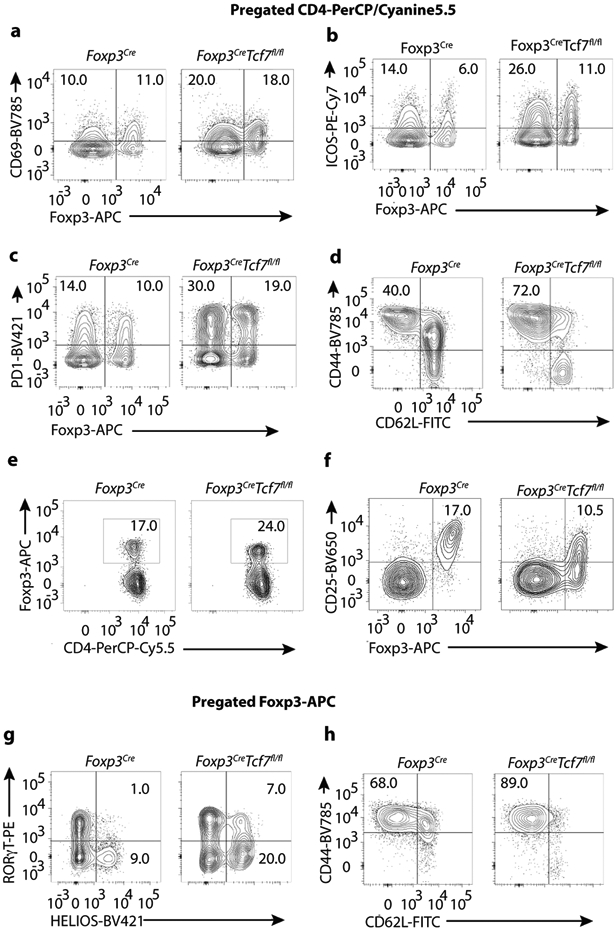
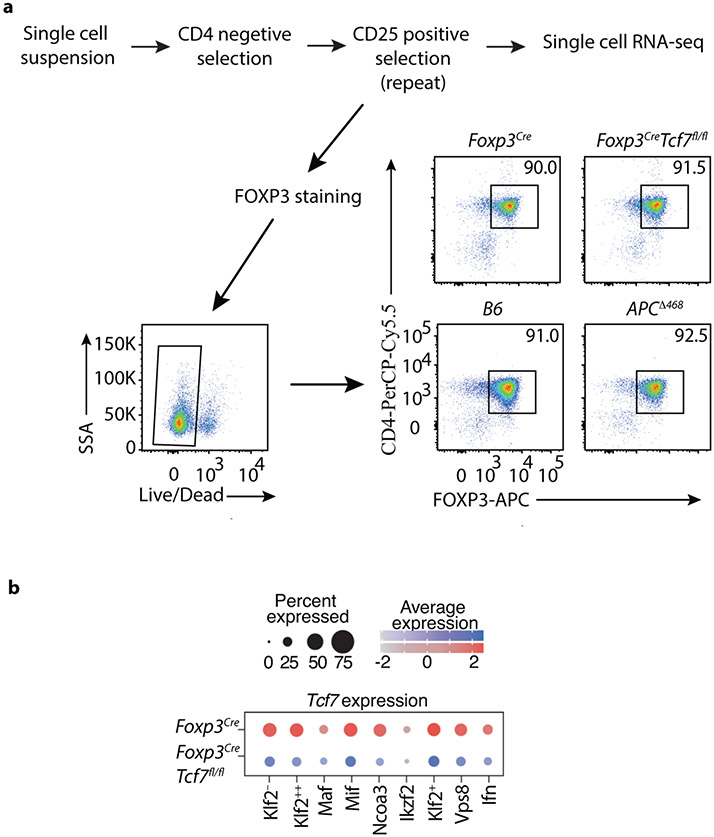
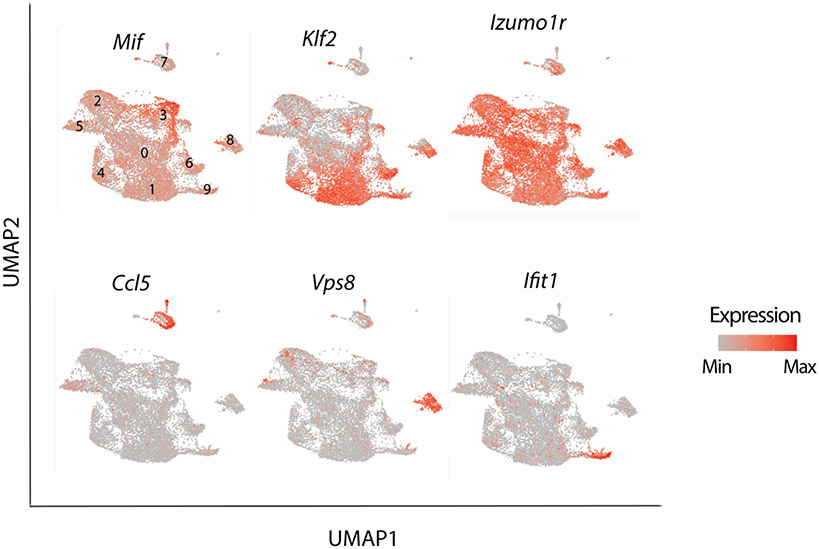
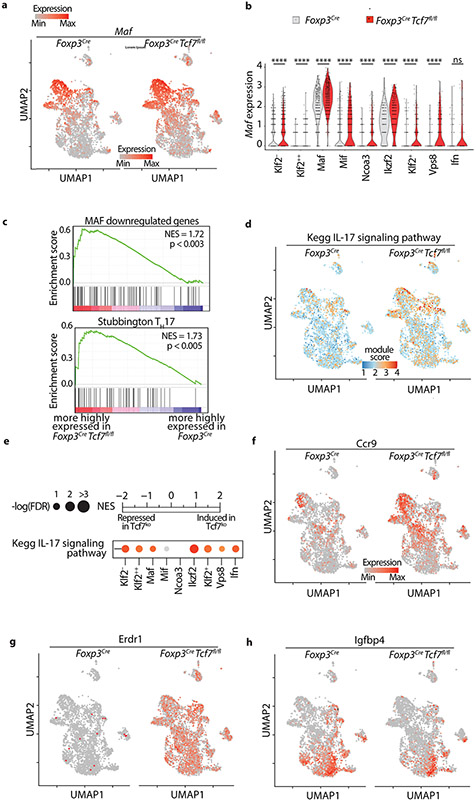
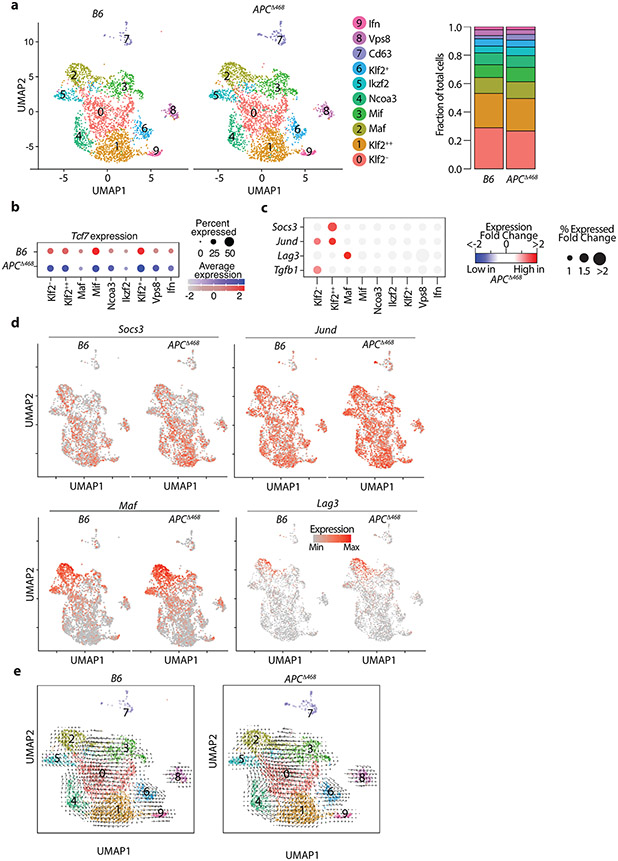
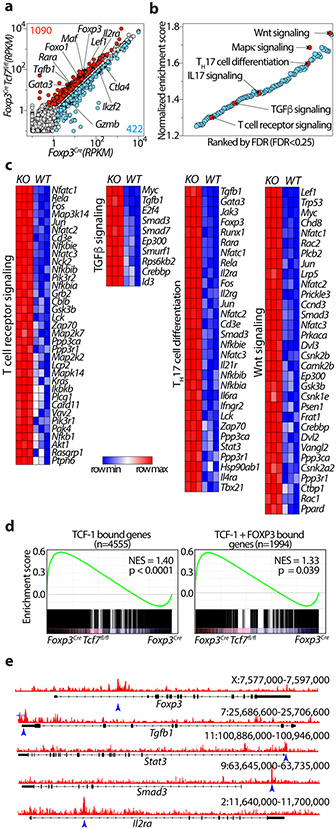
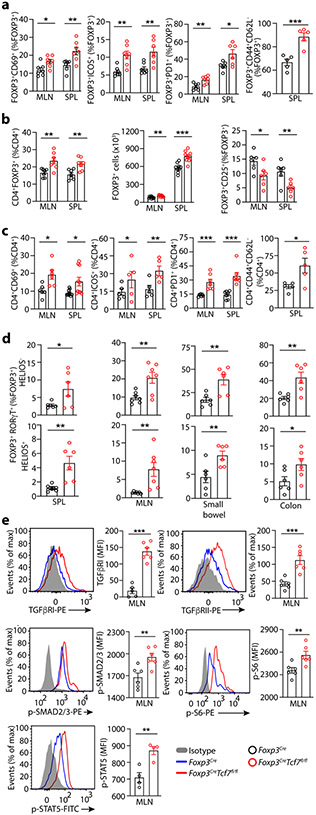
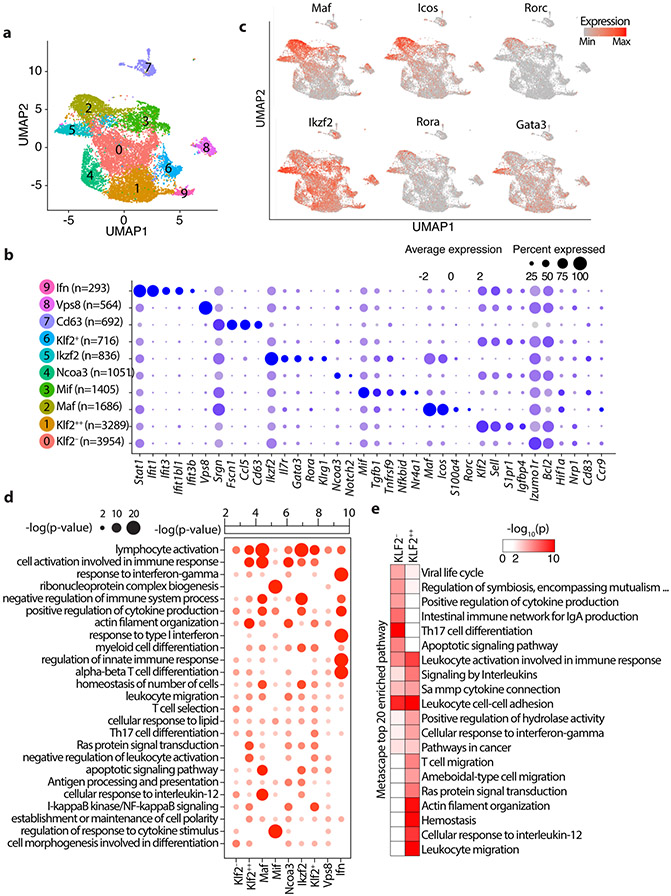
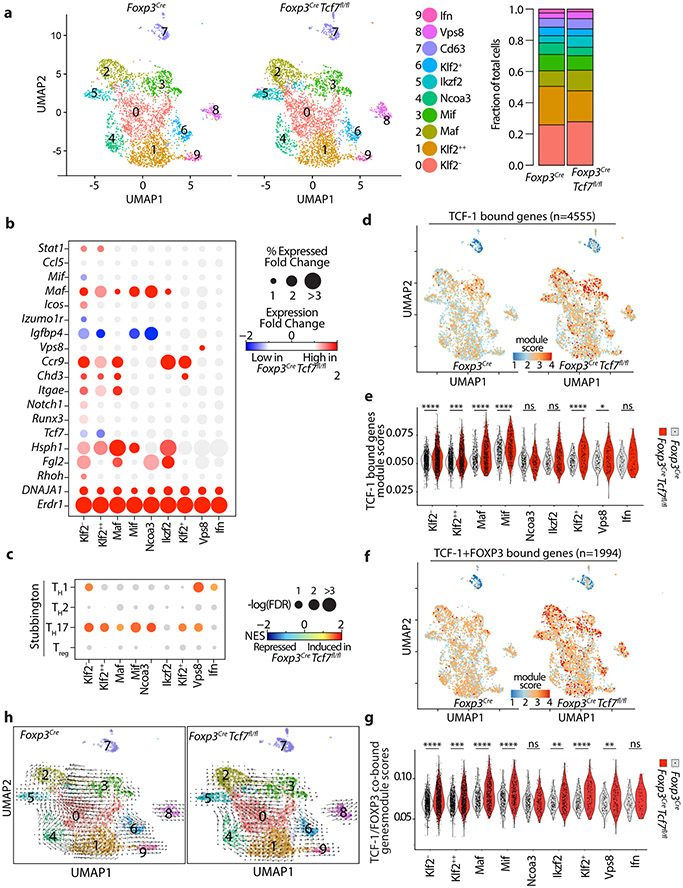
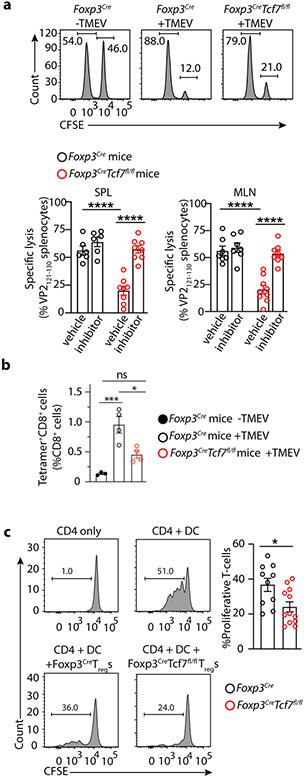
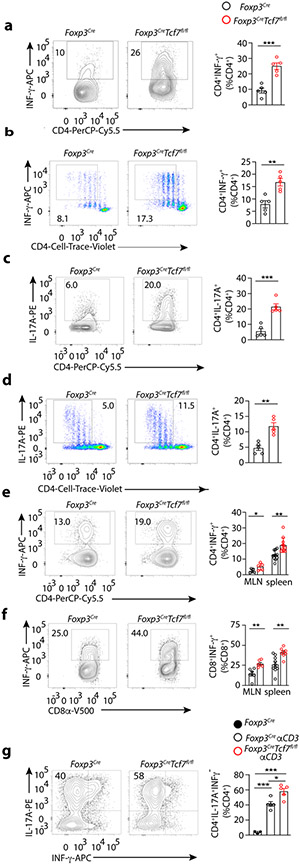
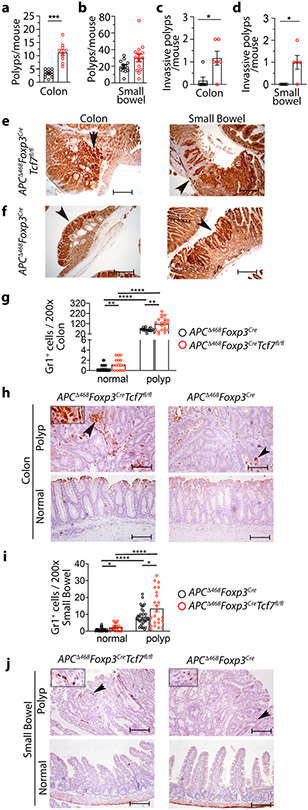
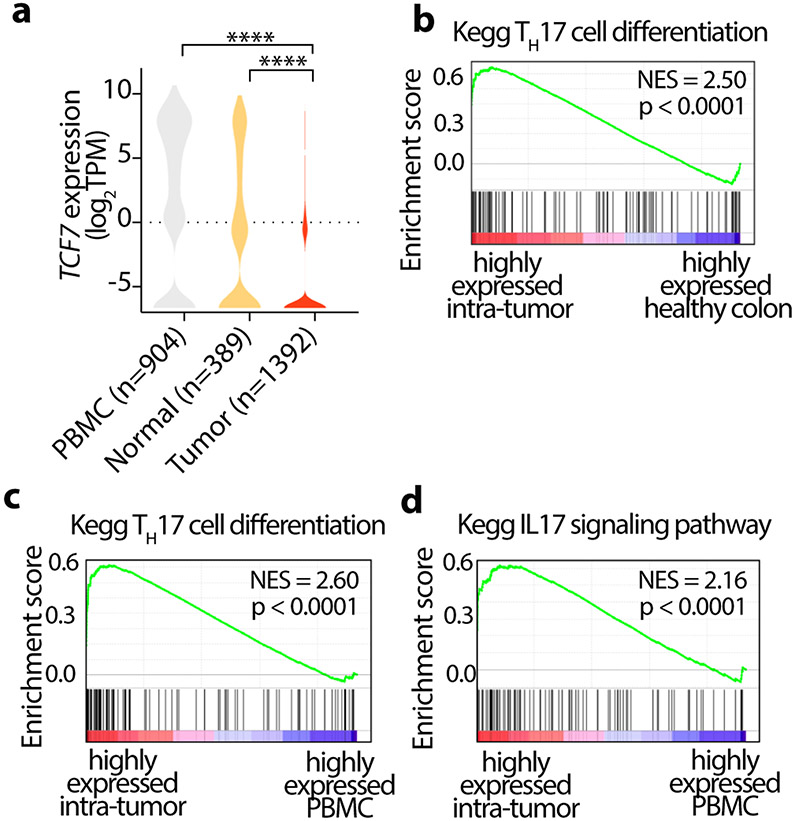
The transcription factor TCF-1 is essential for the development and function of regulatory T (Treg) cells; however, its function is poorly understood. Here, we show that TCF-1 primarily suppresses transcription of genes that are co-bound by Foxp3. Single-cell RNA-sequencing analysis identified effector memory T cells and central memory Treg cells with differential expression of Klf2 and memory and activation markers. TCF-1 deficiency did not change the core Treg cell transcriptional signature, but promoted alternative signaling pathways whereby Treg cells became activated and gained gut-homing properties and characteristics of the TH17 subset of helper T cells. TCF-1-deficient Treg cells strongly suppressed T cell proliferation and cytotoxicity, but were compromised in controlling CD4+ T cell polarization and inflammation. In mice with polyposis, Treg cell-specific TCF-1 deficiency promoted tumor growth. Consistently, tumor-infiltrating Treg cells of patients with colorectal cancer showed lower TCF-1 expression and increased TH17 expression signatures compared to adjacent normal tissue and circulating T cells. Thus, Treg cell-specific TCF-1 expression differentially regulates TH17-mediated inflammation and T cell cytotoxicity, and can determine colorectal cancer outcome.


Conflict of interest statement

Conflicting Interests

The authors have no conflicting interests.

Figures

Extended Data Fig 1
Extended Data Fig 1. TCF-1 deficiency selectively reprograms Treg-cells without compromising their core signature.
Treg-cells were isolated from the mesenteric lymph nodes of Foxp3Cre and Tcf7fl/flFoxp3Cre mice. (a) Representative FACS histograms of MLN purified cells from Foxp3Cre Tcf7fl/fl and control Foxp3Cre showing selective loss of TCF-1 from Treg-cells in Foxp3Cre Tcf7fl/fl mice. (b and c) Histogram plots showing the cumulative data of the same. (b: n = 4; p < 0.0001 & c: n = 5) Data are representative of two independent experiments and n represents biologically independent replicate mice; means ± SEM; two-sided, unpaired t-test. (d) GSEA plot comparing the enrichment of genes expressed more strongly in Foxp3Cre versus Foxp3CreTcf7fl/fl Treg-cells.
Extended Data Fig. 2
Extended Data Fig. 2. Representative FACS plots of cell lymphocytes surface markers expressed by Treg_cells
Treg-cells were isolated from the mesenteric lymph nodes of Foxp3Cre and Tcf7fl/flFoxp3Cre mice. See cumulative data presented in Figure 2. (a-c) CD4+ cells were pre-gated and frequency of CD69+, ICOS+, and PD1+ cells among CD4+FOXP3 Tcon or CD4+FOXP3+ Treg-cells was measured, as indicated. (d) CD4+ cells were pre-gated and frequency of CD44+CD62L cells among CD4+FOXP3 Tcon cells was measured. (e) CD4+ cells were pre-gated and frequency of CD4+FOXP3+ Treg-cells was measured. (f) CD4+ cells were pre-gated and frequency of FOXP3+CD25+ Treg-cells was measured. (g) CD4+FOXP3+ Treg-cells were pre-gated and frequency of RORγT+HELIOS or RORγT+HELIOS+ was measured. (h) CD4+FOXP3+ Treg-cells and frequency of CD44+CD62L cells among Treg cells was measured. Numbers inside quadrants indicate percent cells in the respective quadrants.
Extended Data Fig. 3
Extended Data Fig. 3. Treg purification.
Treg-cells were isolated from the mesenteric lymph nodes of Foxp3Cre and Tcf7fl/flFoxp3Cre mice. (a) Schematic representation of magnetic purification of Treg-cells, and FACS analysis showing over 90% purity. (b) Expression changes of the Tcf7 transcripts between TCF-1-deficient and TCF-1-sufficient Treg-cells. The color intensity is proportional to the average gene expression across cells in the indicated Treg cluster. The size of circles is proportional to percentage of cells expressing indicated genes.
Extended Data Fig. 4
Extended Data Fig. 4. Single-cell RNAseq reveals distinct Treg populations.
mRNA expression of select indicated genes projected on the UMAP. Note varied expression of Klf2 but broad and uniform expression of Izumo1r by Treg clusters, high expression of Mif, Vps8, and Ifit1 in the respective Mif (cluster 3), Vps8 (cluster 8), Ifn (cluster 9). Expression of Ccl5 is prominent in the Cd63 (cluster 7), which is likely not Treg-cells.
Extended Data Fig. 5
Extended Data Fig. 5. TCF-1-deficient and sufficient Treg-cells show distinct effector functions.
Treg-cells were isolated from the mesenteric lymph nodes of Foxp3Cre and Tcf7fl/flFoxp3Cre mice. (a) mRNA expression of Maf projected on the UMAP, comparing Treg-cells derived from Foxp3Cre to Tcf7fl/fl Foxp3Cre mice. (b) Violin plots showing expression of Maf in individual Treg clusters. (c) GSEA of MAF downregulated genes and TH17 pathway defined by Stubbington. (d) Kegg IL17 signaling pathway projected on UMAP, comparing TCF-1-sufficient and TCF-1-deficient Treg-cells (e) GSEA analysis for the Kegg IL17 signaling pathway comparing transcriptomes of TCF-1-sufficient and TCF-1-deficient Treg-cells across all cell types. Normalized enrichment scores (NES) are color coded. −log10 (FDR) values are proportional to the circle size. FDR>15% are masked with gray color. (fgh) mRNA expression of Ccr9, Erdr1 and Igfbp4 projected on the UMAP, comparing TCF-1-sufficient and TCF-1-deficient Klf2 cells for the Kegg IL17 pathway.
Extended Data Fig. 6
Extended Data Fig. 6. Treg-cells are activated and polarized during polyposis.
Treg_cells were isolated from the mesenteric lymph nodes of WT and APCΔ486 mice. (a) UMAP projection (left panel) and fraction of cells in each cell type (stack bars; right panel) for APCΔ486 and control B6 Treg-cells. Data are from two replicates. (b) Dot plot showing the expression of Tcf7 across all cell types in ApcΔ486 and control B6 Treg-cells. Color and size of the dots are proportional to the expression level and percent of cells expressing Tcf7 in each indicated cluster. (c) Expression of Socs3, Jund, Lag3 and Maf between APCΔ486 and B6 cells projected on the UMAP. See TableS4 for the full list. The fold change in percent of cells expressing the indicated gene in each cell type is proportional to the circle size. Adjusted-p-values > 0.01 are masked with gray color. (d) Expression changes of the most differentially expressed genes between APCΔ486 and control B6 Treg-cells. See TableS4 for the full list. The fold change in expression intensities is color-coded. (e) RNA velocity vectors overlaid on UMAP for B6 (left) and APCΔ486 (right) Treg-cells.
Figure 1:
Figure 1:. TCF-1 deficiency selectively reprograms Treg-cells without compromising their core signature.
(a) Scatter plot comparing the expression of genes in TCF-1-deficient (Foxp3CreTcf7fl/fl) and TCF-1-sufficient (Foxp3Cre) Treg-cells. Reads Per Kilobase of transcript, per Million mapped reads (RPKM) expression values are average of three biological replicates. Significantly up- or downregulated genes (fold change >1.5 and FDR < 0.001) are shown in red or blue with exact numbers shown at the top or bottom corner, respectively. (b) Significantly enriched Kegg pathways by gene set enrichment analysis (GSEA) induced in transcriptomes of TCF-1-deficient versus sufficient Treg-cells. Normalized enrichment scores of all enriched Kegg pathways (FDR< 25%) are shown. Select pathways are highlighted. See TableS1 for the full list. (c) The expression of all leading-edge genes from four indicated pathways. See TableS1 for the raw expression levels of all genes. (d) GSEA plots showing the enrichment of genes expressed more highly in TCF-1-deficient (Tcf7fl/fl Foxp3Cre) versus TCF-1-sufficient (Foxp3Cre) Treg-cells for genes that are bound by TCF-1 (upper panel) or co-bound by TCF-1 and FOXP3 (lower panel). (e) TCF-1 ChIP-seq tracks in mouse Treg-cells showing the Foxp3, Tgfb1, Stat3, Smad3 and Il2ra gene loci. For simplicity, the input control signal is subtracted from visualized tracks using IGV tools. Detected TCF-1 bound sites against the input control are indicated with blue arrow. Data in d-e are from GSE139960.
Figure 2:
Figure 2:. Cumulative data from FACS analysis shows activation and expansion of Treg-cells and CD4+ Tconv-cells in TCF-1 deficient mice.
Treg-cells and CD4+ Teff-cells from 5.5-month-old Foxp3CreTcf7fl/fl mice and control Foxp3Cre mice were analyzed by FACS. (a) Frequency of CD4+Foxp3+ Treg-cells expressing CD69 (MLN: n = 7, p < 0.01 & SPL: n = 7, p < 0.006), ICOS (MLN: n = 7, p < 0.002 & SPL: n = 7, p < 0.004), PD-1 (MLN: n = 6, p < 0.006 & SPL: n = 6, p < 0.02), and CD44 and CD62L (SPL: n = 5, p < 0.001) (b) Frequencies of Treg-cells (MLN: n = 7, p < 0.005 & SPL: n = 7, p < 0.004), and absolute numbers of Treg-cells (MLN: n = 9, p < 0.003 & SPL: n = 7, p < 0.0002), and their expression of CD25 (MLN: n = 6, p < 0.03 & SPL: n = 6, p < 0.009). (c) Frequencies of conventional CD4+ T-cells expressing CD69 (MLN: n = 6, p < 0.01 & SPL: n = 10, p < 0.01), PD-1 (MLN: n = 7, p < 0.0008 & SPL: n = 7, p < 0.0004), ICOS(MLN: n = 6, p < 0.01 & SPL: n = 6, p < 0.002), and CD44 and CD62L (SPL: n = 5, p < 0.02). (d) The frequencies of HELIOS or HELIOS+FOXP3+RORγT+ Treg-cells, in the spleen (n = 6, p < 0.04 or p < 0.004), MLN (n = 7, p < 0.005), small bowel (n = 6, p < 0.006 or p < 0.01), and colon (n = 6, p < 0.006 or p < 0.04). (a, b, c & d) Data are representative of two or more independent experiments. (e) Representative FACS histograms normalized to mode (left) and bar diagrams of cumulative data for expression of TGFβRI (n = 6, p < 0.0001), TGFβRII (n = 6, p < 0.0008), p-SMAD2/3 (n = 6, p < 0.006), p-S6 (n = 6, p < 0.009), and p-STAT5 (n = 5, p < 0.005) by Treg-cells. Data are representative of three independent experiments. In all experiments n represents biologically independent animals; means ± SEM, two-sided unpaired t-test.
Figure 3:
Figure 3:. Single cell transcriptomics delineates distinct Treg subpopulations in the mesenteric lymph nodes.
(a) Integrated UMAP showing 10 major Treg cell types isolated from the MLNs of mice used in this study. (b) Expression of cell-defining features across all cell types. Color intensity is proportional to the average of gene expression across cells in the indicated clusters. The size of circles is proportional to percentage of cells expressing indicated genes. (c) mRNA expression of select indicated genes projected on the UMAP, focusing on features of the Maf and Ikzf2 Treg clusters. (d) Significantly enriched pathways by Metascape based on top 200 genes upregulated in indicated cell type compared to all other cell types. See TableS2 for the full list. (e) 20 most significantly enriched pathways by Metascape based on genes upregulated in Klf2 or Klf2++ cell types compared directly to Klf2++ or Klf2 cell types, respectively.
Figure 4:
Figure 4:. TCF-1-deficient and sufficient Treg-cells show distinct effector functions.
(a) UMAP projection (left) and fraction of cells in each cell type (stackbars; right panel) for TCF-1-sufficient (Foxp3Cre) and TCF-1-deficient (Foxp3CreTcf7fl/fl) Treg-cells. Data are from two replicates. (b) Expression changes of the most differentially expressed genes between TCF-1-deficient and sufficient Treg-cells. See TableS3 for the full list. The fold change in expression intensities is color-coded. The fold change in percent of cells expressing the indicated gene in each cell type is proportional to the circle size. (c) GSEA analysis for the indicated gene lists comparing transcriptomes of TCF-1-sufficient and TCF-1-deficient Treg-cells across all cell types. Normalized enrichment scores (NES) are color coded. −log10 (FDR) values are proportional to the circle size. FDR>15% are masked with gray color. (d) The UMAP projection of module scores for relative expression of TCF-1 bound genes, (e) related violin plots. (f) The UMAP projection of module scores for relative expression of TCF-1 and FOXP3 co-bound genes, (g) related violin plots. (h) UMAP and extrapolated future state of cells (overlaid arrows) based on RNA velocity for TCF-1-sufficient (Foxp3Cre) and TCF-1-deficient (Foxp3Cre Tcf7fl/fl) Treg-cells. * p < 0.05, *** p < 0.001, **** p<0.0001 by one-sided (e) or two-sided(g) Wilcoxon test.
Figure 5:
Figure 5:. TCF-1-deficient Treg-cells suppress viral antigen specific CD8+ T-cell cytotoxicity and T-cell proliferation.
Foxp3CreTcf7fl/fl and control Foxp3Cre mice at 7-8 weeks of age were compared for their anti-viral T-cell response. (a) Representative FACS histograms and cumulative data of viral antigen specific lysis of VP2121-130 specific pulsed splenocytes after adoptive transfer in the indicated mice. An equal mix of TMEV-VP2121-130 peptide pulsed and unpulsed splenocytes were labelled with different concentrations of CFSE and adoptive transferred to the indicated mice seven days after infection of the mice with TMEV at the peak of response to viral infection. Antigen specific lysis of the splenotyces was measured in the MLN (Foxp3Cre: n = 6, not significant; Foxp3CreTcf7fl/fl: n = 8, p < 0.0001) and spleen (Foxp3Cre: n = 6, not significant; Foxp3CreTcf7fl/fl: n = 8, p < 0.0001), four hours after transfer, and calculated after normalizing for nonspecific death of splenocytes transferred in naïve uninfected mice. Data are representative of two or more independent experiments. To block Treg suppression of CD8 T-cells, we treated a separate set of mice from the day of infection with a small molecule inhibitor of TGFβR1 (LY3200882, Eli Lilly), and compared with vehicle control. (b) Cumulative data of tetramer FACS analysis of VP2121-130 specific CD8+ T-cells in the spleen (Foxp3Cre −TMEV: n = 3, p < 0.003 & p < 0.007; Foxp3Cre +TMEV: n = 4, p < 0.01; Foxp3CreTcf7fl/fl +TMEV: n = 4) of mice at the peak of response to TMEV, on day 7 post viral infection. (c) Representative FACS histograms and cumulative data of Treg inhibition of CD4+ T-cell proliferation. Percent of proliferating cells in the in vitro assays are shown. FACS sorted CD4+CD25 cells from the spleen of C57B/6 mice were labelled with CFSE and incubated alone or with irradiated allogenic BALB/c dendritic cells (DC) and αCD3, with or without equal numbers of purified Treg-cells from the indicated mice. Dilution of CFSE by CD4 gated cells was measure after 3 days. Data are representative of three independent experiments with (Foxp3Cre: n =5 & Foxp3CreTcf7fl/fl: n = 6; p < 0.01). In all experiments n represents biologically independent animals; means ± SEM, two-sided, unpaired t-test.
Figure 6:
Figure 6:. TCF-1-deficient Treg-cells fail to suppress TH1 or TH17 polarization of CD4+ Tconv cells.
Foxp3CreTcf7fl/fl and control Foxp3Cre mice at 5 months of age were assayed for efficiency of CD4 T-cell polarization, using in vitro and in vivo assays. Representative FACS contour-plots (left) and cumulative histogram plots (right) are shown. (a) TH1 polarization in vitro, using total CD4+ splenocytes from the indicated mice. Magnetically purified CD4+ splenocytes containing both Tconv and Treg-cells from the indicated mice were stimulated in vitro under TH1 polarization conditions for 4 days and stained for CD4 and intracellular IFNγ (n = 5, p < 0.0004). (b) TH1 polarization in vitro, with equal numbers of CD4+ Treg-cells and CD4+ Tconv cells of the indicated mice. FACS purified CD62L+CD44CD25CD45.1+CD4+ cells from spleen were labelled with Cell Trace Violet, mixed 1:1 with YFP+CD45.2+CD4+CD25+ spleen Treg-cells, and stimulated under TH1 polarization conditions and assayed by FACS. IFNγ expression gated on CD45.1+ cells (n = 5, p < 0.002). (c) TH17 polarization in vitro, using total CD4+ splenocytes from the indicated mice. CD4+ splenocytes were purified and assayed as in “a”, and were stained for CD4 and intracellular IL-17A (n = 5, p < 0.0003; means ± SEM; two-sided, unpaired t-test). (d) TH17 polarization in vitro, with equal numbers of Treg-cells and CD4+ Tconv cells of the indicated mice. Cells were purified and mixed and analyzed by FACS as in “b”, for expression of intracellular IL-17A (n = 5, p < 0.001). (e) Quantitation of in vivo TH1 response to infection with TMEV. The indicated mice were assessed by FACS on day 7 post infection for expression of IFNγ by MLN (n = 5, p < 0.04) and spleen (n = 11, p < 0.001) derived CD4+ T-cells. (f) The same for CD8+ T-cells (MLN: n = 4, p < 0.04; spleen: Foxp3Cre: n = 6 & Foxp3CreTcf7fl/fl: n = 4; p < 0.003). (g) Quantitation of in vivo TH17 response after IP injection of αCD3. The indicated mice were assessed by FACS after 3 consecutive injections with antibody (see Materials and Methods) for expression of IL-17A by small bowel residing CD4+ T-cells (Foxp3Cre: n = 3, p < 0.0001; Foxp3Cre αCD3: n = 5; p < 0.01; Foxp3CreTcf7fl/fl αCD3: n = 5). Data are representative of two or more independent experiments. In all experiments n represents biological replicates, independent animals; means ± SEM, two-sided, unpaired t-test)
Figure 7.
Figure 7.. TCF-1-deficient Treg-cells promote inflammation and tumor growth in polyposis-prone APCΔ468 mice.
Tumor incidence, tumor aggression, and inflammation were quantified at 5.5 months of age in APCΔ468Foxp3CreTcf7fl/fl mice and compared to control APCΔ468Foxp3Cre mice. (a and b) Polyps and tumors in the excised colon (APCΔ468Foxp3Cre: n = 12 & APCΔ468Foxp3CreTcf7fl/fl: n = 10; p < 0.0001) and small bowel (APCΔ468Foxp3Cre: n = 12 & APCΔ468Foxp3CreTcf7fl/fl: n = 14; not significant) were visualized using a dissection microscope and manually counted. (c and d) Invasive lesions in the colon (n = 6; p < 0.01) and the small bowel (n = 5; p < 0.02). For the cumulative data (a, b, c & d), each symbol represents a value from an individual mouse. Tumor aggression was evaluated by counting lesions that had extensive nuclear β-catenin staining at the submucosal boundary, as determined by IHC. Benign polyps were identified by restricted β-catenin staining at the luminal boundary of the lesions. Each symbol represents a value from an individual mouse. (e and f) Representative IHC of colon and small bowel for nuclear β-catenin; scale bar 200 μm. (g and h) Quantification of Gr1 stained cells in the colon and representative IHC stained sections; scale bar 100 μm. (i and j) Quantification of Gr1 stained cells in the small bowel and representative IHC stained sections. Arrows in “h” and “j” point to Gr1 expressing cells. Each symbol represents counts in one field of vision (FOV) at 200x (g: normal: n = 4, p < 0.009, p < 0.0001, and polyp: n = 4, p < 0.001 & i: normal: n = 4, p < 0.01, p < 0.0001, and polyp: n = 4, p < 0.02). In all experiments n represents biologically independent animals; means ± SEM; two-sided, unpaired t-test.
Figure 8.
Figure 8.. Tcf-7 is downregulated in CRC tumor-infiltrating Treg-cells.
Publicly available scRNA-seq data from 12 CRC patients was analyzed, focusing on the Treg-cells from paired peripheral blood mononuclear cells (PBMC), tumor, and adjacent normal tissues. (a) Violin plots showing the expression of Tcf7 in Treg-cells from peripheral blood (PBMC), adjacent normal and tumor tissues. Data is sourced from GSE108989. Number of Treg-cells in each group is indicated in parenthesis. **** p<0.0001 by one-way ANOVA test. (b-d) GSEA plots showing highly expressed genes in Treg-cells, (b) comparing TH17 cell differentiation genes in tumor infiltrating to healthy tissue infiltrating Treg-cells, (c) comparing TH17 cell differentiation genes in tumor infiltrating to PBMC Treg-cells (d) comparing IL-17 signaling pathway in tumor infiltrating to PBMC Treg-cells, as designated. NES: Normalized enrichment scores.

References

    1. Fontenot JD, Gavin MA & Rudensky AY Foxp3 programs the development and function of CD4+CD25+ regulatory T cells. Nat Immunol 4, 330–336 (2003). - PubMed
    1. Hori S, Nomura T & Sakaguchi S Control of regulatory T cell development by the transcription factor Foxp3. Science 299, 1057–1061 (2003). - PubMed
    1. Khattri R, Cox T, Yasayko SA & Ramsdell F An essential role for Scurfin in CD4+CD25+ T regulatory cells. Nat Immunol 4, 337–342 (2003). - PubMed
    1. Benoist C & Mathis D Treg cells, life history, and diversity. Cold Spring Harb Perspect Biol 4, a007021 (2012). - PMC - PubMed
    1. Ohnmacht C et al.MUCOSAL IMMUNOLOGY. The microbiota regulates type 2 immunity through RORgammat(+) T cells. Science 349, 989–993 (2015). - PubMed

Publication types

MeSH terms

Substances