. 2021 Jul 27:11:680642.
doi: 10.3389/fonc.2021.680642. eCollection 2021.

Long Non-Coding RNA CCAT2 Promotes the Development of Esophageal Squamous Cell Carcinoma by Inhibiting miR-200b to Upregulate the IGF2BP2/TK1 Axis

Affiliations

Long Non-Coding RNA CCAT2 Promotes the Development of Esophageal Squamous Cell Carcinoma by Inhibiting miR-200b to Upregulate the IGF2BP2/TK1 Axis

Xiaodan Wu et al. Front Oncol. .

Abstract

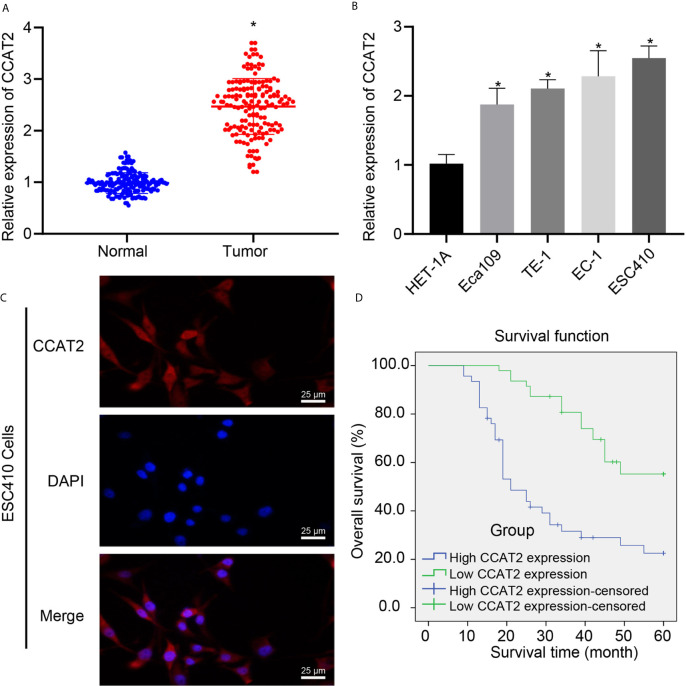
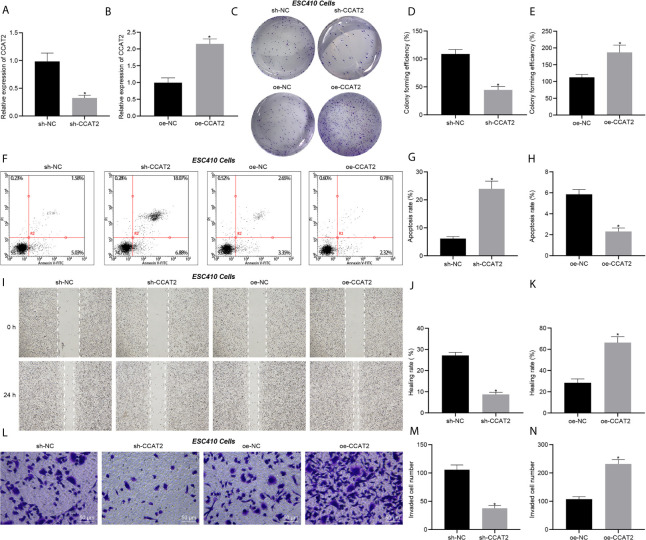
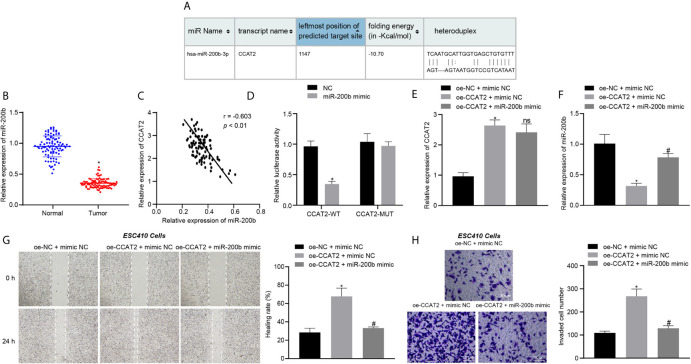
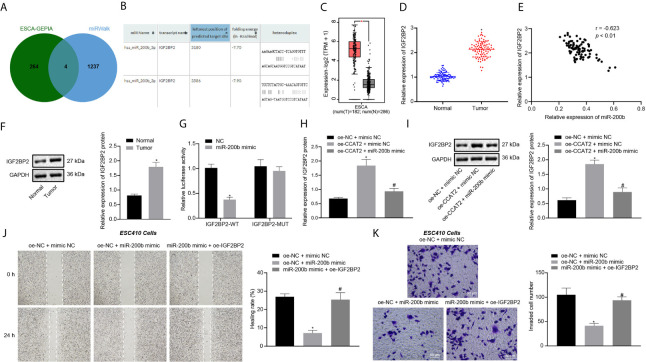
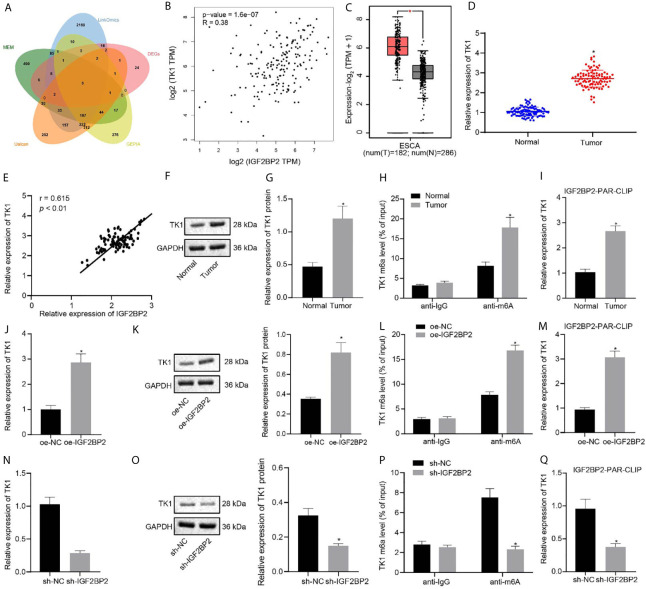
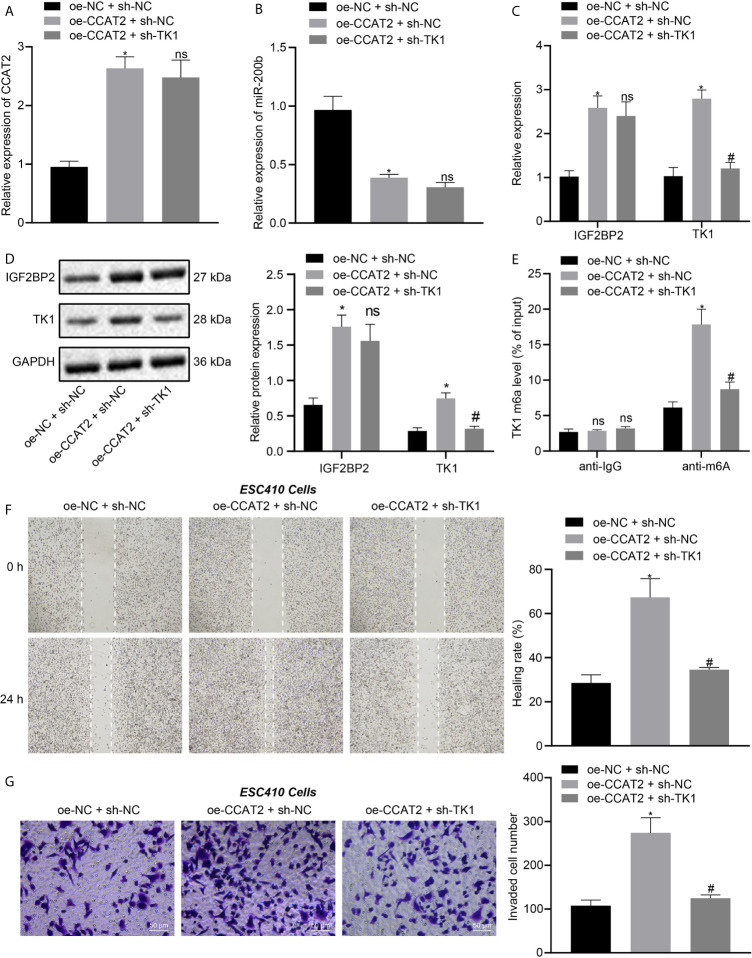
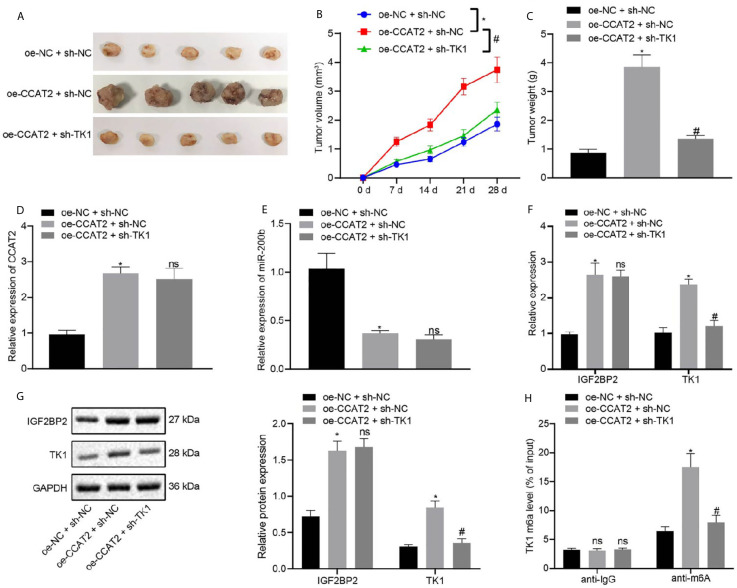
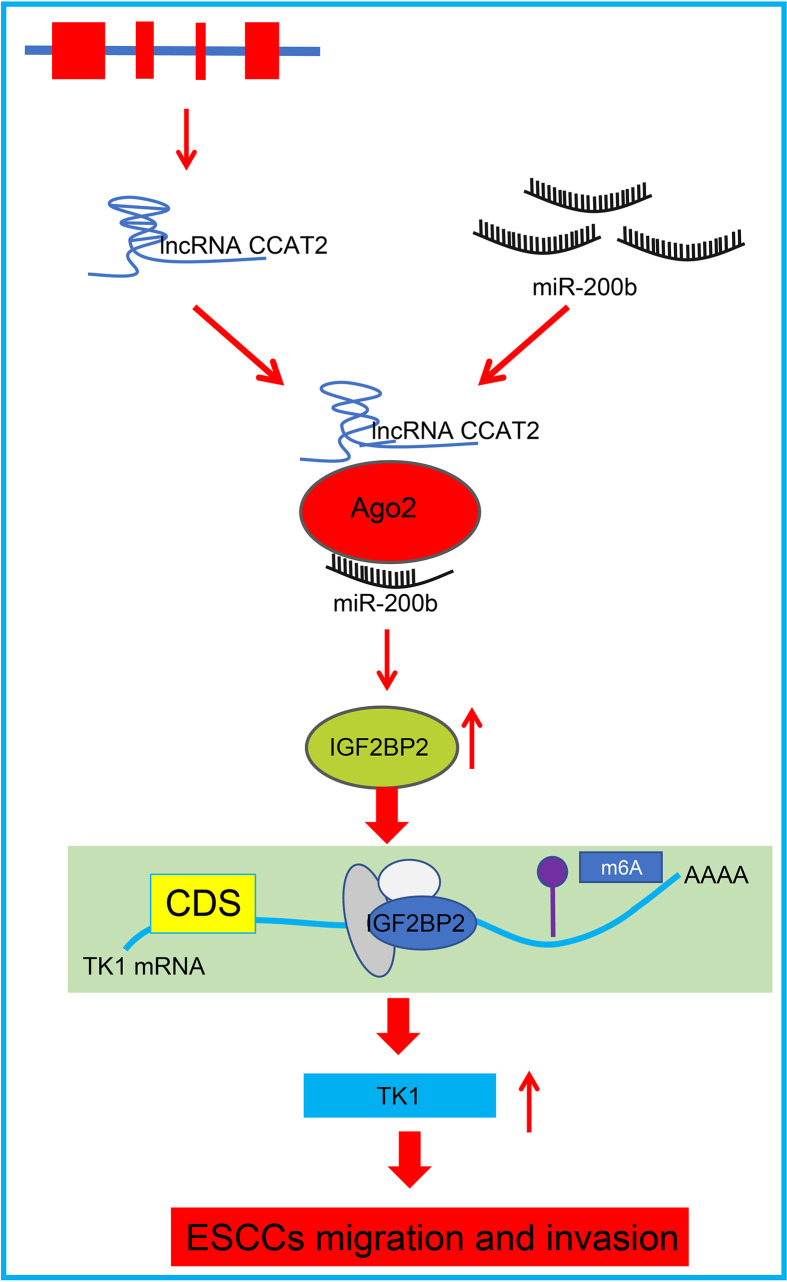
Long non-coding RNAs (lncRNAs) have been shown to play important roles in human cancers, including esophageal squamous cell carcinoma (ESCC). In the current study, we identified CCAT2 as a relevant lncRNA and investigated its role in the progression of ESCC. RT-qPCR was adopted to detect CCAT2 expression in collected clinical samples, ESCC cell lines, and a normal cell line. We tested the correlation between CCAT2 expression and the prognosis of ESCC. RT-qPCR or immunoblotting was adopted to detect the expression of relevant factors in ESCC tissues or cells. Cell proliferation, apoptosis, migration, and invasion were examined by colony formation assay, flow cytometry, scratch assay, and Transwell assay, respectively, while subcutaneous tumorigenesis in nude mice was adopted to examine the role of CCAT2 in tumorigenesis of ESCC cells in vivo. Bioinformatics analysis, dual luciferase reporter assay, and RIP were conducted for the target relationship profiling. Me-RIP was adopted to detect m6A modification level of TK1 in ESCC tissues or cells. Upregulated CCAT2, IGF2BP2, and TK1 expression and inhibited miR-200b expression were observed in ESCC cells and tissues. CCAT2 bound to miR-200b and reduced its expression, leading to upregulated IGF2BP2 expression. IGF2BP2 improved TK1 mRNA stability to enhance its expression by recognizing its m6A modification. CCAT2 promoted the migration and invasion of ESCC cells in vitro, and tumorigenesis in vivo by upregulating TK1 expression, while overexpression of miR-200b reversed these effects of CCAT2. Overall, this study suggests that CCAT2 competitively binds to miR-200b to alleviate its inhibitory effects on IGF2BP2 expression, resulting in elevated TK1 expression, and an ensuing promotion of the development of ESCC.

Keywords: N6-methyladenosine; competing endogenous RNA; esophageal squamous cell carcinoma; insulin-like growth factor 2 mRNA-binding protein 2; long non-coding RNA CCAT2; microRNA-200b; thymidine kinase 1.


Conflict of interest statement

The authors declare that the research was conducted in the absence of any commercial or financial relationships that could be construed as a potential conflict of interest.

Figures

Figure 1
Figure 1
The expression of CCAT2 was upregulated in ESCC tissues and cells, and this upregulation indicated poor prognosis of ESCC patients. (A) RT-qPCR detection of CCAT2 expression in ESCC tissues and normal adjacent tissues. (B) RT-qPCR detection of CCAT2 expression in HET-1A human normal esophageal epithelial cells and four ESCC cell lines Eca109, TE-1, EC-1, and ESC410. (C) FISH analysis of subcellular localization of CCAT2. (D) Kaplan-Meier survival analysis (log-rank test) based on CCAT2 expression (n = 93). *p < 0.05 vs. normal adjacent tissues or HET-1A cell line. Data were shown as mean ± standard deviation of three technical replicates. Data between cancer tissues and normal adjacent tissues were compared by paired t-test. Data among multiple groups were compared by one-way ANOVA with Tukey’s post hoc test. Kaplan-Meier was adopted to calculate the survival rate of patients, and Log-rank test was used for univariate analysis.
Figure 2
Figure 2
CCAT2 augments the proliferation, migration and invasion of ESCC cells and impedes their apoptosis in vitro. (A) RT-qPCR detection of CCAT2 expression in ESC410 cells treated with sh-NC or sh-CCAT2. (B) RT-qPCR detection of CCAT2 expression in ESC410 cells treated with oe-NC or oe-CCAT2. (C–E) Colony formation assay detection of ESC410 cell proliferation after overexpressing or silencing CCAT2. (F–H) Flow cytometric analysis of ESC410 cell apoptosis after overexpressing or silencing CCAT2. (I–K) Scratch assay detection of ESC410 cell migration after overexpressing or silencing CCAT2. (L–N) Transwell assay detection of ESC410 cell invasion after overexpressing or silencing CCAT2, scale bar = 50 μm. *p < 0.05 vs. oe-NC-treated cells or sh-NC-treated cells. Data were shown as mean ± standard deviation of three technical replicates. Data between two groups were compared by unpaired t-test.
Figure 3
Figure 3
CCAT2 binds to miR-200b and reduces its expression, thus triggering the proliferation, migration and invasion of ESCC cells. (A) The binding site between CCAT2 and miR-200b predicted by the RNA22 database. (B) RT-qPCR detection of miR-200b expression in 93 cases of ESCC tissues and normal adjacent tissues. (C) Correlation analysis of CCAT2 expression and miR-200b expression in 93 cases of ESCC tissues by Pearson’s correlation analysis. (D) Binding of CCAT2 to miR-200b confirmed by dual luciferase report assay. (E) RT-qPCR detection of the expression of CCAT2 in ESC410 cells after overexpression of CCAT2 and miR-200b. (F) RT-qPCR detection of the expression of miR-200b in ESC410 cells after overexpression of CCAT2 and miR-200b. (G) Scratch assay detection of ESC410 cell migration after overexpression of CCAT2 and miR-200b. (H) Transwell assay detection of ESC410 cell invasion after overexpression of CCAT2 and miR-200b. Scale bar = 50 μm. *p < 0.05 vs. oe-NC + mimic NC-treated cells. # p < 0.05 vs. oe-CCAT2 + mimic NC-treated cells. Data were shown as mean ± standard deviation of three technical replicates. Data between cancer tissues and normal adjacent tissues were compared by paired t-test. Data between remaining two groups were compared by unpaired t-test. Data among multiple groups were compared by one-way ANOVA with Tukey’s post hoc test.
Figure 4
Figure 4
CCAT2 upregulates the expression of IGF2BP2 by adsorbing miR-200b to promote the migration and invasion of ESCC cells. (A) Venn diagram of differentially expressed genes from GEPIA analysis and downstream genes of miR-200b obtained by miRWalk, and the intersection genes are CXCL8, LAMC2, IGF2BP2, and EPHB2. (B) The binding site between miR-200b and IGF2BP2 predicted by the RNA22 database. (C) The box diagram of IGF2BP2 expression through GEPIA analysis; the left red box indicates the expression in ESCC samples, and the right gray box indicates the expression in normal samples. (D) RT-qPCR detection of mRNA expression of IGF2BP2 in 93 cases of ESCC tissues and normal adjacent tissues. (E) Correlation analysis of IGF2BP2 mRNA expression and miR-200b expression in 93 cases of ESCC tissues by Pearson’s correlation analysis. (F) Immunoblotting analysis of IGF2BP2 protein in 93 cases of ESCC tissues and normal adjacent tissues. (G) Binding of miR-200b to IGF2BP2 confirmed by dual luciferase report assay. (H, I) RT-qPCR and immunoblotting detection of the mRNA and protein expression of IGF2BP2 in ESC410 cells after overexpression of CCAT2 and miR-200b. (J) Scratch assay detection of ESC410 cell migration ability in each group. (K) Transwell assay detection of ESC410 cell invasion ability in each group, scale bar = 50 μm. *p < 0.05 vs. normal adjacent tissues, HET-1A cell line, oe-NC-treated cells, sh-NC-treated cells, or oe-NC + mimic NC-treated cells. # p < 0.05 vs. oe-CCAT2 + mimic NC-treated cells or oe-NC + miR-200b mimic-treated cells. Data were shown as mean ± standard deviation of three technical replicates. Data between cancer tissues and normal adjacent tissues were compared by paired t-test. Data between remaining two groups were compared by unpaired t-test. Data among multiple groups were compared by one-way ANOVA with Tukey’s post hoc test.
Figure 5
Figure 5
IGF2BP2 maintains TK1 mRNA stability to promote TK1 expression by recognizing the m6A modification of TK1 mRNA. (A) Venn diagram of differentially expressed genes and related genes of IGF2BP2 obtained from Ualcan, LinkedOmics, GEPIA, and MEM, and the six intersection genes are FSCN1, ECT2, TPX2, MCM2, FANCI, and TK1. (B) Correlation map of IGF2BP2 expression and TK1 expression obtained by GEPIA analysis (p = 1.6e-07). (C) The box diagram of TK1 expression through GEPIA analysis; the left red box indicates the expression in ESCC samples, and the right gray box indicates the expression in normal samples. (D) RT-qPCR detection of mRNA expression of TK1 in 93 cases of ESCC tissues and normal adjacent tissues. (E) Correlation analysis of TK1 mRNA expression and IGF2BP2 mRNA expression in 93 cases of ESCC tissues by Pearson’s correlation analysis. (F, G). Immunoblotting detection of TK1 protein in 93 cases of ESCC tissues and normal adjacent tissues. (H) Me-RIP detection of the m6A modification level of TK1 in ESCC tissues and normal adjacent tissues. (I) PAR-CLIP detection of the binding between IGF2BP2 and TK1 mRNA in ESCC tissues and normal adjacent tissues. (J, K). RT-qPCR and immunoblotting detection of the mRNA and protein expressions of TK1 in oe-NC-treated and oe-IGF2BP2-treated cells. (L) Me-RIP detection of the m6A modification level of TK1 in oe-NC-treated and oe-IGF2BP2-treated cells. (M) PAR-CLIP detection of the binding between IGF2BP2 and TK1 mRNA in ESC410 cells of each group. (N, O) RT-qPCR and immunoblotting detection of the mRNA and protein expressions of TK1 in sh-NC-treated and sh-IGF2BP2-treated cells. (P) Me-RIP detection of the m6A modification level of TK1 in sh-NC-treated and sh-IGF2BP2-treated cells. (Q) PAR-CLIP detection of the binding between IGF2BP2 and TK1 mRNA in sh-NC-treated and sh-IGF2BP2-treated cells. *p < 0.05 vs. normal adjacent tissues, oe-NC-treated cells, or sh-NC-treated cells. Data were shown as mean ± standard deviation of three technical replicates. Data between cancer tissues and normal adjacent tissues were compared by paired t-test. Data between the remaining two groups were compared by unpaired t-test.
Figure 6
Figure 6
CCAT2 upregulates TK1 to promote the migration and invasion of ESCC cells in vitro. (A, B). RT-qPCR detection of the expression of CCAT2 and miR-200b in oe-NC + sh-NC-, oe-CCAT2 + sh-NC-, and oe-CCAT2 + sh-TK1-treated ESC410 cells. (C, D). RT-qPCR and immunoblotting detection of the mRNA and protein expression of IGF2BP2 and TK1 in ESC410 cells of each group. (E) Me-RIP detection of m6A modification level of TK1 in ESC410 cells of each group. (F) Scratch assay detection of the migration ability of ESC410 cells in each group. (G) Transwell assay detection of the invasion ability of ESC410 cells in each group, scale bar = 50 μm. *p < 0.05 vs. oe-NC + sh-NC-treated cells; # p < 0.05 vs. oe-CCAT2 + sh-NC-treated cells; ns indicates no significant difference. Data were shown as mean ± standard deviation of three technical replicates. Data between two groups were compared by unpaired t-test. Data among multiple groups were compared by one-way ANOVA with Tukey’s post hoc test.
Figure 7
Figure 7
CCAT2 upregulates the expression of TK1 to promote the tumorigenesis of ESCC cells in nude mice. (A) Representative images showing xenografts in nude mice of each group. (B) Changes in the volume of formed tumors within four weeks of implanting ESC410 cells transfected with different plasmids in each group. (C) The weight of formed tumors within four weeks of implanting ESC410 cells in each group. (D, E) RT-qPCR detection of the expression of CCAT2 and miR-200b in cancer tissues of oe-NC + sh-NC-treated mice, oe-CCAT2 + sh-NC-treated mice, and oe-CCAT2 + sh-TK1-treated mice. (F, G) RT-qPCR and immunoblotting detection of mRNA and protein expressions of IGF2BP2 and TK1 in cancer tissues of each group. (H) Me-RIP detection of the m6A modification level of TK1 in cancer tissues of each group. *p < 0.05 vs. oe-NC + sh-NC-treated mice. # p < 0.05 vs. oe-CCAT2 + sh-NC-treated mice. Data were shown as mean ± standard deviation of three technical replicates. Data among multiple groups were compared by one-way ANOVA with Tukey’s post hoc test. Comparison among groups at different time points was performed using repeated measures ANOVA with Bonferroni’s post hoc test. ns means no significant difference.
Figure 8
Figure 8
Schematic diagram of the mechanism by which CCAT2 affects development and progression of ESCC. CCAT2 binds with miR-200b to reduce its expression, and consequently enhances the expression of the miR-200b target IGF2BP2, which leads to upregulated TK1 expression and promotion of migration and invasion of ESCC cells in vitro.

Similar articles

Cited by

References

    1. Global Burden of Disease Cancer C. Fitzmaurice C, Dicker D, Pain A, Hamavid H, Moradi-Lakeh M, et al. . The Global Burden of Cancer 2013. JAMA Oncol (2015) 1(4):505–27. 10.1001/jamaoncol.2015.0735 - DOI - PMC - PubMed
    1. Alsop BR, Sharma P. Esophageal Cancer. Gastroenterol Clin N Am (2016) 45(3):399–412. 10.1016/j.gtc.2016.04.001 - DOI - PubMed
    1. Domper Arnal MJ, Ferrandez Arenas A, Lanas Arbeloa A. Esophageal Cancer: Risk Factors, Screening and Endoscopic Treatment in Western and Eastern Countries. World J Gastroenterol (2015) 21(26):7933–43. 10.3748/wjg.v21.i26.7933 - DOI - PMC - PubMed
    1. Huang FL, Yu SJ. Esophageal Cancer: Risk Factors, Genetic Association, and Treatment. Asian J Surg (2018) 41(3):210–5. 10.1016/j.asjsur.2016.10.005 - DOI - PubMed
    1. Bollschweiler E, Plum P, Monig SP, Holscher AH. Current and Future Treatment Options for Esophageal Cancer in the Elderly. Expert Opin Pharmacother (2017) 18(10):1001–10. 10.1080/14656566.2017.1334764 - DOI - PubMed