

A Novel Ferroptosis-Related Gene Model for Overall Survival Predictions of Bladder Urothelial Carcinoma Patients
- PMID: 34386423
- PMCID: PMC8353278
- DOI: 10.3389/fonc.2021.698856
A Novel Ferroptosis-Related Gene Model for Overall Survival Predictions of Bladder Urothelial Carcinoma Patients
Abstract
Introduction: Bladder cancer is the most common urinary tract malignancy, and 90% of bladder tumors are urothelial cell carcinomas. Ferroptosis is a new form of cell death discovered in recent years, which is an iron-dependent form of cell death characterized by the lethal intracellular accumulation of lipid-based reactive oxygen species. Ferroptosis is considered to be a double-edged sword for cancer and cancer therapy.
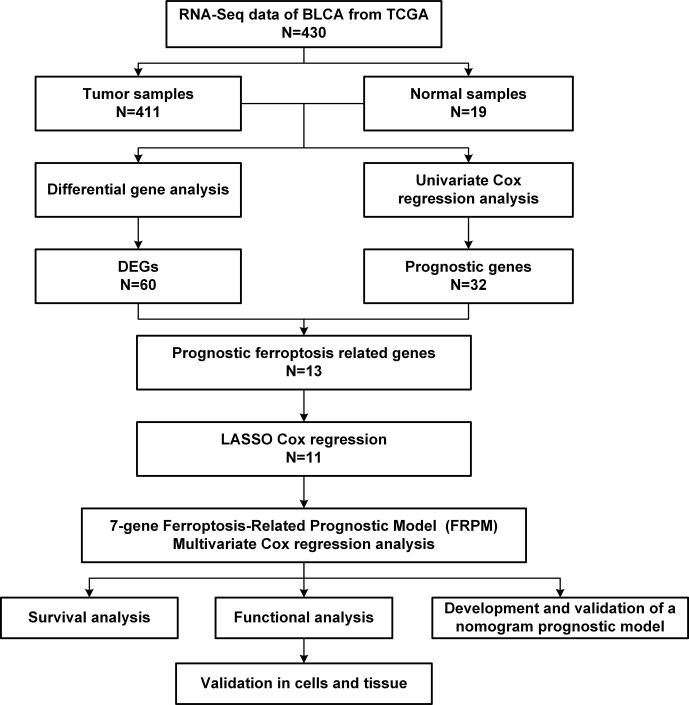
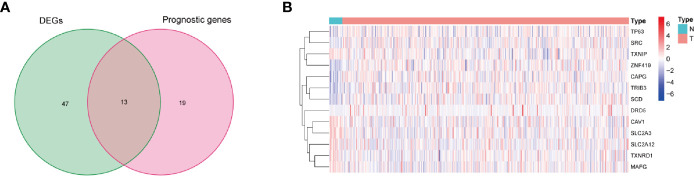
Materials and methods: In the current study, expression profiles of bladder cancer (BLCA) specimens were obtained from The Cancer Genome Atlas (TCGA) RNA-Seq database. Ferroptosis-related genes were downloaded from the FerrDb website. The ferroptosis-related differentially expressed genes (DEGs) which were related to overall survival (OS) were first identified. The least absolute shrinkage and selection operator (LASSO) and multivariate Cox regression methods were utilized to develop a ferroptosis-related prognostic model (FRPM). In addition, a nomogram model based on FRPM and clinicopathological features was successfully constructed and validated. In addition, gene ontology (GO), Kyoto Encyclopedia of Genes and Genomes (KEGG), and single-sample gene set enrichment analysis (ssGSEA) methods were utilized in this study in order to compare the DEGs between the high-risk and low-risk groups. This study also adopted RT-qPCR, CCK-8 assay, and scratch assay methods to perform experimental verification processes.
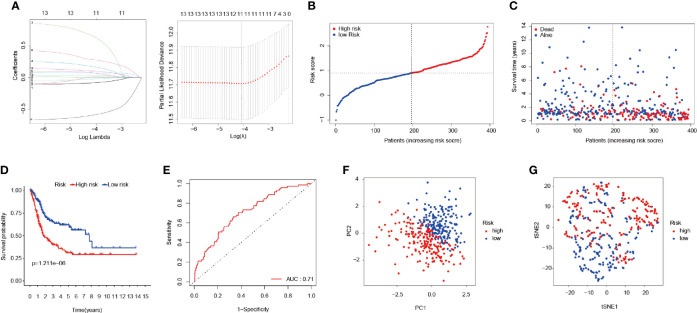
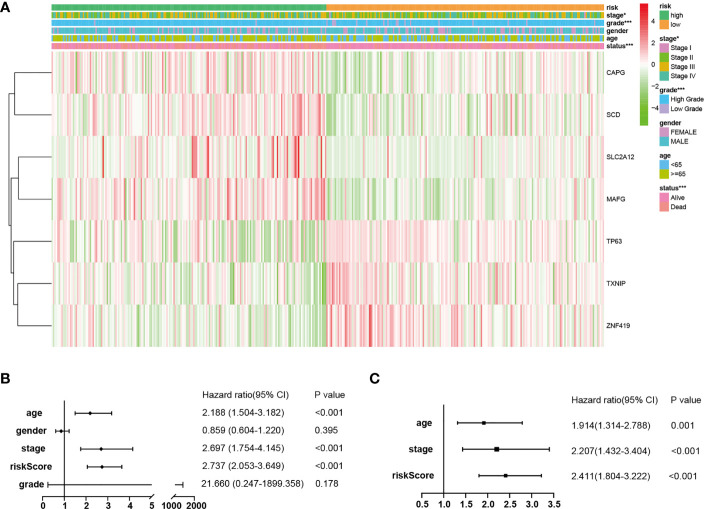
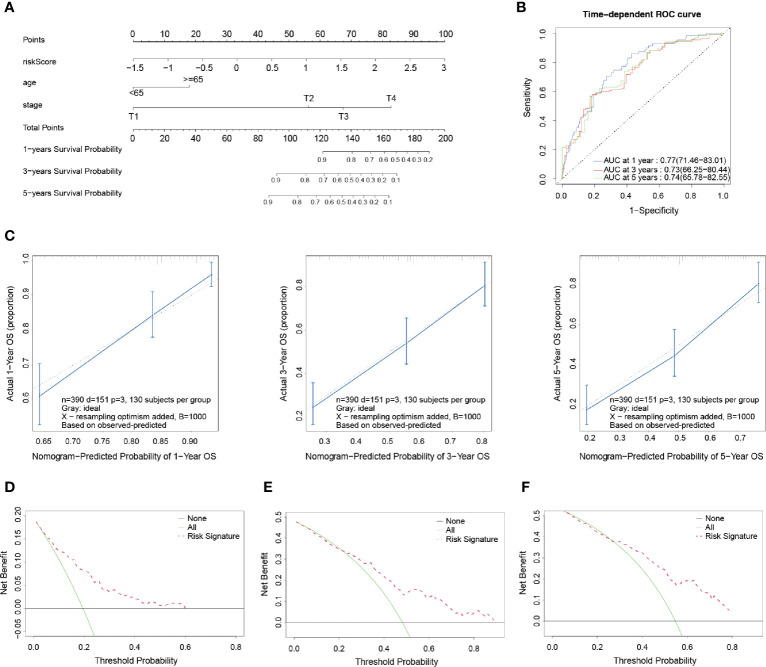
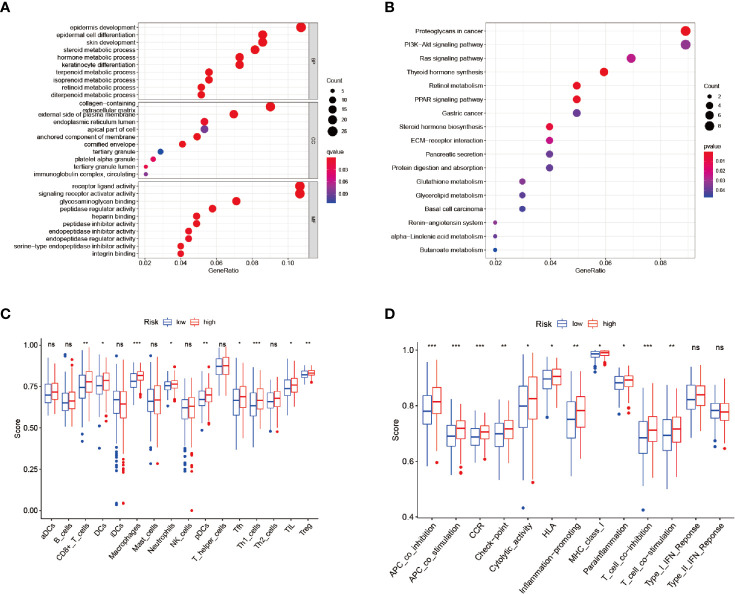
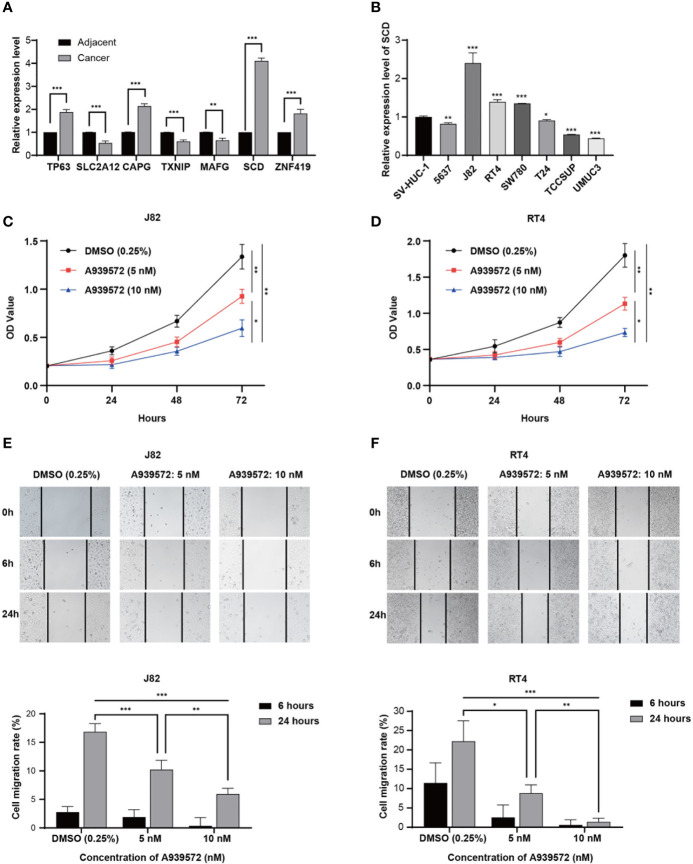
Results and discussion: A 7-gene FRPM was constructed in this research investigation in order to stratify the patients into two groups according to their risk scores. The results of this study's survival analysis and time-dependent receiver operating characteristic (ROC) analysis demonstrated that the model had achieved a stable performance level. This multivariate Cox regression results revealed that the FRPM was an independent prognostic predictor for the OS of BLCA patients and the results were displayed using a nomogram. In addition, the ROC analysis, concordance index (C-index), calibration plots, and decision curve analysis (DCA) curves further indicated that this study's nomogram method enabled valuable prediction results. The functional enrichment analysis results suggested that the DEGs between the high- and low-risk groups played vital roles in the progression of the ferroptosis. Also, the ssGSEA indicated that the immune status was different between the two groups. This study found that the RT-qPCR results had confirmed the differential expressions of DEGs in the tissue samples, and the CCK-8 assay and scratch assay results confirmed the promoting effects of SCD on the proliferation and migration of tumor cells.
Conclusions: This study defined a novel prognostic model of seven ferroptosis-related genes, which proved to be independently associated with the OS of BLCA. A nomogram method was developed for the purpose of providing further insight into the accurate predictions of BLCA prognoses.
Keywords: TCGA; bladder neoplasms; ferroptosis; nomogram; prognostic model.
Copyright © 2021 Zhang, Zhang, Yu, Zhang, Zhang, Zeng, Wang and Hu.
Conflict of interest statement
The authors declare that the research was conducted in the absence of any commercial or financial relationships that could be construed as a potential conflict of interest.
Figures
References
-
- Fleshner NE, Herr HW, Stewart AK, Murphy GP, Mettlin C, Menck HR. The National Cancer Data Base Report on Bladder Carcinoma. The American College of Surgeons Commission on Cancer and the American Cancer Societ. Cancer-Am Cancer Soc (1996) 78(7):1505–13. 10.1002/(sici)1097-0142(19961001)78:7<1505::aid-cncr19>3.0.co;2-3 - DOI - PubMed
LinkOut - more resources
Full Text Sources