

Dynamic Changes in Community Deprivation of Access to Urban Green Spaces by Multiple Transport Modes
- PMID: 34386469
- PMCID: PMC8353154
- DOI: 10.3389/fpubh.2021.615432
Dynamic Changes in Community Deprivation of Access to Urban Green Spaces by Multiple Transport Modes
Abstract
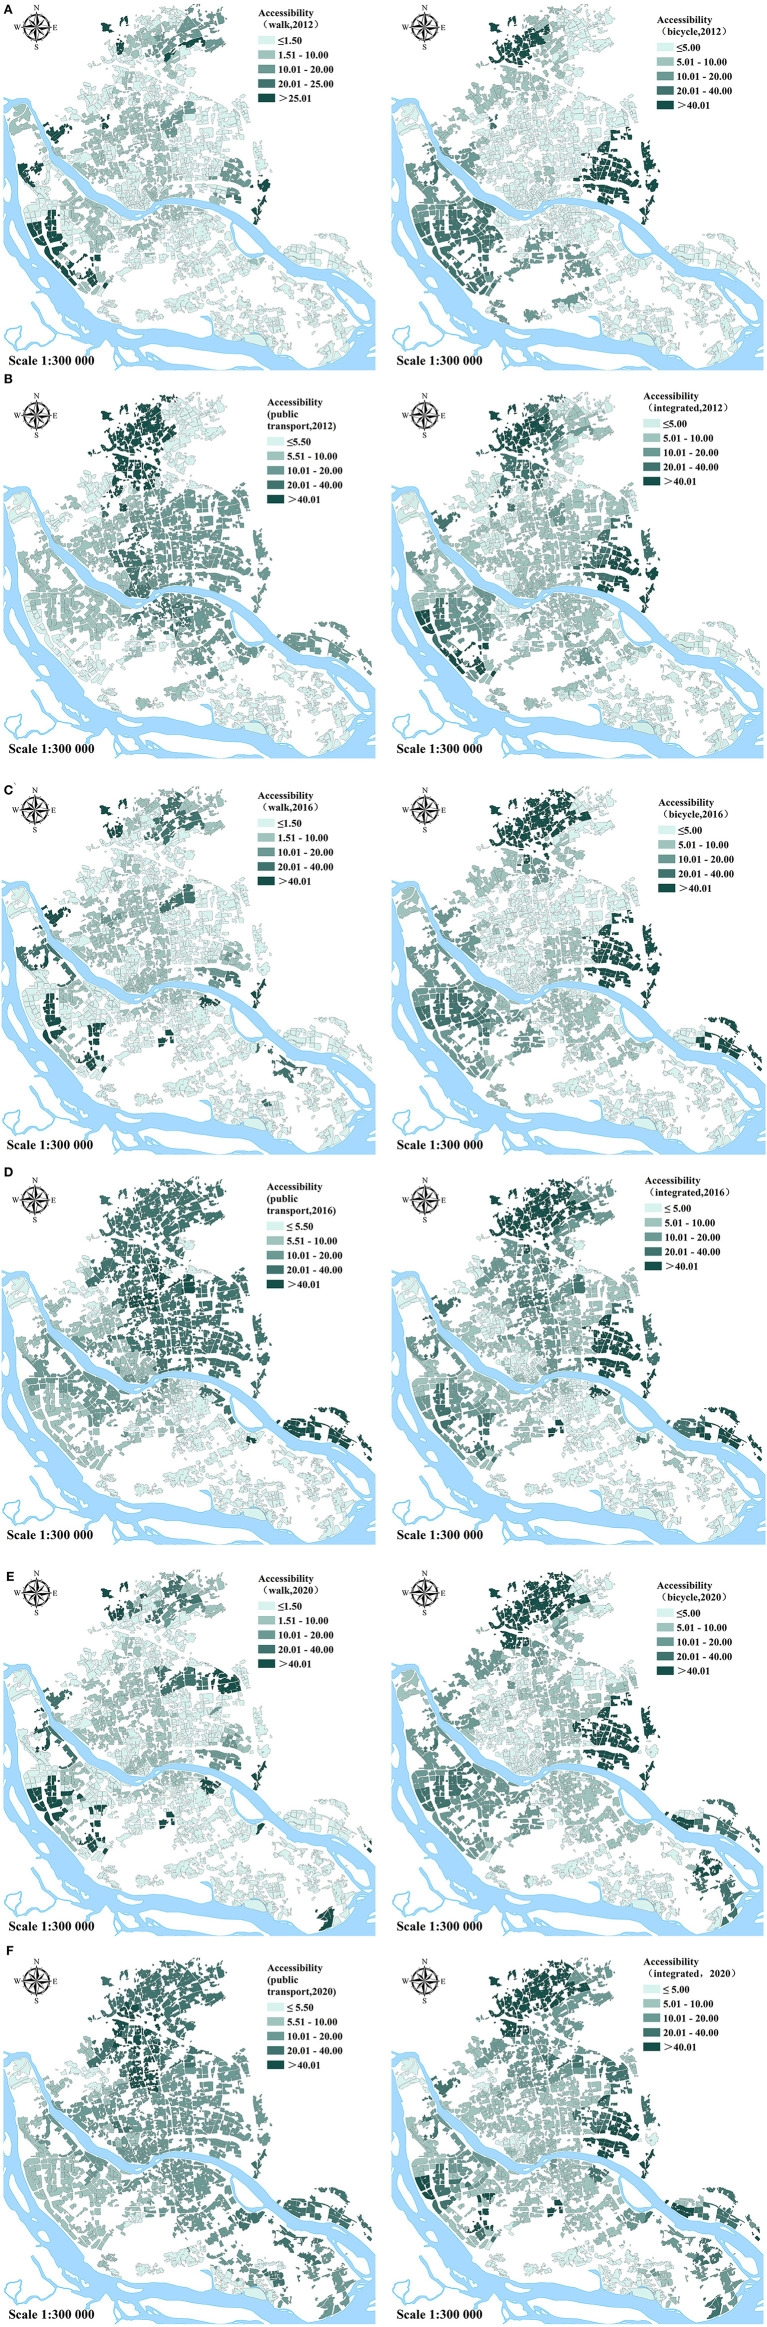
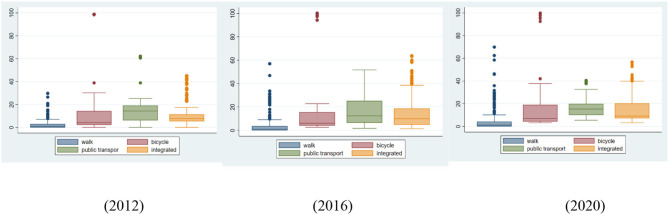
Urban green spaces (UGSs) improve the quality of life of urban inhabitants. With the acceleration of urbanization and changes in traffic networks, it remains unclear whether changes in the distribution of UGSs can satisfy the needs of all inhabitants and offer equal services to inhabitants from different socioeconomic backgrounds. This study addresses this issue by analyzing dynamic changes in UGS accessibility in 2012, 2016, and 2020 for inhabitants of the central urban area of Fuzhou in China at the community level. The study introduces multiple transportation modes for an accessibility estimation based on a framework using the two-step floating catchment area method and examines the dynamic changes in community deprivation of UGS accessibility using Kernel regularized least squares, a machine learning algorithm. The results demonstrate that spatial disparities of UGS accessibility exist among the multi-transport modes and vary with time. Communities with high accessibility to UGSs by walking are scattered around the urban area; for accessibility by cycling, the high accessibility regions expand and surround the regions with low accessibility in the core urban areas, forming a semi-enclosed spatial pattern. However, the core urban spatial orientation of UGS accessibility by public transit demonstrates a reverse trend to the above two modes. The spatial pattern of UGS accessibility also varies over time, and the growth rate of accessibility slightly declined during the study period. Furthermore, the increase in UGS accessibility tended to slow from 2016-2020 compared with 2012-2016, and the trend toward equality was also erratic. The degree of deprivation for communities first weakened and was then aggravated, corresponding to the slowdown in the growth rate of accessibility, leading to the persistence existence of social inequality. Moreover, significant deprivation mainly exists among less educated people or those using the cycling and integrated travel modes. Although public transport is developing, deprived communities, such as communities with large proportion of older people, have experienced a decline in access to UGSs by public transport. Based on these findings, the study proposes a policy framework for the balanced distribution of UGSs as part of urbanization.
Keywords: deprivation; distribution disparity; dynamic changes; multiple transportation modes; urban green spaces.
Copyright © 2021 Cheng, Liao and Zhu.
Conflict of interest statement
The authors declare that the research was conducted in the absence of any commercial or financial relationships that could be construed as a potential conflict of interest.
Figures


Similar articles
-
Measuring spatial accessibility and supply-demand deviation of urban green space: A mobile phone signaling data perspective.Front Public Health. 2022 Oct 21;10:1029551. doi: 10.3389/fpubh.2022.1029551. eCollection 2022. Front Public Health. 2022. PMID: 36339177 Free PMC article.
-
Exploring the provision, efficiency and improvements of urban green spaces on accessibility at the metropolitan scale.J Environ Manage. 2024 Feb 14;352:120118. doi: 10.1016/j.jenvman.2024.120118. Epub 2024 Jan 23. J Environ Manage. 2024. PMID: 38266526
-
Community-Level Urban Green Space Equity Evaluation Based on Spatial Design Network Analysis (sDNA): A Case Study of Central Wuhan, China.Int J Environ Res Public Health. 2021 Sep 28;18(19):10174. doi: 10.3390/ijerph181910174. Int J Environ Res Public Health. 2021. PMID: 34639480 Free PMC article.
-
A systematic review of urban green space research over the last 30 years: A bibliometric analysis.Heliyon. 2023 Feb 1;9(2):e13406. doi: 10.1016/j.heliyon.2023.e13406. eCollection 2023 Feb. Heliyon. 2023. PMID: 36816272 Free PMC article. Review.
-
Relationship between Urban Green Spaces and Cancer: A Scoping Review.Int J Environ Res Public Health. 2021 Feb 11;18(4):1751. doi: 10.3390/ijerph18041751. Int J Environ Res Public Health. 2021. PMID: 33670207 Free PMC article.
Cited by
-
Measuring spatial accessibility and supply-demand deviation of urban green space: A mobile phone signaling data perspective.Front Public Health. 2022 Oct 21;10:1029551. doi: 10.3389/fpubh.2022.1029551. eCollection 2022. Front Public Health. 2022. PMID: 36339177 Free PMC article.
References
-
- Ministry of Housing and Urban-Rural Construction of the People's Republic of China . The Standard of Urban Green Space Classification: CJJ/T 85-−2017. Beijing: China Architecture and Building Press; (2017).
-
- Qiu GY, Zou ZD, Li XZ, Li HY, Guo QP, Yan CH, et al. . Experimental studies on the effects of green space and evapotranspiration on urban heat island in a subtropical megacity in China. Habitat Int. (2017) 68:30–42. 10.1016/j.habitatint.2017.07.009 - DOI
-
- Elmqvist T, Fragkias M, Goodness J, Güneralp B, Marcotullio PJ, Mcdonald RI, et al. . Urbanization, Biodiversity and Ecosystem Services: Challenges and Opportunities. Dordrecht: Springer; (2013).
MeSH terms
LinkOut - more resources
Full Text Sources