Review
. 2021 Jul 27:9:657976.
doi: 10.3389/fpubh.2021.657976. eCollection 2021.

Study Designs to Assess Real-World Interventions to Prevent COVID-19

Affiliations
Review

Study Designs to Assess Real-World Interventions to Prevent COVID-19

Jean C Digitale et al. Front Public Health. .

Abstract

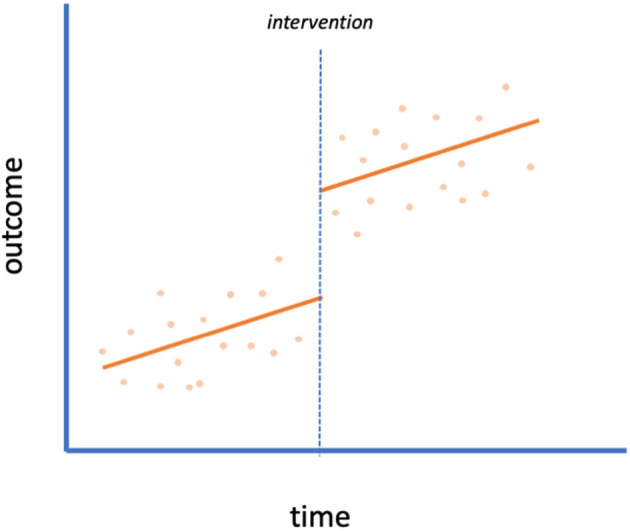
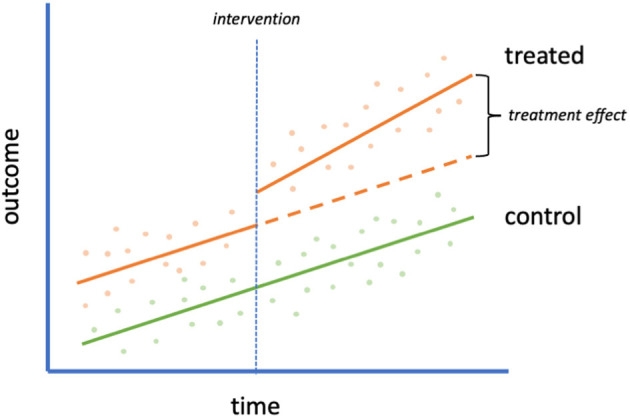
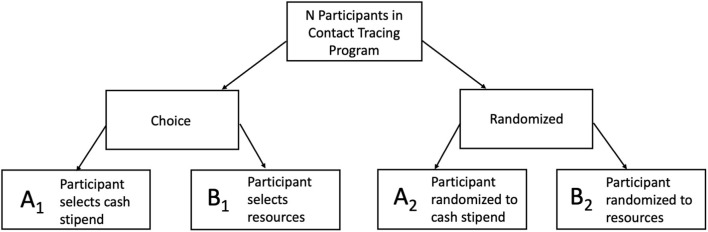
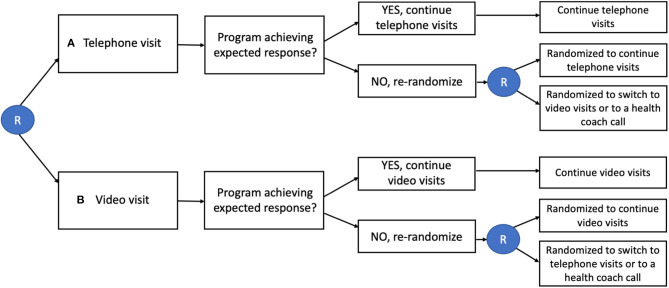
Background: In the face of the novel virus SARS-CoV-2, scientists and the public are eager for evidence about what measures are effective at slowing its spread and preventing morbidity and mortality. Other than mathematical modeling, studies thus far evaluating public health and behavioral interventions at scale have largely been observational and ecologic, focusing on aggregate summaries. Conclusions from these studies are susceptible to bias from threats to validity such as unmeasured confounding, concurrent policy changes, and trends over time. We offer recommendations on how to strengthen frequently applied study designs which have been used to understand the impact of interventions to reduce the spread of COVID-19, and suggest implementation-focused, pragmatic designs that, moving forward, could be used to build a robust evidence base for public health practice. Methods: We conducted a literature search of studies that evaluated the effectiveness of non-pharmaceutical interventions and policies to reduce spread, morbidity, and mortality of COVID-19. Our targeted review of the literature aimed to explore strengths and weaknesses of implemented studies, provide recommendations for improvement, and explore alternative real-world study design methods to enhance evidence-based decision-making. Results:Study designs such as pre/post, interrupted time series, and difference-in-differences have been used to evaluate policy effects at the state or country level of a range of interventions, such as shelter-in-place, face mask mandates, and school closures. Key challenges with these designs include the difficulty of disentangling the effects of contemporaneous changes in policy and correctly modeling infectious disease dynamics. Pragmatic study designs such as the SMART (Sequential, Multiple-Assignment Randomized Trial), stepped wedge, and preference designs could be used to evaluate community re-openings such as schools, and other policy changes. Conclusions: As the epidemic progresses, we need to move from post-hoc analyses of available data (appropriate for the beginning of the pandemic) to proactive evaluation to ensure the most rigorous approaches possible to evaluate the impact of COVID-19 prevention interventions. Pragmatic study designs, while requiring initial planning and community buy-in, could offer more robust evidence on what is effective and for whom to combat the global pandemic we face and future policy decisions.

Keywords: COVID-19; difference-in-differences; implementation science; interrupted time series; preference design; sequential multiple assignment randomized trial; stepped wedge; study design.


Conflict of interest statement

The authors declare that the research was conducted in the absence of any commercial or financial relationships that could be construed as a potential conflict of interest.

Figures

Figure 1
Figure 1
Interrupted time series. An example of an interrupted time series design with no control group. A scatterplot of data is shown with the intervention implemented at the time of the dotted line. This plot indicates a level change (but no slope change) due to the intervention.
Figure 2
Figure 2
Interrupted time series with control group. An example of an interrupted time series design with control group (often analyzed with a difference-in-differences approach). A scatterplot of data is shown with an intervention (orange) and control (green) group. The intervention is implemented in the treated group at the time of the vertical dotted line. The orange dashed line refers to the hypothetical outcome of the treated group in the absence of the intervention. The difference between this hypothetical outcome and the actual outcome is the treatment effect.
Figure 3
Figure 3
Two-Stage Preference Design for Contact Tracing Quarantine Incentives. The comparison of uptake of A1 vs. B1 shows the selection effect. Is there differential uptake of these two programs? If yes, then there is a difference in the groups' overall selection likelihood. The comparison of outcomes of A2 vs. B2 shows the difference between two programs through a controlled trial design. For example, for the research question: Is there a difference in measures of successful completion of quarantine between the two programs? The comparison of outcomes of A1 vs. A2 and B1 vs. B2 shows the preference effect. For example, if more participants who selected cash stipend (A1), were likely to complete their second COVID-19 test than those who were randomized to cash stipend (A2).
Figure 4
Figure 4
SMART Design for Telemedicine Visit Type in Primary Care. Individuals are initially randomized (R in circle) to either telephone visits or video visits. Those who are not responding to the intervention are re-randomized to continue the same intervention, switch interventions, or add a health coach call.
Figure 5
Figure 5
SMART/Stepped Wedge Design for School Re-Opening. Credit: Dr. Naomi Bardach, University of California, San Francisco. In this design, Steps 1–3 each represent an increasing number of in-person students. The team will conduct baseline: (1) PCR COVID-19 testing at all schools, for students and teachers and staff, and (2) student and teacher surveys regarding exposure and symptom history. Then, weekly PCR testing for a random sampling of students and staff within each school cluster will be conducted to determine if changes from Step 1 to Step 2 will be allowable after 3 weeks. If no new outbreaks occur during the move to Step 2, nor during the weeks 9–11 when all schools are in Step 2, all school clusters will be newly randomized and move to Step 3 practices. If no or limited outbreaks occur, we will recommend staying in Step 3 restrictions. Should there be large outbreaks or several small outbreaks in any of the schools in any of the stages, schools can return to the more restrictive Step 2 practices.

References

    1. Perez-Lopez A, Hasan M, Iqbal M, Janahi M, Roscoe D, Tang P. Dramatic decrease of laboratory-confirmed influenza A after school closure in response to COVID-19. Pediatr Pulmonol. (2020) 55:2233–4. 10.1002/ppul.24933 - DOI - PMC - PubMed
    1. Siedner MJ, Harling G, Reynolds Z, Gilbert RF, Haneuse S, Venkataramani AS, et al. . Social distancing to slow the US COVID-19 epidemic: longitudinal pretest–posttest comparison group study. PLoS Med. (2020) 17:e1003244. 10.1371/journal.pmed.1003244 - DOI - PMC - PubMed
    1. Auger KA, Shah SS, Richardson T, Hartley D, Hall M, Warniment A, et al. . Association between statewide school closure and COVID-19 incidence and mortality in the US. JAMA. (2020) 324:859–70. 10.1001/jama.2020.14348 - DOI - PMC - PubMed
    1. Islam N, Sharp SJ, Chowell G, Shabnam S, Kawachi I, Lacey B, et al. . Physical distancing interventions and incidence of coronavirus disease 2019: natural experiment in 149 countries. BMJ. (2020) 370:m2743. 10.1136/bmj.m2743 - DOI - PMC - PubMed
    1. Wang X, Ferro EG, Zhou G, Hashimoto D, Bhatt DL. Association between universal masking in a health care system and SARS-CoV-2 positivity among health care workers. JAMA. (2020) 324:703–4. 10.1001/jama.2020.12897 - DOI - PMC - PubMed