

Analysis of Ferroptosis-Mediated Modification Patterns and Tumor Immune Microenvironment Characterization in Uveal Melanoma
- PMID: 34386492
- PMCID: PMC8353259
- DOI: 10.3389/fcell.2021.685120
Analysis of Ferroptosis-Mediated Modification Patterns and Tumor Immune Microenvironment Characterization in Uveal Melanoma
Abstract
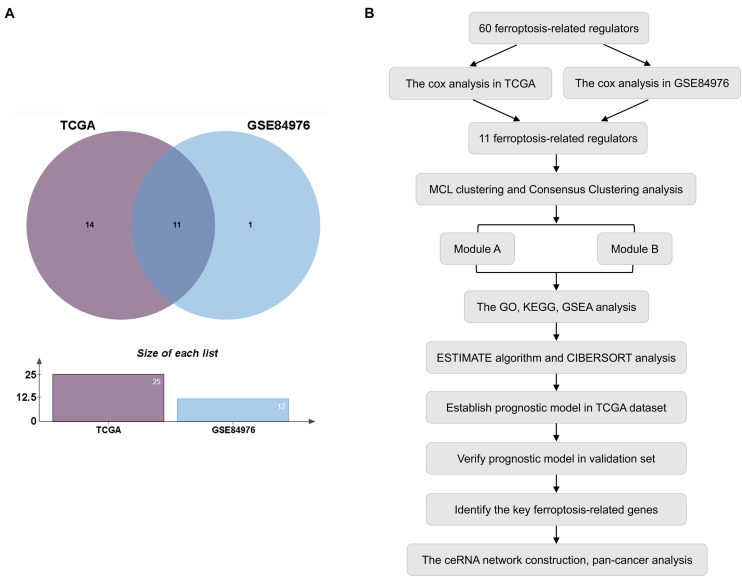
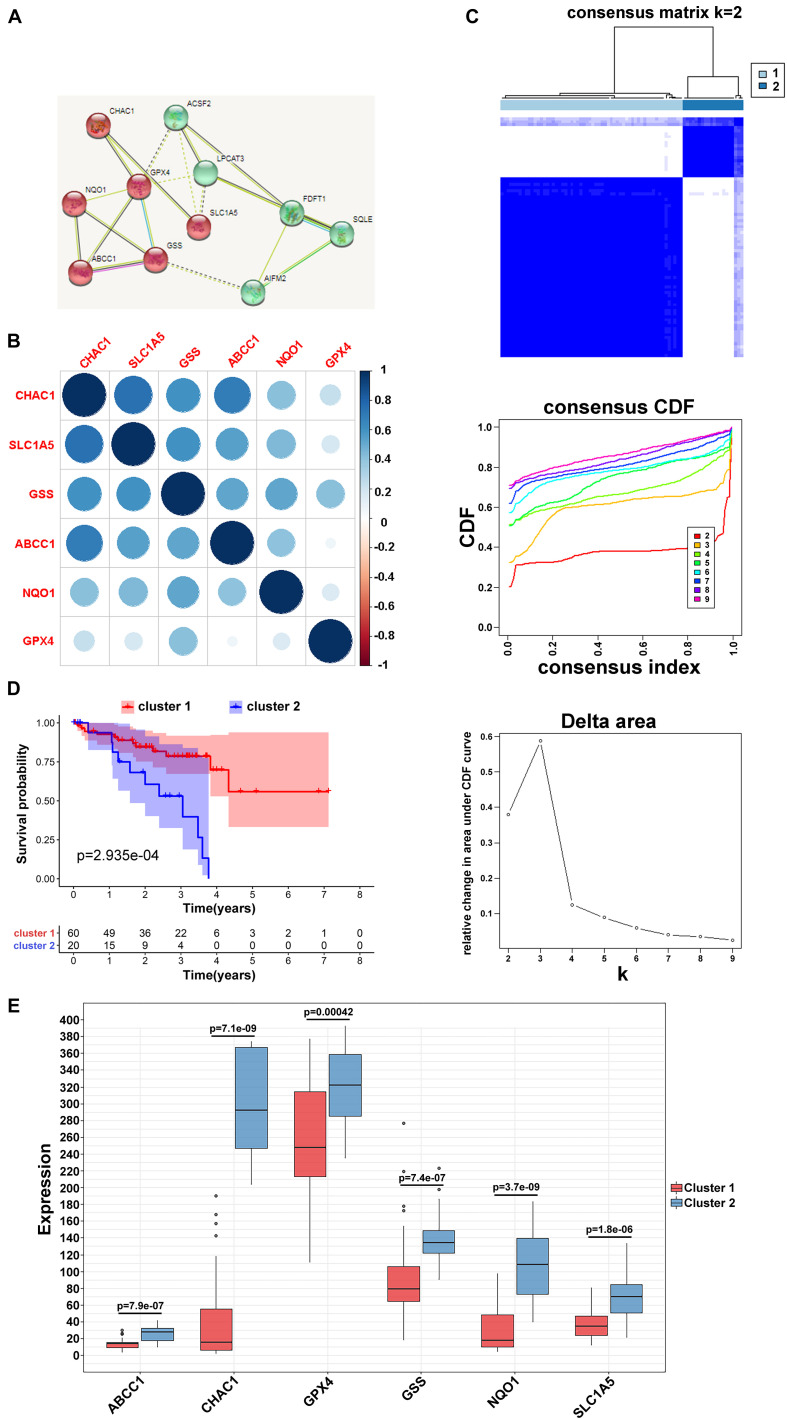
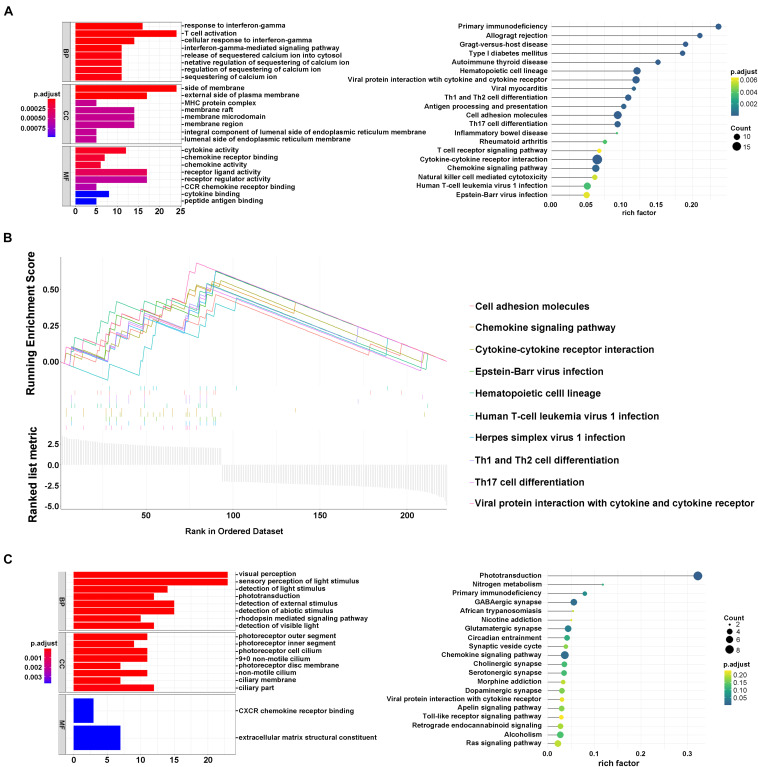
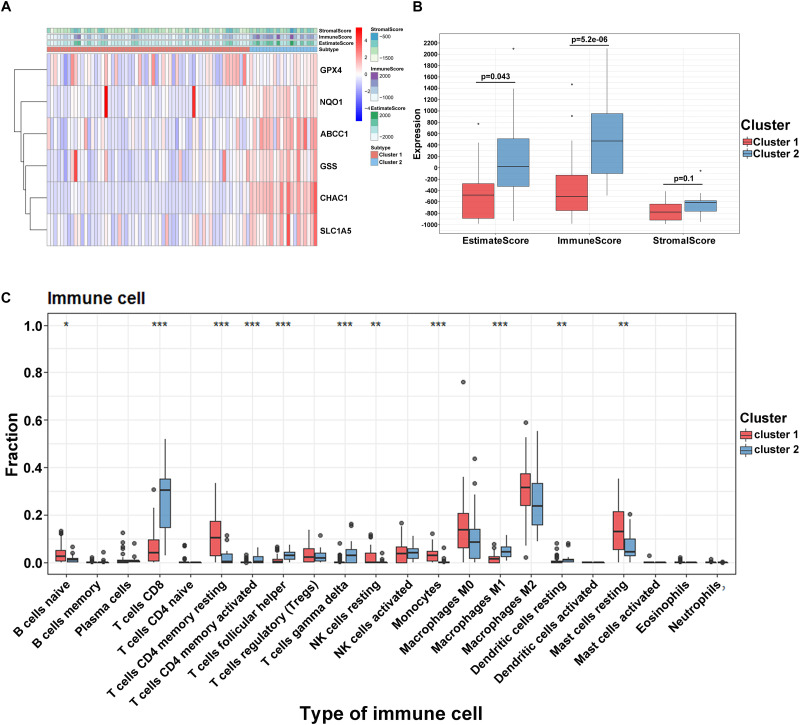
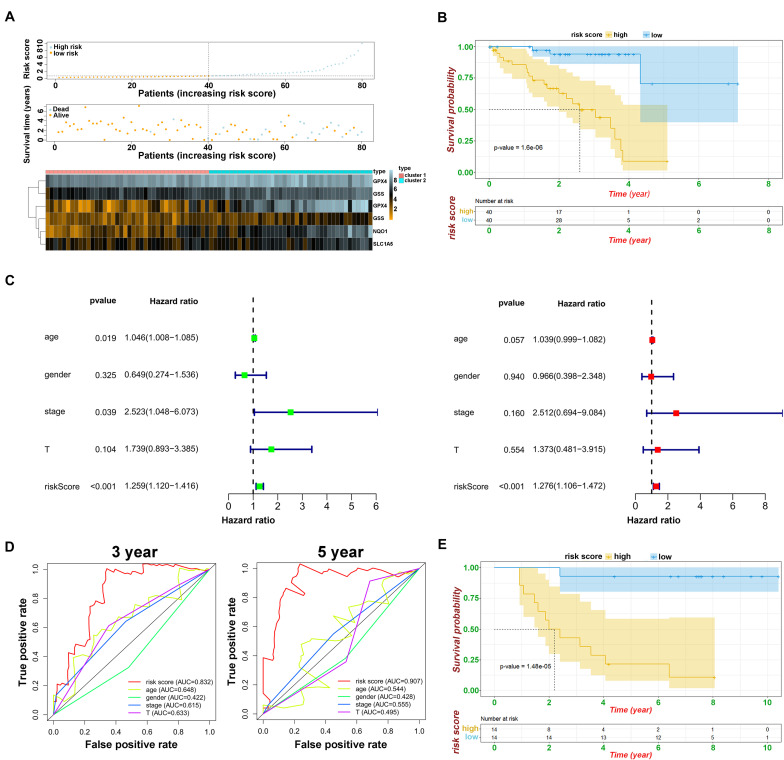
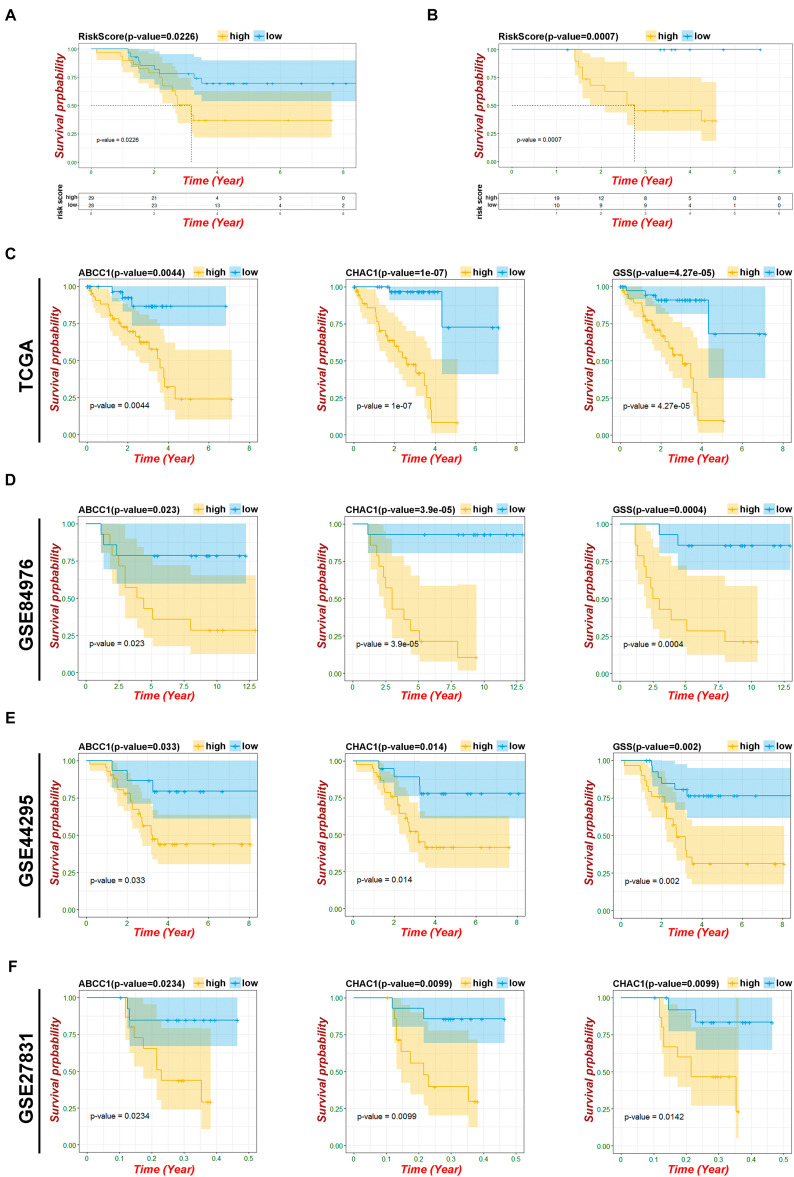
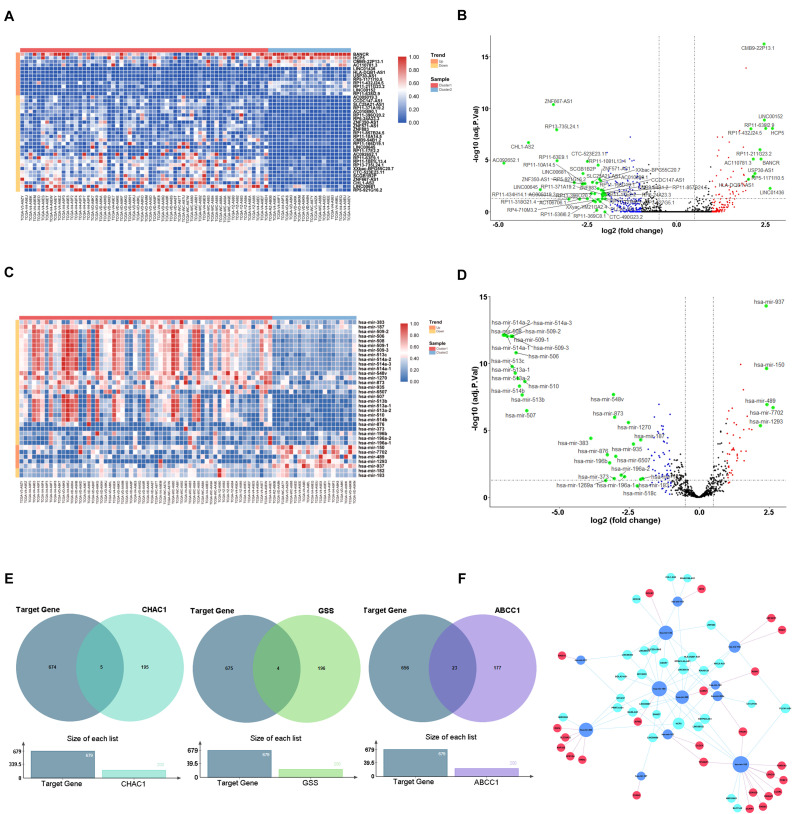
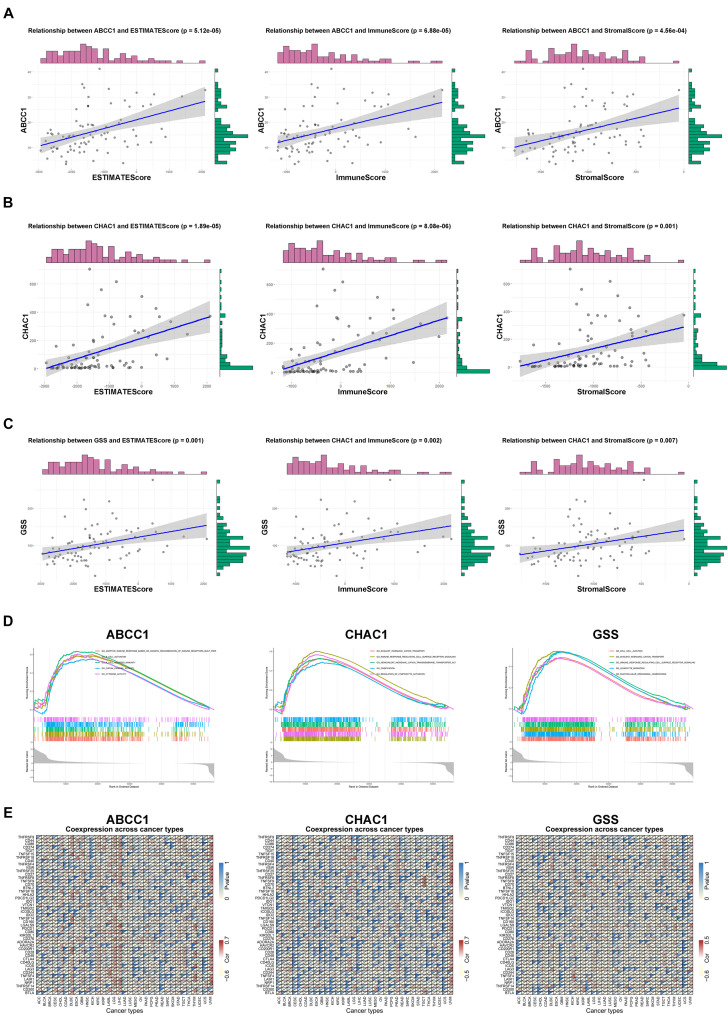
Uveal melanoma (UVM) is an intraocular malignancy in adults in which approximately 50% of patients develop metastatic disease and have a poor prognosis. The need for immunotherapies has rapidly emerged, and recent research has yielded impressive results. Emerging evidence has implicated ferroptosis as a novel type of cell death that may mediate tumor-infiltrating immune cells to influence anticancer immunity. In this study, we first selected 11 ferroptosis regulators in UVM samples from the training set (TCGA and GSE84976 databases) by Cox analysis. We then divided these molecules into modules A and B based on the STRING database and used consensus clustering analysis to classify genes in both modules. According to the Gene Ontology (GO), Kyoto Encyclopedia of Genes and Genomes (KEGG), and Gene Set Enrichment Analysis (GSEA), the results revealed that the clusters in module A were remarkably related to immune-related pathways. Next, we applied the ESTIMATE and CIBERSORT algorithms and found that these ferroptosis-related patterns may affect a proportion of TME infiltrating cells, thereby mediating the tumor immune environment. Additionally, to further develop the prognostic signatures based on the immune landscape, we established a six-gene-regulator prognostic model in the training set and successfully verified it in the validation set (GSE44295 and GSE27831). Subsequently, we identified the key molecules, including ABCC1, CHAC1, and GSS, which were associated with poor overall survival, progression-free survival, disease-specific survival, and progression-free interval. We constructed a competing endogenous RNA network to further elucidate the mechanisms, which consisted of 29 lncRNAs, 12 miRNAs, and 25 ferroptosis-related mRNAs. Our findings indicate that the ferroptosis-related genes may be suitable potential biomarkers to provide novel insights into UVM prognosis and decipher the underlying mechanisms in tumor microenvironment characterization.
Keywords: Uveal melanoma; ferroptosis; prognostic model; tumor immune environment; tumor-infiltrating immune cells.
Copyright © 2021 Jin, Wang, He, Zhu, Gong, Xiao, Chen and Cao.
Conflict of interest statement
The authors declare that the research was conducted in the absence of any commercial or financial relationships that could be construed as a potential conflict of interest.
Figures
Similar articles
-
Identification of ferroptosis genes in immune infiltration and prognosis in thyroid papillary carcinoma using network analysis.BMC Genomics. 2021 Jul 27;22(1):576. doi: 10.1186/s12864-021-07895-6. BMC Genomics. 2021. PMID: 34315405 Free PMC article.
-
Ferroptosis-related genes identify tumor immune microenvironment characterization for the prediction of prognosis in cervical cancer.Ann Transl Med. 2022 Jan;10(2):123. doi: 10.21037/atm-21-6265. Ann Transl Med. 2022. PMID: 35282071 Free PMC article.
-
Ferroptosis-related gene signature associates with immunity and predicts prognosis accurately in patients with osteosarcoma.Cancer Sci. 2021 Nov;112(11):4785-4798. doi: 10.1111/cas.15131. Epub 2021 Sep 21. Cancer Sci. 2021. PMID: 34506683 Free PMC article.
-
Ferroptosis-Associated Classifier and Indicator for Prognostic Prediction in Cutaneous Melanoma.J Oncol. 2021 Oct 28;2021:3658196. doi: 10.1155/2021/3658196. eCollection 2021. J Oncol. 2021. PMID: 34745259 Free PMC article. Review.
-
Ferroptosis-Mediated Formation of Tumor-Promoting Immune Microenvironment.Front Oncol. 2022 Mar 17;12:868639. doi: 10.3389/fonc.2022.868639. eCollection 2022. Front Oncol. 2022. PMID: 35372083 Free PMC article. Review.
Cited by
-
Genetics and RNA Regulation of Uveal Melanoma.Cancers (Basel). 2023 Jan 26;15(3):775. doi: 10.3390/cancers15030775. Cancers (Basel). 2023. PMID: 36765733 Free PMC article. Review.
-
Crosstalk of three novel types of programmed cell death defines distinct microenvironment characterization and pharmacogenomic landscape in breast cancer.Front Immunol. 2022 Aug 11;13:942765. doi: 10.3389/fimmu.2022.942765. eCollection 2022. Front Immunol. 2022. PMID: 36032140 Free PMC article.
-
A Novel Ferroptosis-Related lncRNA Prognostic Model and Immune Infiltration Features in Skin Cutaneous Melanoma.Front Cell Dev Biol. 2022 Feb 3;9:790047. doi: 10.3389/fcell.2021.790047. eCollection 2021. Front Cell Dev Biol. 2022. PMID: 35186949 Free PMC article.
-
EZH2-mediated H3K27me3 is a predictive biomarker and therapeutic target in uveal melanoma.Front Genet. 2022 Oct 6;13:1013475. doi: 10.3389/fgene.2022.1013475. eCollection 2022. Front Genet. 2022. PMID: 36276954 Free PMC article.
-
Hypoxia-related lncRNA correlates with prognosis and immune microenvironment in uveal melanoma.Cancer Cell Int. 2024 Oct 9;24(1):336. doi: 10.1186/s12935-024-03509-9. Cancer Cell Int. 2024. PMID: 39385179 Free PMC article.
References
-
- Chang A. E., Karnell L. H., Menck H. R. (1998). The national cancer data base report on cutaneous and noncutaneous melanoma: a summary of 84,836 cases from the past decade. the american college of surgeons commission on cancer and the american cancer society. Cancer 83 1664–1678. 10.1002/(sici)1097-0142(19981015)83:8<1664::aid-cncr23>3.0.co;2-g - DOI - PubMed
LinkOut - more resources
Full Text Sources
Other Literature Sources
Miscellaneous