. 2021 Aug;2(8):e375-e385.
doi: 10.1016/s2666-5247(21)00037-9. Epub 2021 May 18.

Inflammatory profile of patients with tuberculosis with or without HIV-1 co-infection: a prospective cohort study and immunological network analysis

Affiliations

Inflammatory profile of patients with tuberculosis with or without HIV-1 co-infection: a prospective cohort study and immunological network analysis

Elsa Du Bruyn et al. Lancet Microbe. 2021 Aug.

Abstract

Background: HIV-1 mediated dysregulation of the immune response to tuberculosis and its effect on the response to antitubercular therapy (ATT) is incompletely understood. We aimed to analyse the inflammatory profile of patients with tuberculosis with or without HIV-1 co-infection undergoing ATT, with specific focus on the effect of ART and HIV-1 viraemia in those co-infected with HIV-1.

Methods: In this prospective cohort study and immunological network analysis, a panel of 38 inflammatory markers were measured in the plasma of a prospective patient cohort undergoing ATT at Khayelitsha Site B clinic, Cape Town, South Africa. We recruited patients with sputum Xpert MTB/RIF-positive rifampicin-susceptible pulmonary tuberculosis. Patients were excluded from the primary discovery cohort if they were younger than 18 years, unable to commence ATT for any reason, pregnant, had unknown HIV-1 status, were unable to consent to study participation, were unable to provide baseline sputum samples, had more than three doses of ATT, or were being re-treated for tuberculosis within 6 months of their previous ATT regimen. Plasma samples were collected at baseline (1-5 days after commencing ATT), week 8, and week 20 of ATT. We applied network and multivariate analysis to investigate the dynamic inflammatory profile of these patients in relation to ATT and by HIV status. In addition to the discovery cohort, a validation cohort of patients with HIV-1 admitted to hospital with CD4 counts less than 350 cells per μL and a high clinical suspicion of new tuberculosis were recruited.

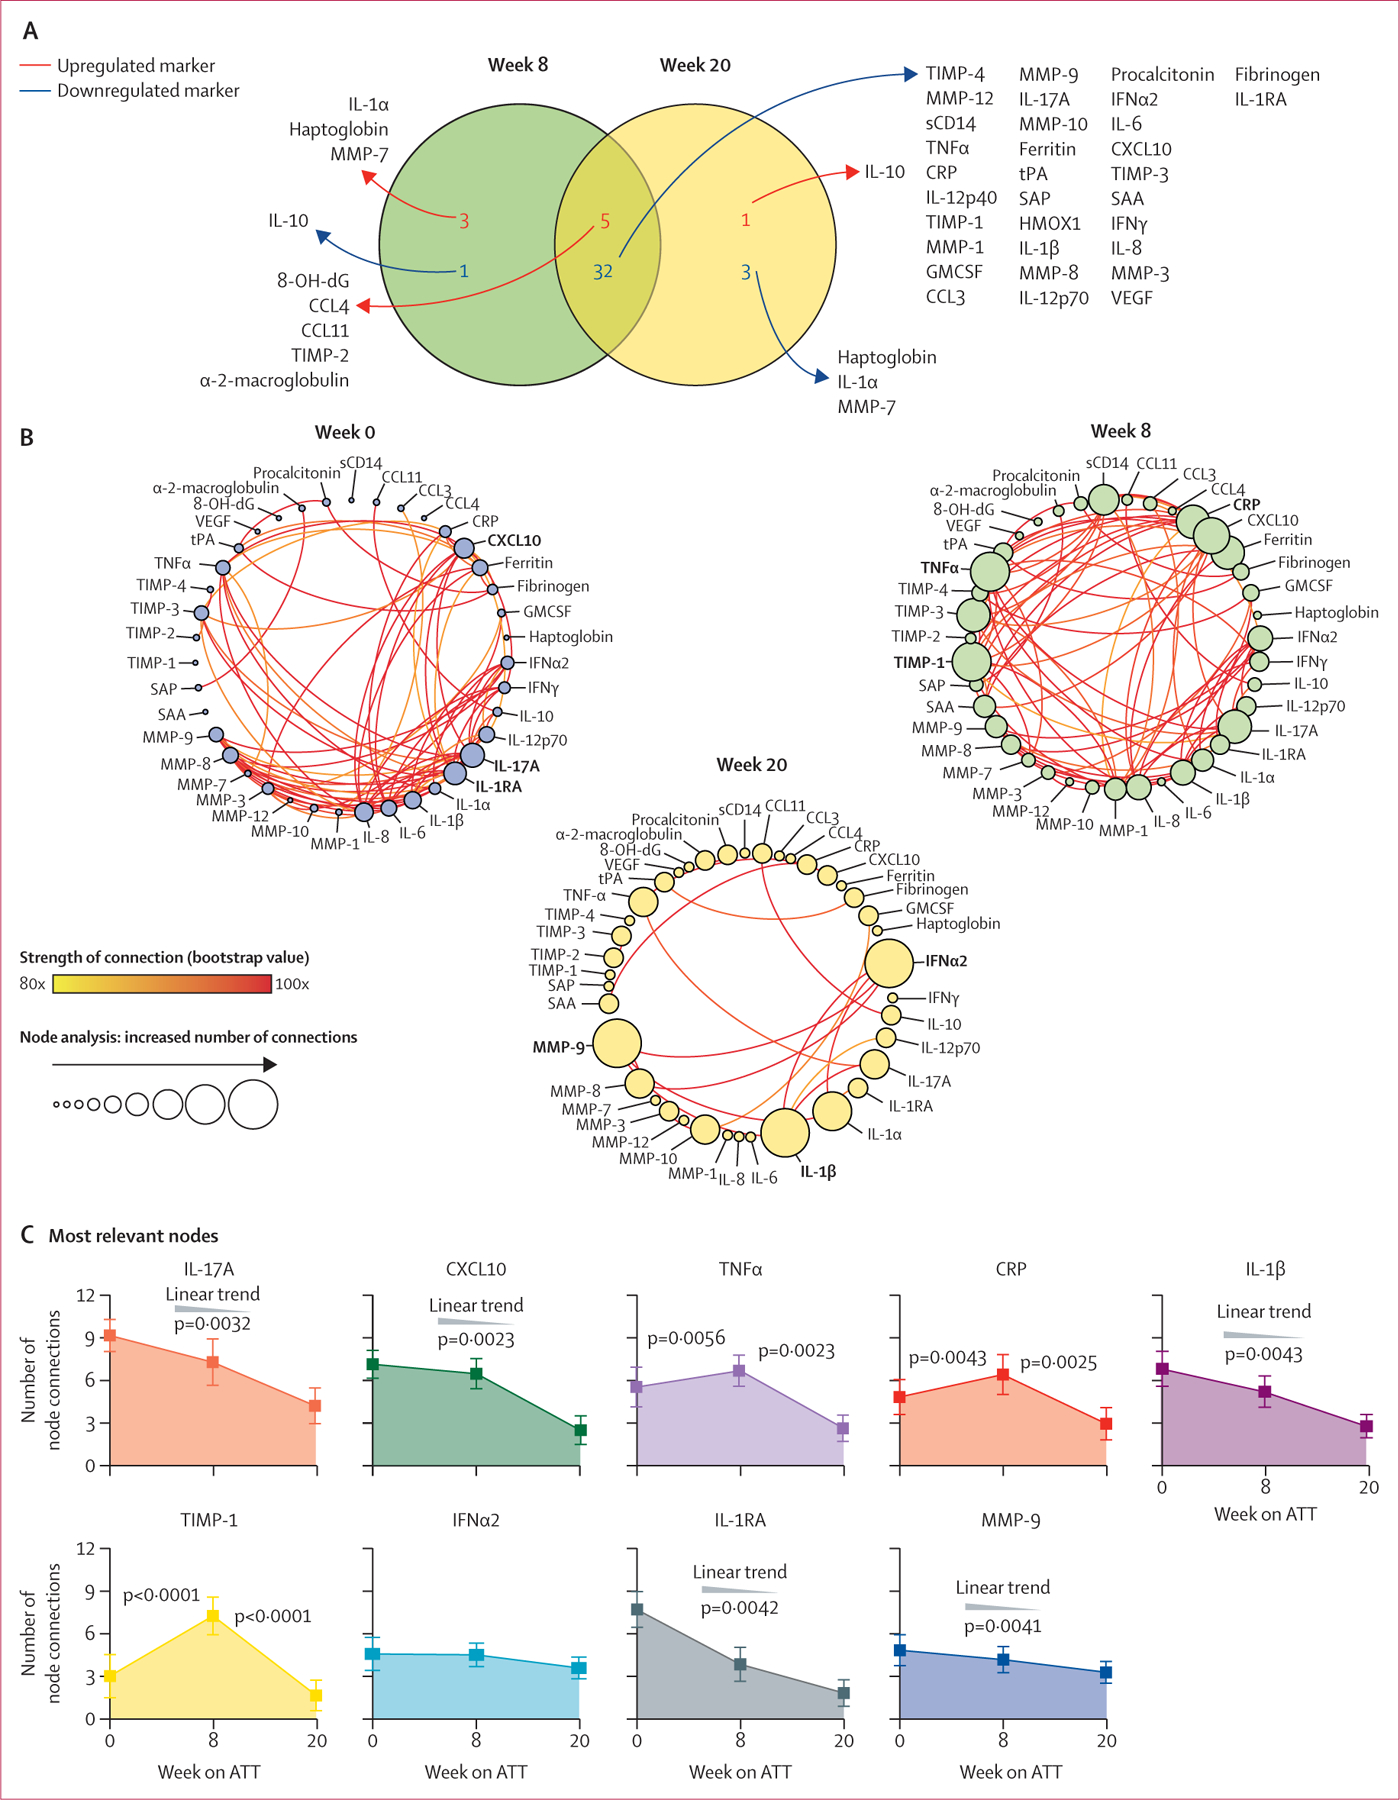
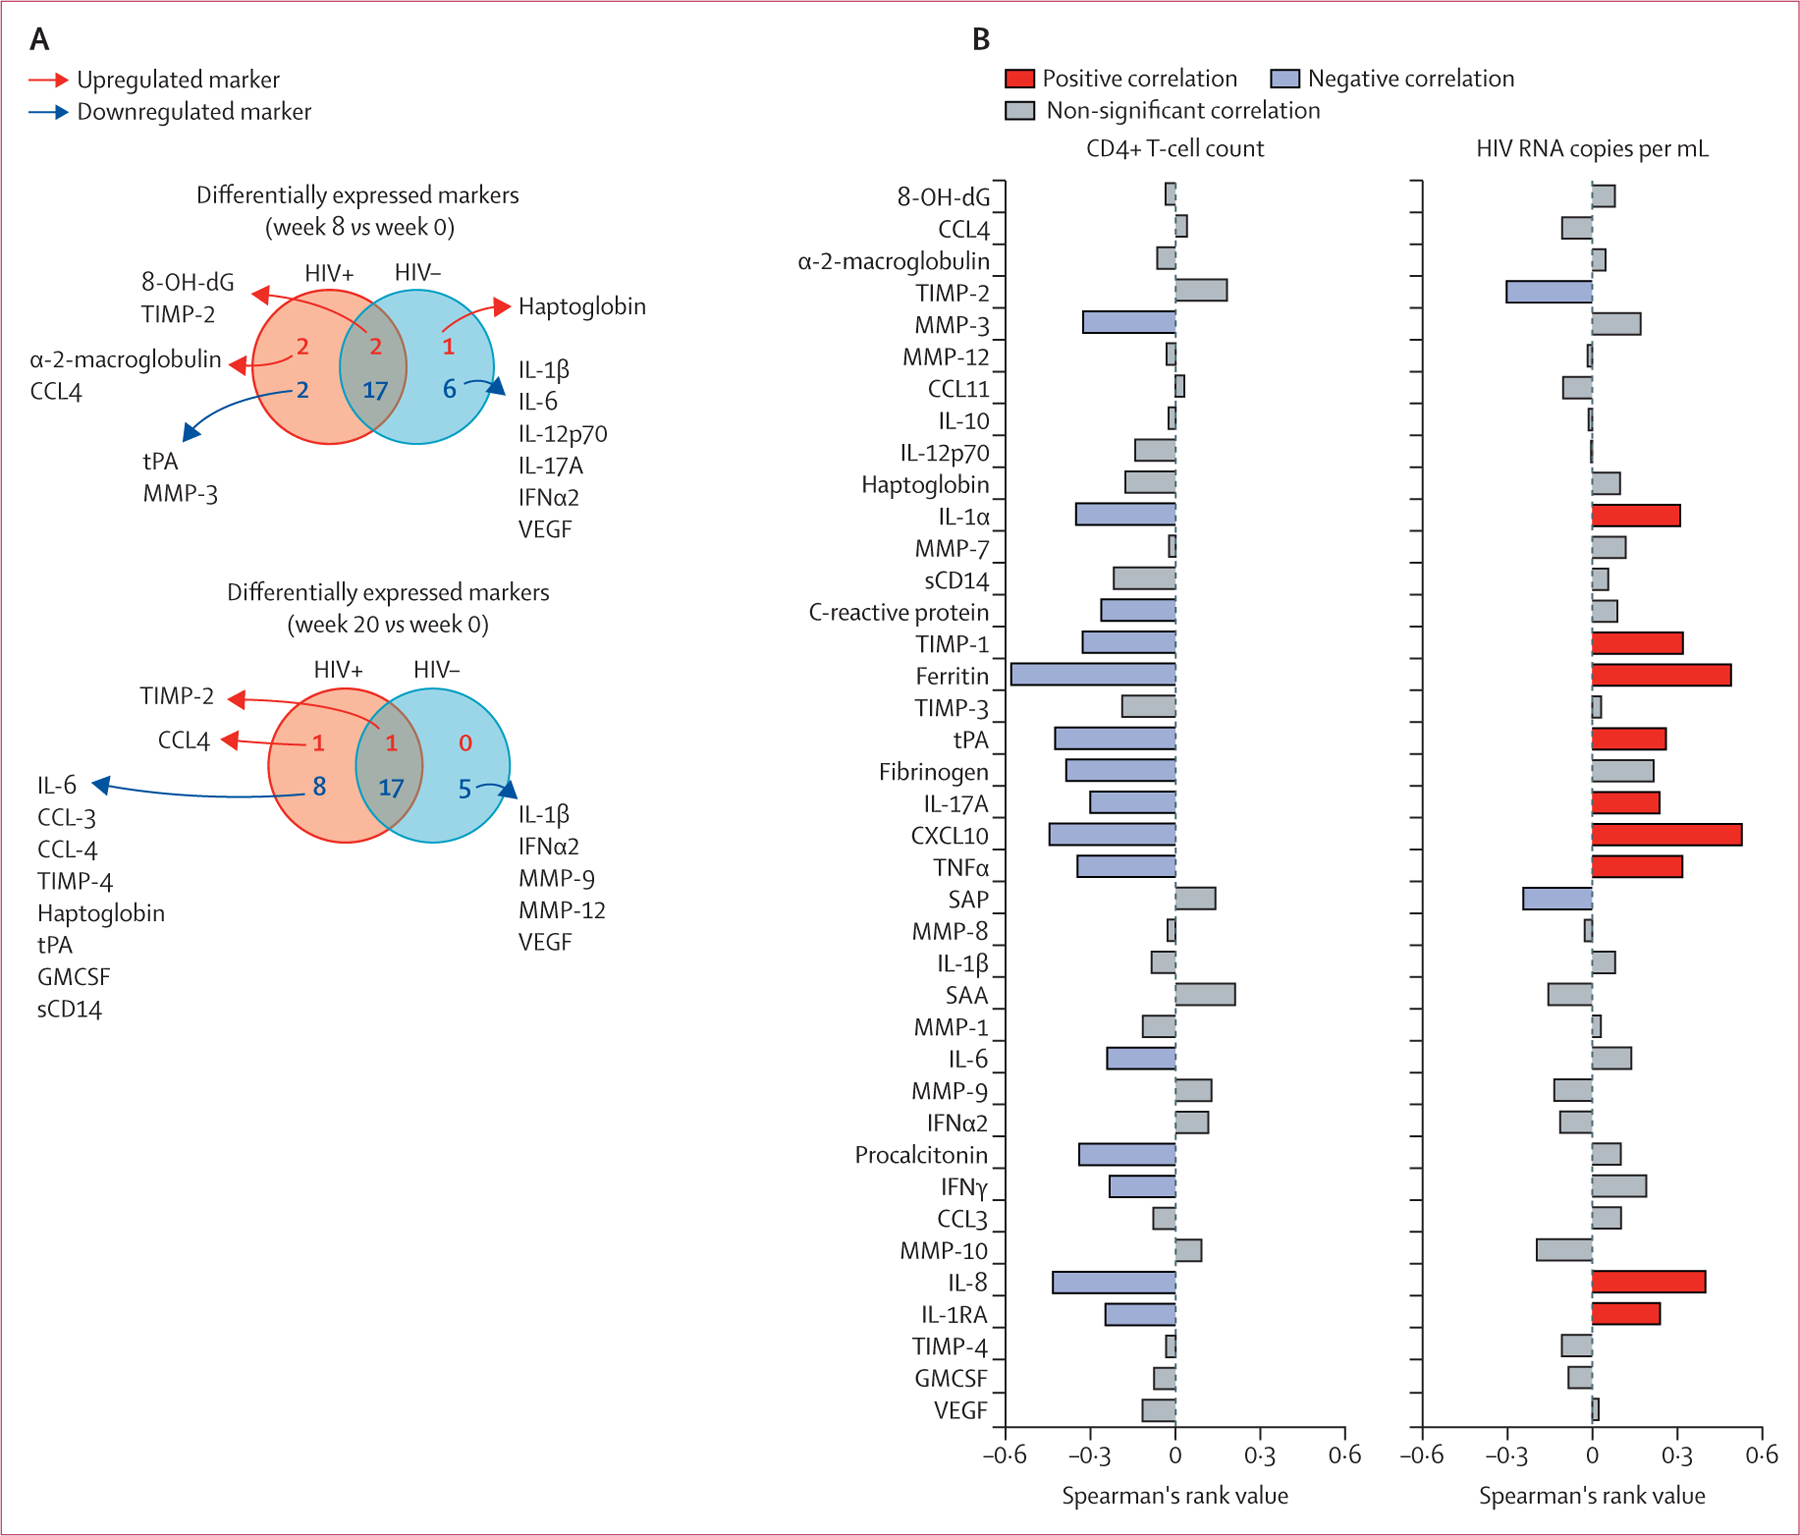
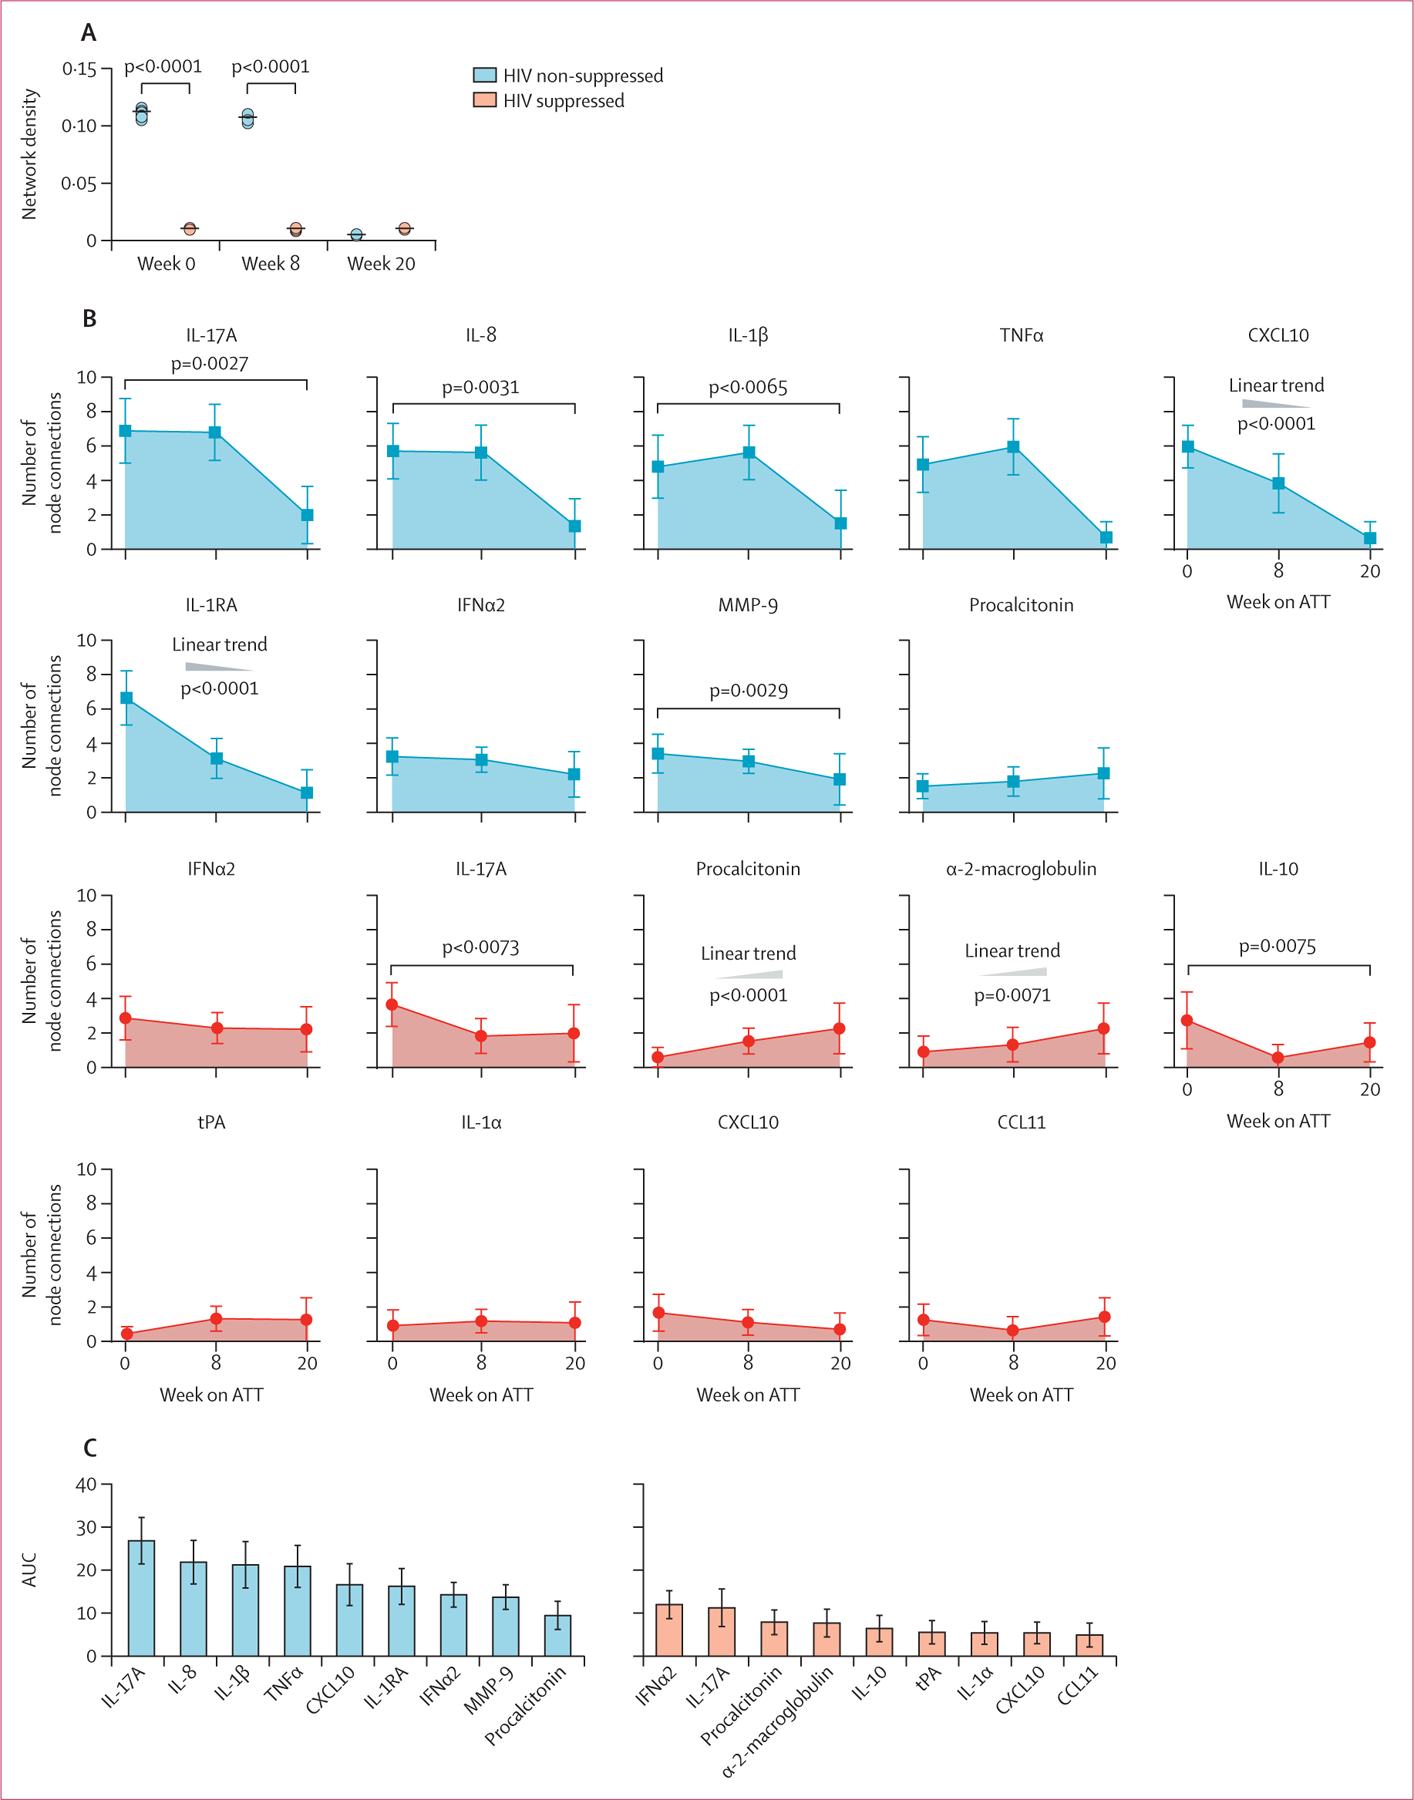
Findings: Between March 1, 2013, and July 31, 2014, we assessed a cohort of 129 participants (55 [43%] female and 74 [57%] male, median age 35·1 years [IQR 30·1-43·7]) and 76 were co-infected with HIV-1. HIV-1 status markedly influenced the inflammatory profile regardless of ATT duration. HIV-1 viral load emerged as a major factor driving differential inflammatory marker expression and having a strong effect on correlation profiles observed in the HIV-1 co-infected group. Interleukin (IL)-17A emerged as a key correlate of HIV-1-induced inflammation during HIV-tuberculosis co-infection.

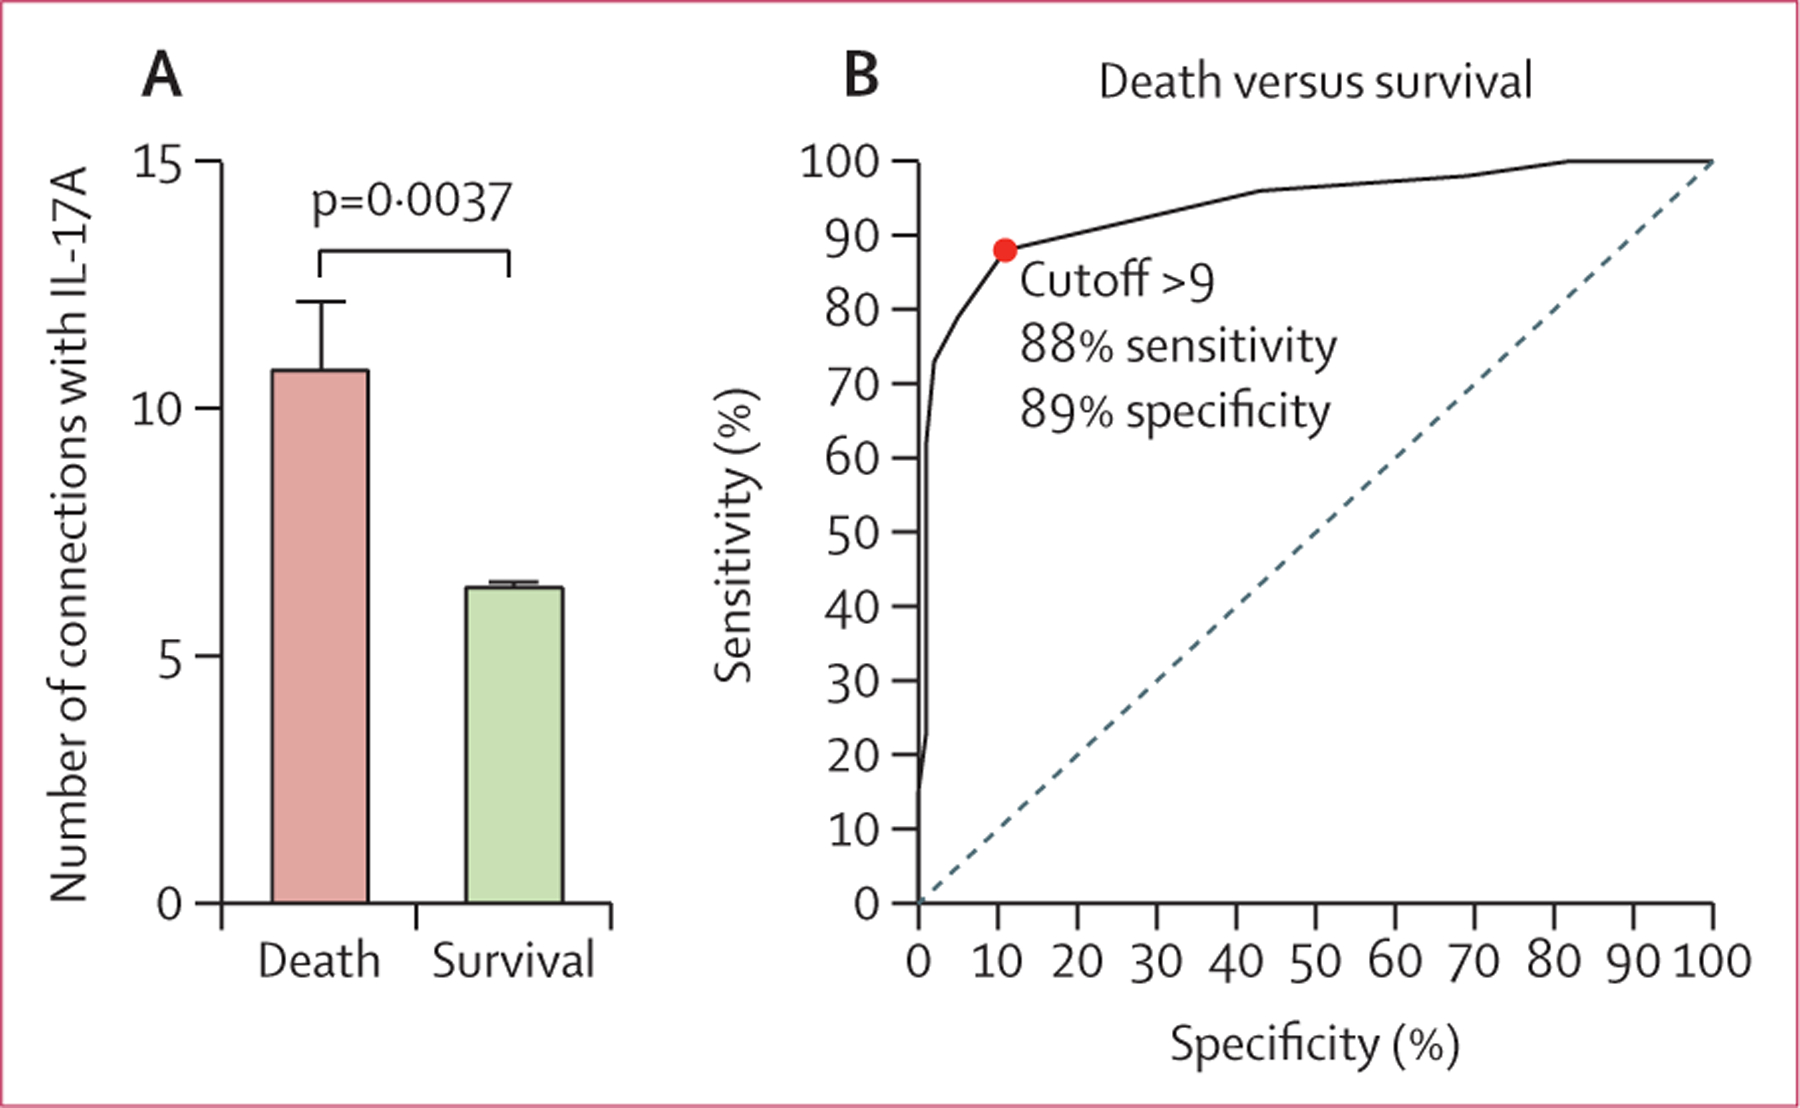
Interpretation: Our findings show the effect of HIV-1 co-infection on the complexity of plasma inflammatory profiles in patients with tuberculosis. Through network analysis we identified IL-17A as an important node in HIV-tuberculosis co-infection, thus implicating this cytokine's capacity to correlate with, and regulate, other inflammatory markers. Further mechanistic studies are required to identify specific IL-17A-related inflammatory pathways mediating immunopathology in HIV-tuberculosis co-infection, which could illuminate targets for future host-directed therapies.

Funding: National Institutes of Health, The Wellcome Trust, UK Research and Innovation, Cancer Research UK, European and Developing Countries Clinical Trials Partnership, and South African Medical Research Council.


Figures

Figure 1:
Figure 1:. Inflammatory signatures of plasma markers in patients on ATT
(A) Venn diagram shows the markers for which values were significantly different between week 8 or week 20 versus week 0 of ATT (p<0·05 after adjustment for multiple comparisons). (B) Network analysis of the biomarker correlation matrices was done with bootstrapping (100 ×). Relationships that remained significant in at least 80 of 100 bootstraps were plotted as connecting lines. Each node represents a different plasma parameter. Circle size is proportional to the number of significant correlations involving that node in each network (sizes of the circles are balanced for each network). The nature of each correlation (positive of negative) is described in appendix 1 (p 15). (C) At each timepoint, the top three markers with the highest number of significant correlations were selected. The number of connections for each marker were compared between the study timepoints using the Freedman’s matched pairs test with Dunn’s multiple comparisons ad hoc test or non-parametric linear trend analysis. p values were adjusted for multiple comparisons using the Holm-Bonferroni method. ATT=antitubercular therapy. CCL=C-C motif chemokine ligand. CRP=C-reactive protein. CXCL10=C-X-C motif chemokine ligand 10. GMCSF=granulocyte-macrophage colony-stimulating factor. IFN=interferon. IL=interleukin. MMP=matrix metalloproteinase. 8-OH-dG=8-hydroxy-2’-deoxyguanosine. SAA=serum amyloid protein A. SAP=serum amyloid protein P. TIMP=tissue inhibitor of metalloproteinase. TNF=tumour necrosis factor. VEGF=vascular endothelial growth factor. tPA=tissue plasminogen activator. HMOX1=heme oxygenase 1. sCD14=soluble CD14.
Figure 2:
Figure 2:. Differential expression of plasma markers in patients with tuberculosis stratified according to HIV-1 infection status
(A) Venn diagrams describe the markers for which values were significantly different between week 8 or week 20 versus week 0 of antitubercular therapy in subgroups of patients stratified according to HIV-1 infection status (p<0·05 after adjustment for multiple comparisons). (B) Plasma concentrations of the indicated markers measured before antitubercular therapy initiation were tested for correlations with CD4 T-cell counts and HIV-1 RNA copies using Spearman’s correlation rank test. CCL=C-C motif chemokine ligand. CXCL10=C-X-C motif chemokine ligand 10. MMP=matrix metalloproteinase. IFN=interferon. IL=interleukin. 8-OH-dG=8-hydroxy-2’-deoxyguanosine. SAA=serum amyloid protein A. SAP=serum amyloid protein P. TIMP=tissue inhibitor of metalloproteinase. TNF=tumour necrosis factor. GMCSF=granulocyte-macrophage colony-stimulating factor. VEGF=vascular endothelial growth factor. tPA=tissue plasminogen activator. sCD14=soluble CD14.
Figure 3:
Figure 3:. Inflammatory signatures of plasma markers in patients with HIV–tuberculosis co-infection stratified by HIV-1 viral suppression during ATT
(A) Network densities of each bootstrap were calculated for each study group and timepoint as described. Data were compared using the Kruskal-Wallis test with Dunn’s multiple comparisons ad hoc test. (B) At each timepoint, the top three markers with the highest number of significant correlations were selected. The number of connections for each marker were compared between the study timepoints using the Friedman’s matched pairs test with Dunn’s multiple comparisons ad hoc test or non-parametric linear trend analysis. p values were adjusted for multiple comparisons using the Holm-Bonferroni method. (C) AUC values for each marker. ATT=antitubercular therapy. AUC=area under the curve. CCL=C-C motif chemokine ligand. CXCL10=C-X-C motif chemokine ligand 10. IFN=interferon. IL=interleukin. MMP=matrix metalloproteinase. TNF=tumour necrosis factor. tPA=tissue plasminogen activator.
Figure 4:
Figure 4:. Inflammatory signatures of plasma markers in patients admitted to hospital with HIV–tuberculosis co-infection undergoing antiretroviral therapy, at week 0 of antitubercular therapy
(A) Number of connections involving IL-17A in patients in the validation cohort who died versus who survived. (B) Receiver operating characteristic curve to assess whether the number of connections with IL-17A could predict death in the validation cohort. IL=interleukin.

References

    1. WHO. Global Tuberculosis Report. 2020. Geneva: World Health Organization, 2020. https://www.who.int/tb/global-report-2020 (accessed Jan 18, 2021).
    1. Gupta A, Wood R, Kaplan R, Bekker LG, Lawn SD. Tuberculosis incidence rates during 8 years of follow-up of an antiretroviral treatment cohort in South Africa: comparison with rates in the community. PLoS One 2012; 7: e34156. - PMC - PubMed
    1. Rockwood N, Costa DL, Amaral EP, et al. Mycobacterium tuberculosis induction of heme oxygenase-1 expression is dependent on oxidative stress and reflects treatment outcomes. Front Immunol 2017; 8: 542. - PMC - PubMed
    1. Miranda P, Gil-Santana L, Oliveira MG, et al. Sustained elevated levels of C-reactive protein and ferritin in pulmonary tuberculosis patients remaining culture positive upon treatment initiation. PLoS One 2017; 12: e0175278. - PMC - PubMed
    1. Mesquita ED, Gil-Santana L, Ramalho D, et al. Associations between systemic inflammation, mycobacterial loads in sputum and radiological improvement after treatment initiation in pulmonary TB patients from Brazil: a prospective cohort study. BMC Infect Dis 2016; 16: 368. - PMC - PubMed

Publication types