

Primary care physician continuity, survival, and end-of-life care intensity
- PMID: 34386976
- PMCID: PMC9264461
- DOI: 10.1111/1475-6773.13869
Primary care physician continuity, survival, and end-of-life care intensity
Abstract
Objective: To examine the associations of primary care physician (PCP) care continuity with cancer-specific survival and end-of-life care intensity.
Data sources: Surveillance, epidemiology, and end results linked to Medicare claims data from 2001 to 2015.
Study design: Cox proportional hazards models with mixed effects and hierarchical generalized logistic models were used to examine the associations of PCP care continuity with cancer-specific survival and end-of-life care intensity, respectively. PCP care continuity, defined as having visited the predominant PCP (who saw the patient most frequently before diagnosis) within 6 months of diagnosis.
Data extraction methods: We identified Medicare patients diagnosed at age 66.5-94 years with stage-III or IV poor-prognosis cancer during 2001-2012 and followed them up until 2015. Patients who died within 6 months after diagnosis were excluded.
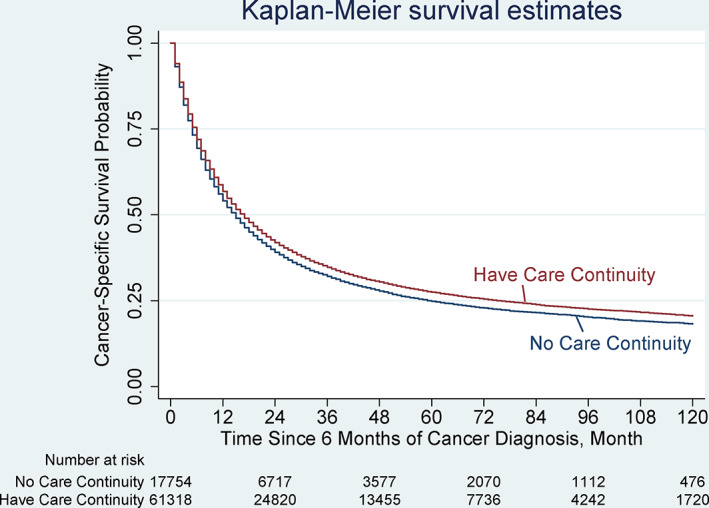
Principal findings: Primary study cohort consisted of 85,467 patients (median survival 22 months), 71.7% of whom had PCP care continuity. Patients with PCP care continuity tended to be older, married, nonblack, non-Hispanic, and to have fewer comorbid conditions (p < 0.001 for all). Patients with PCP care continuity had lower cancer-specific mortality (adjusted hazard ratio: 0.93; 95% confidence interval [CI]: 0.91 to 0.95; p = 0.001) than did those without PCP care continuity. Findings of the 2001-2003 cohorts (nearly all of whom died by 2015) show no associations of overall end-of-life care intensity measures with PCP care continuity (adjusted marginal effects: 0.005; 95% CI: -0.016 to 0.026; p = 0.264).
Conclusions: Among Medicare beneficiaries with advanced poor-prognosis cancer, PCP continuity was associated with modestly improved survival without raising overall aggressive end-of-life care.
Keywords: cancer/oncology; care continuity; end of life; primary care physician; prospective cohort study; survival analysis.
© 2021 Health Research and Educational Trust.
Figures
Similar articles
-
Provider continuity prior to the diagnosis of advanced lung cancer and end-of-life care.PLoS One. 2013 Sep 3;8(9):e74690. doi: 10.1371/journal.pone.0074690. eCollection 2013. PLoS One. 2013. PMID: 24019974 Free PMC article.
-
Changes in Health Care Use and Outcomes After Turnover in Primary Care.JAMA Intern Med. 2021 Feb 1;181(2):186-194. doi: 10.1001/jamainternmed.2020.6288. JAMA Intern Med. 2021. PMID: 33196767 Free PMC article.
-
Continuity of care and advanced prostate cancer.Cancer Med. 2023 May;12(10):11795-11805. doi: 10.1002/cam4.5845. Epub 2023 Mar 23. Cancer Med. 2023. PMID: 36951508 Free PMC article.
-
Treatment disparities for disabled medicare beneficiaries with stage I non-small cell lung cancer.Arch Phys Med Rehabil. 2008 Apr;89(4):595-601. doi: 10.1016/j.apmr.2007.09.042. Arch Phys Med Rehabil. 2008. PMID: 18373987 Review.
-
The Role of Primary Care Physicians in Providing End-of-Life Care.Am J Hosp Palliat Care. 2019 Mar;36(3):249-254. doi: 10.1177/1049909118808232. Epub 2018 Oct 24. Am J Hosp Palliat Care. 2019. PMID: 30354178
Cited by
-
Continuity of care and treatment intensity at the end of life in Swiss cancer patients.Eur J Public Health. 2023 Jun 1;33(3):396-402. doi: 10.1093/eurpub/ckad047. Eur J Public Health. 2023. PMID: 37029913 Free PMC article.
-
Association of rurality, type of primary caregiver and place of death with end-of-life medical expenditures among the oldest-old population in China.Int J Equity Health. 2023 Jan 3;22(1):1. doi: 10.1186/s12939-022-01813-2. Int J Equity Health. 2023. PMID: 36597134 Free PMC article.
-
Association between service scope of primary care facilities and prevalence of high-cost population: a retrospective study in rural Guizhou, China.BMC Prim Care. 2022 Nov 25;23(1):301. doi: 10.1186/s12875-022-01914-5. BMC Prim Care. 2022. PMID: 36434547 Free PMC article.
References
-
- Jones LE, Doebbeling CC. Beyond the traditional prognostic indicators: the impact of primary care utilization on cancer survival. J Clin Oncol. 2007;25(36):5793‐5799. - PubMed
Publication types
MeSH terms
Grants and funding
LinkOut - more resources
Full Text Sources
Medical
