. 2022 Feb;530(2):574-589.
doi: 10.1002/cne.25230. Epub 2021 Aug 23.

Morphometric analysis of astrocytes in vocal production circuits of common marmoset (Callithrix jacchus)

Affiliations

Morphometric analysis of astrocytes in vocal production circuits of common marmoset (Callithrix jacchus)

Ariana Z Turk et al. J Comp Neurol. 2022 Feb.

Abstract

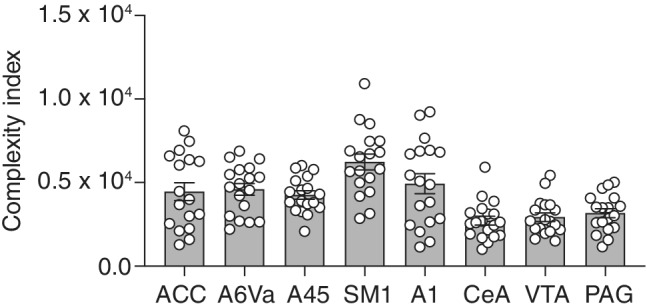
Astrocytes, the star-shaped glial cells, are the most abundant non-neuronal cell population in the central nervous system. They play a key role in modulating activities of neural networks, including those involved in complex motor behaviors. Common marmosets (Callithrix jacchus), the most vocal non-human primate (NHP), have been used to study the physiology of vocalization and social vocal production. However, the neural circuitry involved in vocal production is not fully understood. In addition, even less is known about the involvement of astrocytes in this circuit. To understand the role, that astrocytes may play in the complex behavior of vocalization, the initial step may be to study their structural properties in the cortical and subcortical regions that are known to be involved in vocalization. Here, in the common marmoset, we identify all astrocytic subtypes seen in other primate's brains, including intralaminar astrocytes. In addition, we reveal detailed structural characteristics of astrocytes and perform morphometric analysis of astrocytes residing in the cortex and midbrain regions that are associated with vocal production. We found that cortical astrocytes in these regions illustrate a higher level of complexity when compared to those in the midbrain. We hypothesize that this complexity that is expressed in cortical astrocytes may reflect their functions to meet the metabolic/structural needs of these regions.

Keywords: GFAP; astrocytes; cerebral cortex; common marmoset; glia; midbrain; vocalization.


Conflict of interest statement

The authors declare no competing financial interests.

Figures

FIGURE 1
FIGURE 1
Schematic drawings of regions of interest in adult marmoset brain. (a) Locations of ventral premotor cortex (A6Va) and area 45 (A45) are shown on illustration (right) and Nissl‐stained (left) coronal section. r—rostral, c—caudal, v—ventral, d—dorsal. (b) Illustration of a coronal section containing ventral primary sensorimotor cortex (SM1) corresponding to the orofacial region, rostral anterior cingulate cortex (ACC), and central nucleus of the amygdala (CeA) (right) is accompanied with Nissl staining from the corresponding section (left). (c) Location of primary auditory cortex (A1) and ventral tegmental area (VTA) in illustration (right) and Nissl‐stained coronal slice (left). (d) Location of periaqueductal gray (PAG) is illustrated in coronal section from midbrain. Sagittal drawings of marmoset brain illustrate the regions of interest in each panel with a dashed line. Scale bars: 1 mm
FIGURE 2
FIGURE 2
Antibody validation and methods to analyze morphometric characterization of astrocytes. (a–c) Ventrolateral brainstem immunostained GFAP‐positive astrocytes with mouse anti‐GFAP monoclonal antibody (green; a) and rabbit anti‐GFAP polyclonal antibody (red; b). Merged low magnification and high magnification images. (c) Displays colocalization of both GFAP antibody labeling. (d) Semi‐automated morphological 3D reconstructed astrocyte using Imaris in SM1. (e) Example of convex hull analysis in which the tips of each astrocytic process are connected to form a polygon in order to evaluate the space occupied by the astrocyte. (f) Portrayal of sholl analysis in which data points including branch points, terminal points, and process length are measured at each radial circle starting at the cell body and emanating outward. (g) Color‐coated evaluation of process length where red indicates the shortest branches and white indicates the longest processes. (h and i) Display visualization of data from branch points (h) and terminal point (i), all data were generated using Imaris software [Color figure can be viewed at wileyonlinelibrary.com]
FIGURE 3
FIGURE 3
Immuno‐stained GFAP‐positive astrocytes in the adult marmoset cortex and midbrain. (a–e) Show the confocal images of cortical regions, including anterior cingulate cortex (ACC) (a), primary sensorimotor cortex (SM1) (b), primary auditory cortex (A1) (c), ventral premotor cortex (A6Va) (d), and area 45 (A45) (e). (f–h) Denote the confocal images of midbrain regions, including central nucleus of the amygdala (CeA) (f), ventral tegmental area (VTA) (g), and periaqueductal gray (PAG) (h)
FIGURE 4
FIGURE 4
Example reconstructed GFAP‐positive astrocytes in the adult marmoset cortex and midbrain. (a–e) Example of reconstructed cortical astrocytes in (a) anterior cingulate cortex (ACC), (b) primary sensorimotor cortex (SM1), (c) primary auditory cortex (A1), (d) ventral premotor cortex (A6Va), and (e) area 45 (A45). (f–h) Illustrate reconstructed midbrain astrocytes residing in (f) central nucleus of the amygdala (CeA), (g) ventral tegmental area (VTA), and (h) periaqueductal gray (PAG)
FIGURE 5
FIGURE 5
Astrocyte subtypes observed in the marmoset brain. All five astrocyte subtypes that were previously described human and other primate species were observed in marmoset brain. (a) Interlaminar astrocytes in layers I and II of the primary sensorimotor cortex (SM1) cortex (b and c) fibrous astrocytes displayed in the white matter tissue with overlapping and intermingling processes. (b) Astrocytes found in the ventral tegmental area (VTA) and (c) astrocytes seen in the anterior commissure. (d) Spatially distinct protoplasmic astrocytes found in layers VI‐V of the SM1 cortex. (e) Example of polarized astrocyte in layer V of SM1 in close proximity and interacting with a blood vessel (marked by *). (f) Illustrates a varicose astrocyte in layer V of SM1 with one long process (marked with white arrowheads) extended and multiple varicosities observed along the process
FIGURE 6
FIGURE 6
Summary of region‐by‐region sholl analyses. Averaged process intersections at each spherical point emanating from the astrocyte cell body is displayed. Left column and first graph in the right column (a–e) displays cortical regions, anterior cingulate cortex (ACC) (a), primary sensorimotor cortex (SM1) (b), primary auditory cortex (A1) (c), ventral premotor cortex (A6Va) (d), area 45 (A45) (e) and the rest of the right column (f–h) illustrates midbrain regions, central nucleus of the amygdala (CeA) (f), ventral tegmental area (VTA) (g), periaqueductal gray (PAG) (h)
FIGURE 7
FIGURE 7
Morphometric features of cortical and midbrain astrocytes. Group morphological data obtained using sholl analysis: (a) number of primary branches, (b) number of branch points, (c) number of terminal points, and (d) process length of anterior cingulate cortex (ACC) (n = 18), ventral premotor cortex (A6Va) (n = 18), area 45 (A45) (n = 18), primary sensorimotor cortex (SM1) (n = 18), primary auditory cortex (A1) (n = 18), central nucleus of the amygdala (CeA) (n = 19), ventral tegmental area (VTA) (n = 18), and periaqueductal gray (PAG) (n = 18) (see Table 2 for more details). On average, cortical astrocytes have longer processes, more branch points, and terminal points. All statistical differences are indicated in results section and Table S1
FIGURE 8
FIGURE 8
Convex hull analysis of cortical and midbrain astrocytes. Summary of data from convex hull volume (a) and surface area (b) analyses in anterior cingulate cortex (ACC) (n = 18), ventral premotor cortex (A6Va) (n = 18), area 45 (A45) (n = 18), primary sensorimotor cortex (SM1) (n = 18), primary auditory cortex (A1) (n = 18), central nucleus of the amygdala (CeA) (n = 19), ventral tegmental area (VTA) (n = 18), and periaqueductal gray (PAG) (n = 18). On average, SM1 astrocytes have a larger volume and surface area compared to the astrocytes in the other regions evaluated
FIGURE 9
FIGURE 9
Complexity indices of astrocytes in cortical and midbrain regions. Comparison of data in each region measuring the morphological complexity of astrocytes. This measurement was obtained using a complexity index (see Methods) applied to the semi‐automatic reconstructed astrocytes in the regions of interest. Overall, cortical astrocytes were more complex compared to midbrain astrocytes

References

    1. Althammer, F. , Ferreira‐Neto, H. C. , Rubaharan, M. , Roy, R. K. , Patel, A. A. , Murphy, A. , Cox, D. N. , & Stern, J. E. (2020). Three‐dimensional morphometric analysis reveals time‐dependent structural changes in microglia and astrocytes in the central amygdala and hypothalamic paraventricular nucleus of heart failure rats. Journal of Neuroinflammation, 17, 221. - PMC - PubMed
    1. Anderson, C. M. , & Swanson, R. A. (2000). Astrocyte glutamate transport: Review of properties, regulation, and physiological functions. Glia, 32, 1–14. - PubMed
    1. Angelova, P. R. , Kasymov, V. , Christie, I. , Sheikhbahaei, S. , Turovsky, E. , Marina, N. , Korsak, A. , Zwicker, J. , Teschemacher, A. G. , Ackland, G. L. , Funk, G. D. , Kasparov, S. , Abramov, A. Y. , & Gourine, A. V. (2015). Functional oxygen sensitivity of astrocytes. The Journal of Neuroscience, 35, 10460–10473. - PMC - PubMed
    1. Araque, A. , Carmignoto, G. , Haydon, P. G. , Oliet, S. H. R. , Robitaille, R. , & Volterra, A. (2014). Gliotransmitters travel in time and space. Neuron, 81, 728–739. - PMC - PubMed
    1. Bakola, S. , Burman, K. J. , & Rosa, M. G. P. (2015). The cortical motor system of the marmoset monkey (Callithrix jacchus). Neuroscience Research, 93, 72–81. - PubMed

Publication types