. 2021 Aug 13:10:e66857.
doi: 10.7554/eLife.66857.

Patterns of within-host genetic diversity in SARS-CoV-2

Affiliations

Patterns of within-host genetic diversity in SARS-CoV-2

Gerry Tonkin-Hill et al. Elife. .

Abstract

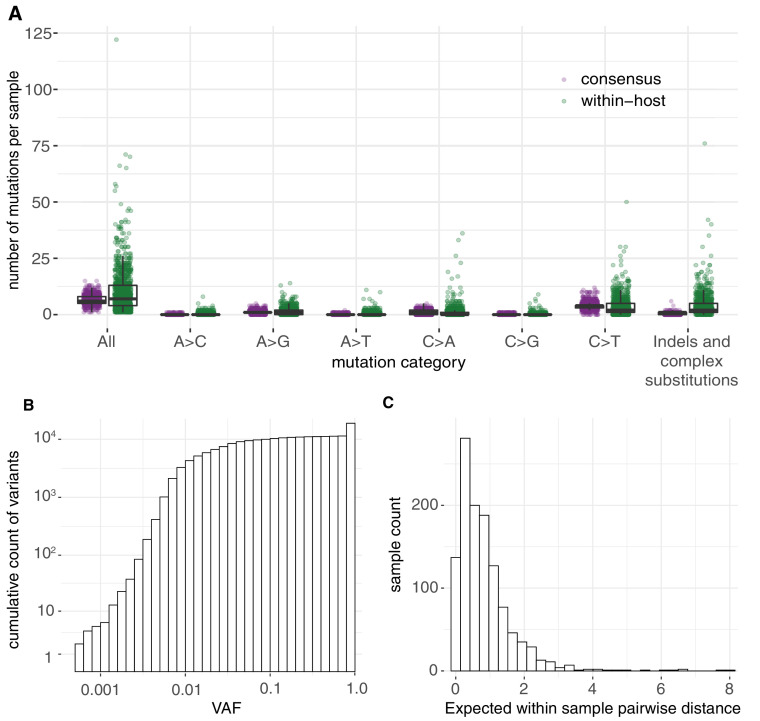
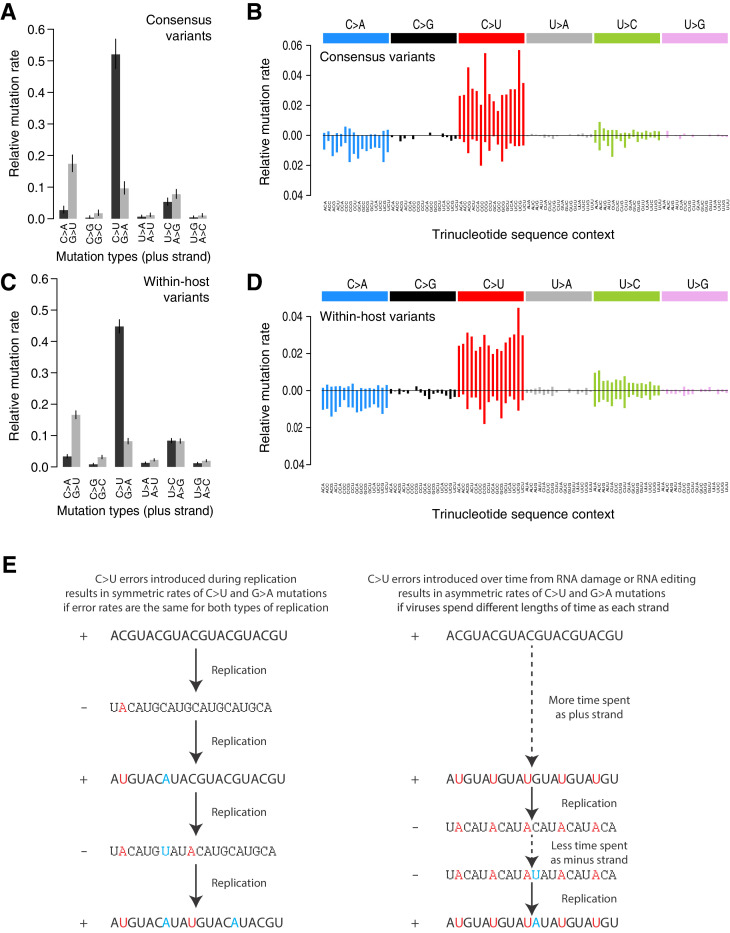
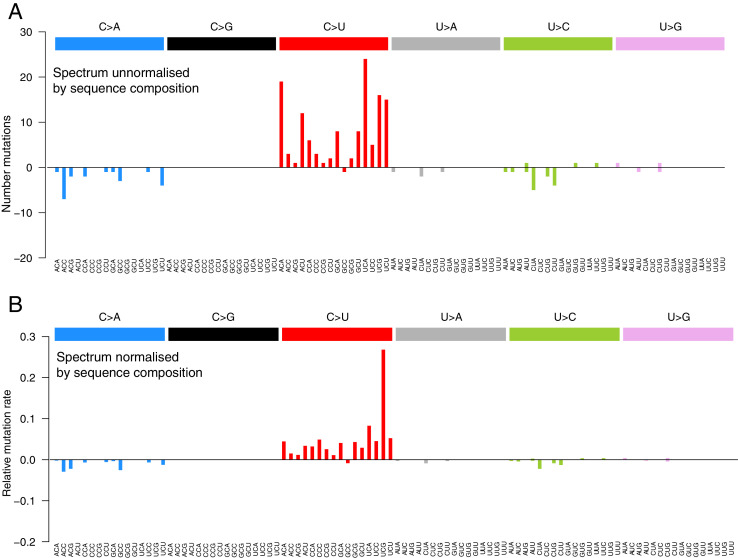
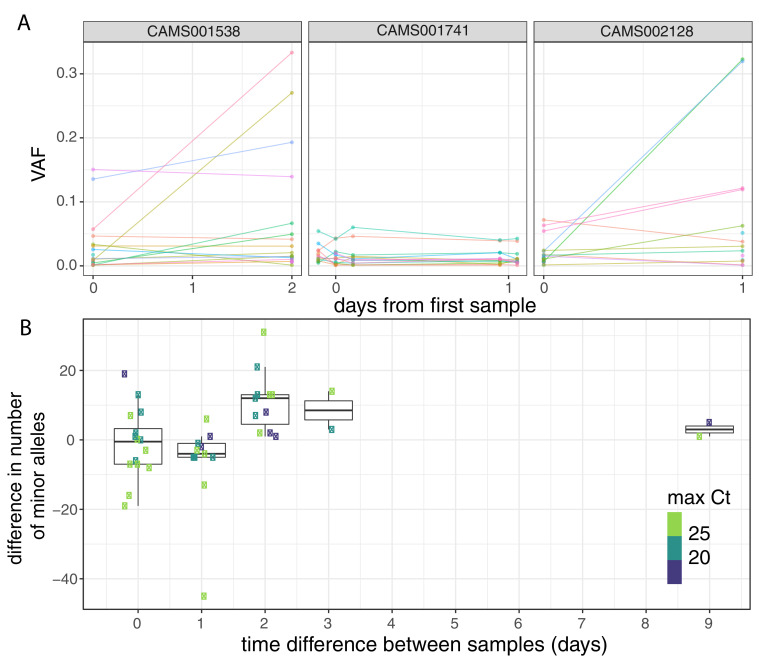
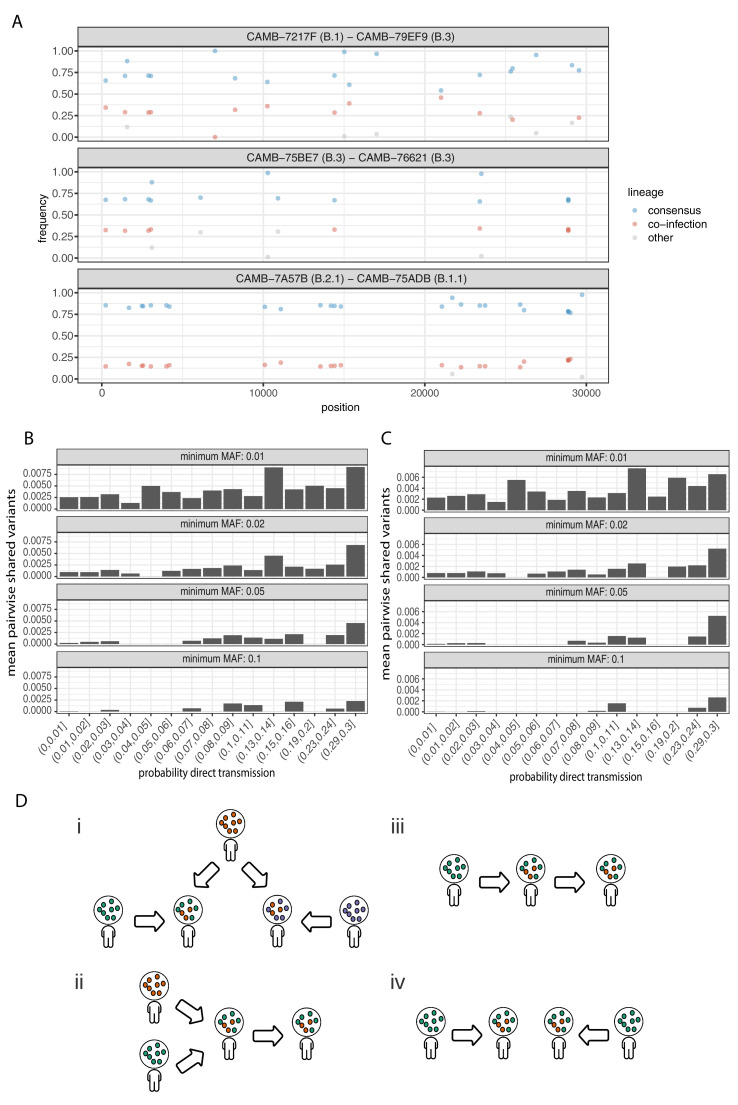
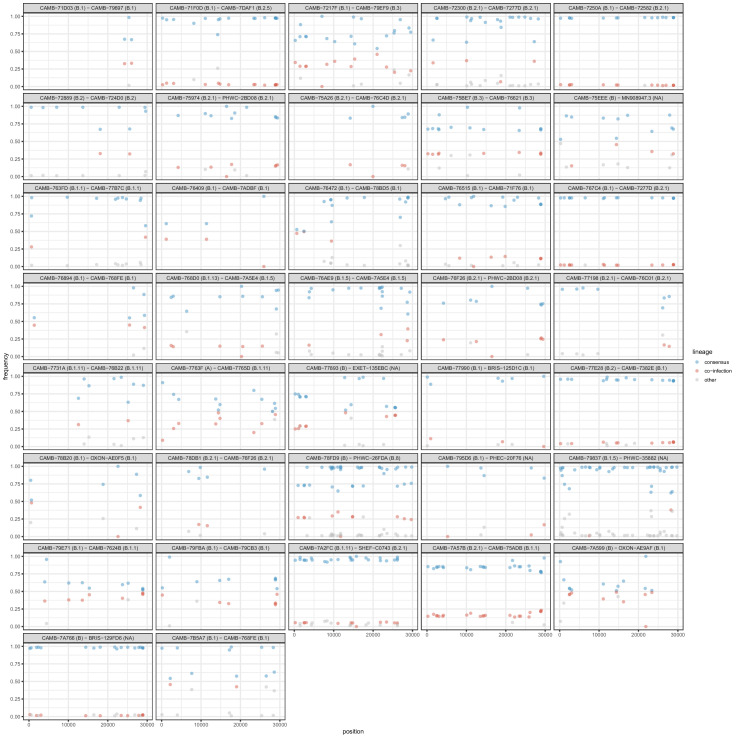
Monitoring the spread of SARS-CoV-2 and reconstructing transmission chains has become a major public health focus for many governments around the world. The modest mutation rate and rapid transmission of SARS-CoV-2 prevents the reconstruction of transmission chains from consensus genome sequences, but within-host genetic diversity could theoretically help identify close contacts. Here we describe the patterns of within-host diversity in 1181 SARS-CoV-2 samples sequenced to high depth in duplicate. 95.1% of samples show within-host mutations at detectable allele frequencies. Analyses of the mutational spectra revealed strong strand asymmetries suggestive of damage or RNA editing of the plus strand, rather than replication errors, dominating the accumulation of mutations during the SARS-CoV-2 pandemic. Within- and between-host diversity show strong purifying selection, particularly against nonsense mutations. Recurrent within-host mutations, many of which coincide with known phylogenetic homoplasies, display a spectrum and patterns of purifying selection more suggestive of mutational hotspots than recombination or convergent evolution. While allele frequencies suggest that most samples result from infection by a single lineage, we identify multiple putative examples of co-infection. Integrating these results into an epidemiological inference framework, we find that while sharing of within-host variants between samples could help the reconstruction of transmission chains, mutational hotspots and rare cases of superinfection can confound these analyses.

Keywords: SARS-CoV-2; epidemiology; genetics; genomics; global health; mutational spectrum; transmission; within-host.

Plain language summary

The COVID-19 pandemic has had major health impacts across the globe. The scientific community has focused much attention on finding ways to monitor how the virus responsible for the pandemic, SARS-CoV-2, spreads. One option is to perform genetic tests, known as sequencing, on SARS-CoV-2 samples to determine the genetic code of the virus and to find any differences or mutations in the genes between the viral samples. Viruses mutate within their hosts and can develop into variants that are able to more easily transmit between hosts. Genetic sequencing can reveal how genetically similar two SARS-CoV-2 samples are. But tracking how SARS-CoV-2 moves from one person to the next through sequencing can be tricky. Even a sample of SARS-CoV-2 viruses from the same individual can display differences in their genetic material or within-host variants. Could genetic testing of within-host variants shed light on factors driving SARS-CoV-2 to evolve in humans? To get to the bottom of this, Tonkin-Hill, Martincorena et al. probed the genetics of SARS-CoV-2 within-host variants using 1,181 samples. The analyses revealed that 95.1% of samples contained within-host variants. A number of variants occurred frequently in many samples, which were consistent with mutational hotspots in the SARS-CoV-2 genome. In addition, within-host variants displayed mutation patterns that were similar to patterns found between infected individuals. The shared within-host variants between samples can help to reconstruct transmission chains. However, the observed mutational hotspots and the detection of multiple strains within an individual can make this challenging. These findings could be used to help predict how SARS-CoV-2 evolves in response to interventions such as vaccines. They also suggest that caution is needed when using information on within-host variants to determine transmission between individuals.


Conflict of interest statement

GT, IM, RA, AL, MG, IJ, DJ, NP, SL, MQ, SG, CA, MS, WH, LM, GH, AJ, YC, MH, MP, IG, AY, LC, SC, TF, FK, CH, MC, SP, AA, RN, EH, JS, SB, JB, MT, IG, CL, DK No competing interests declared

Figures

Figure 1.
Figure 1.. Allele frequencies and mutation burden.
(A) Number of variants per sample (y-axis) for each mutation type assuming the reference genome as the ancestral allele. (B) A cumulative histogram of the VAFs of all mutation calls. Note that variants shared across samples are counted multiple times and that the 7672 consensus variants correspond to 1079 different changes in 1063 different sites. (C) Histogram of the expected number of mutations separating two randomly sampled genomes for each sample (Materials and methods).
Figure 1—figure supplement 1.
Figure 1—figure supplement 1.. Barplots indicating the mean sequencing depth across the SARS-CoV-2 reference genome for the two replicate runs of the 1181 samples.
Figure 1—figure supplement 2.
Figure 1—figure supplement 2.. Dot plots indicating the concordance between variant allele frequency estimates across sequencing replicates in four samples.
Figure 1—figure supplement 3.
Figure 1—figure supplement 3.. Estimated overdispersion of variant frequencies and the distribution of sample Ct values.
(A) Histogram of estimated log10(ρ) values. ρ represents the dispersion parameter from the Beta-binomial model of variant frequencies. Green line represents ρ=0.02 in (A) and (C), as a suggested acceptable level of discordance between replicates. 58% of all samples in the cohort had ρ0.02. (B) Histogram of Ct values in the cohort. (C) Estimated ρ value as a function of Ct. (D) Number of within-host variants as a function of Ct.
Figure 1—figure supplement 4.
Figure 1—figure supplement 4.. The distribution of the number of variable sites in coding regions among different coding positions.
Variable sites are dominated by those seen at the third codon position similar to that observed in Dyrdak et al., 2019. At higher frequencies, the reduction in the total number of variants leads to increased variabilitly.
Figure 2.
Figure 2.. Mutational spectra.
(A, C) Mutational spectra (without sequence context) of consensus (A) and within-host (C) variants, as mapped to the reference strand and normalised for the composition of nucleotides in the reference genome (MN908947.3). Rates reflect the fraction of the total number of mutations observed. Asymmetries suggest different mutation rates in the plus and minus strands. Error bars depict Poisson 95% confidence intervals. (B, D) Mutational spectra in a 96-trinucleotide context of consensus (B) and within-host (D) variants, as in Alexandrov et al., 2013. Mutations are represented as mapped to the pyrimidine base, depicted above the horizontal line if the pyrimidine base is in the reference (plus) strand and below it if the pyrimidine base is in the minus strand. Within-host variants observed across more than one sample can represent a single ancestral event or multiple independent events. To prevent highly recurrent events from distorting the spectrum, within-host variants observed across multiple samples were counted a maximum of five times in (C, D). (E) A diagram illustrating how asymmetrical mutation rates of C>U and G>A could be driven by viral sequences spending a longer time as plus strand molecules.
Figure 2—figure supplement 1.
Figure 2—figure supplement 1.. The mutational spectra in a 96-trinucleotide context of recurrent within-host variants.
Figure 3.
Figure 3.. Longitudinal differences in within-host variant frequencies.
(A) Frequencies of within-host variants for three selected hosts where multiple samples were taken over consecutive days. Samples taken on the same day have been offset by a small distance. Plots for all hosts with multiple samples are given in Figure 3—figure supplement 1. (B) The difference in the number of within-host variants between pairwise combinations of samples taken from the same host. The order for samples taken on the same day was randomised, and the colour of the point indicates the maximum of the two Ct values for the corresponding samples.
Figure 3—figure supplement 1.
Figure 3—figure supplement 1.. Frequencies of within-host variants for all hosts where multiple samples were taken over consecutive days.
Samples taken on the same day have been offset by a small distance to allow for comparison.
Figure 3—figure supplement 2.
Figure 3—figure supplement 2.. Proportion of shared variants between each pair of samples taken from the same host on the same day.
Pairs are split by sampling method, which included sputum, swabs, and bronchoalveolar lavage.
Figure 4.
Figure 4.. Patterns of selection and recurrent within-host variants.
(A) Genome-wide dN/dS ratios for missense and nonsense mutations (Materials and methods). Error bars depict 95% confidence intervals from the Poisson maximum-likelihood model. (B) ≥VAFs of within-host variants as a function of their predicted coding impact. p-values were calculated with Wilcoxon tests. (C) The top panel depicts the coordinates of the annotated peptides in the reference genome, coloured according to their ORF. The bottom panel depicts the frequency at which recurrent within-host variants (defined as those seeing in five or more samples) occur in the dataset. (D) Frequency of recurrent within-host variants (as in C) across different genomic backgrounds in the dataset (defined as the set of consensus variants in the sample). (E) Heatmaps of variant allele frequencies in samples containing three common within-host variants found at potential mutational hotspots are shown. The diversity of consensus variants with VAF ≥ 95% (black tiles) across samples is better explained by independent acquisitions of the minority variant rather than transmission.
Figure 5.
Figure 5.. The distribution of shared within-host variants between samples with respect to the inferred consensus phylogeny.
(A) A maximum-likelihood phylogeny of all COG-UK consensus genomes available on 29 May 2020. Red dots indicate the location of those samples that were deep sequenced in replicate. (B) The same phylogeny restricted to those samples taken for deep sequencing. (C) The region each patient’s home address was located. (D) Links are drawn between tips of the phylogeny that share within-host minority. Links restricted to those variants seen in less than 2% of individuals and are separated based on the number of variants shared between samples.
Figure 6.
Figure 6.. Potential mixed infections and the relationship between transmission and shared within-host variants.
(A) An example of three samples identified as potential mixtures. The consensus lineage is given first and coloured blue, while the potentially co-infecting lineage is given second and coloured red. Minority variants that do not match the co-infecting lineage are coloured grey. (B) The mean number of shared iSNVs shared by each pair of samples binned by the probability they were the result of a direct transmission according to the model of Stimson et al., 2019. Results, with a minimum minor allele frequency of 0.01, 0.02, 0.05, and 0.1 are shown in each of the facets. Within-host variants observed in more than 2% of samples were excluded. (C) The same plot as Figure 3B but having removed all samples that were inferred to be mixed infections. (D) A diagram demonstrating the four scenarios that can lead to shared within-host variants. (i) Superinfection of a common strain. (ii) Superinfection followed by co-transmission (iii) Transmission of the within-host variants through a large bottleneck. (iv) Independent de novo acquisitions of the same within-host variants. Shared within-host variants in scenarios (ii, iii) are concordant with the transmission tree, while (i, iv) are discordant, potentially confounding transmission inference efforts.
Figure 6—figure supplement 1.
Figure 6—figure supplement 1.. All samples identified as potential mixtures.
The consensus lineage is given first and coloured blue while the potentially co-infecting lineage is given second and coloured red. Minority variants that do not match the co-infecting lineage are coloured grey.

References

    1. Alexandrov LB, Nik-Zainal S, Wedge DC, Aparicio SA, Behjati S, Biankin AV, Bignell GR, Bolli N, Borg A, Børresen-Dale AL, Boyault S, Burkhardt B, Butler AP, Caldas C, Davies HR, Desmedt C, Eils R, Eyfjörd JE, Foekens JA, Greaves M, Hosoda F, Hutter B, Ilicic T, Imbeaud S, Imielinski M, Imielinsk M, Jäger N, Jones DT, Jones D, Knappskog S, Kool M, Lakhani SR, López-Otín C, Martin S, Munshi NC, Nakamura H, Northcott PA, Pajic M, Papaemmanuil E, Paradiso A, Pearson JV, Puente XS, Raine K, Ramakrishna M, Richardson AL, Richter J, Rosenstiel P, Schlesner M, Schumacher TN, Span PN, Teague JW, Totoki Y, Tutt AN, Valdés-Mas R, van Buuren MM, van 't Veer L, Vincent-Salomon A, Waddell N, Yates LR, Zucman-Rossi J, Futreal PA, McDermott U, Lichter P, Meyerson M, Grimmond SM, Siebert R, Campo E, Shibata T, Pfister SM, Campbell PJ, Stratton MR, Australian Pancreatic Cancer Genome Initiative. ICGC Breast Cancer Consortium. ICGC MMML-Seq Consortium. ICGC PedBrain Signatures of mutational processes in human Cancer. Nature. 2013;500:415–421. doi: 10.1038/nature12477. - DOI - PMC - PubMed
    1. Alexandrov LB, Kim J, Haradhvala NJ, Huang MN, Tian Ng AW, Wu Y, Boot A, Covington KR, Gordenin DA, Bergstrom EN, Islam SMA, Lopez-Bigas N, Klimczak LJ, McPherson JR, Morganella S, Sabarinathan R, Wheeler DA, Mustonen V, Getz G, Rozen SG, Stratton MR, PCAWG Mutational Signatures Working Group. PCAWG Consortium The repertoire of mutational signatures in human Cancer. Nature. 2020;578:94–101. doi: 10.1038/s41586-020-1943-3. - DOI - PMC - PubMed
    1. Arias A, Watson SJ, Asogun D, Tobin EA, Lu J, Phan MVT, Jah U, Wadoum REG, Meredith L, Thorne L, Caddy S, Tarawalie A, Langat P, Dudas G, Faria NR, Dellicour S, Kamara A, Kargbo B, Kamara BO, Gevao S, Cooper D, Newport M, Horby P, Dunning J, Sahr F, Brooks T, Simpson AJH, Groppelli E, Liu G, Mulakken N, Rhodes K, Akpablie J, Yoti Z, Lamunu M, Vitto E, Otim P, Owilli C, Boateng I, Okoror L, Omomoh E, Oyakhilome J, Omiunu R, Yemisis I, Adomeh D, Ehikhiametalor S, Akhilomen P, Aire C, Kurth A, Cook N, Baumann J, Gabriel M, Wölfel R, Di Caro A, Carroll MW, Günther S, Redd J, Naidoo D, Pybus OG, Rambaut A, Kellam P, Goodfellow I, Cotten M. Rapid outbreak sequencing of ebola virus in sierra Leone identifies transmission chains linked to sporadic cases. Virus Evolution. 2016;2:vew016. doi: 10.1093/ve/vew016. - DOI - PMC - PubMed
    1. Black JRM, Bailey C, Przewrocka J, Dijkstra KK, Swanton C. COVID-19: the case for health-care worker screening to prevent hospital transmission. The Lancet. 2020;395:1418–1420. doi: 10.1016/S0140-6736(20)30917-X. - DOI - PMC - PubMed
    1. Bull M. A Nextflow pipeline for running the ARTIC network’s fieldbioinformatics tools with a focus on ncov2019. AGPL-3.0Github. 2020 https://github.com/connor-lab/ncov2019-artic-nf

Publication types