Case Reports
. 2021 Oct 4;218(10):e20201560.
doi: 10.1084/jem.20201560. Epub 2021 Aug 13.

Enhanced cGAS-STING-dependent interferon signaling associated with mutations in ATAD3A

Affiliations
Case Reports

Enhanced cGAS-STING-dependent interferon signaling associated with mutations in ATAD3A

Alice Lepelley et al. J Exp Med. .

Abstract

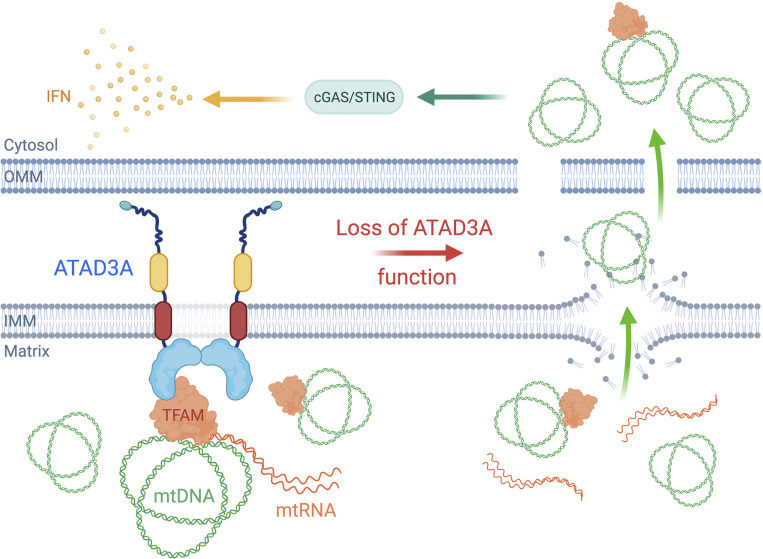
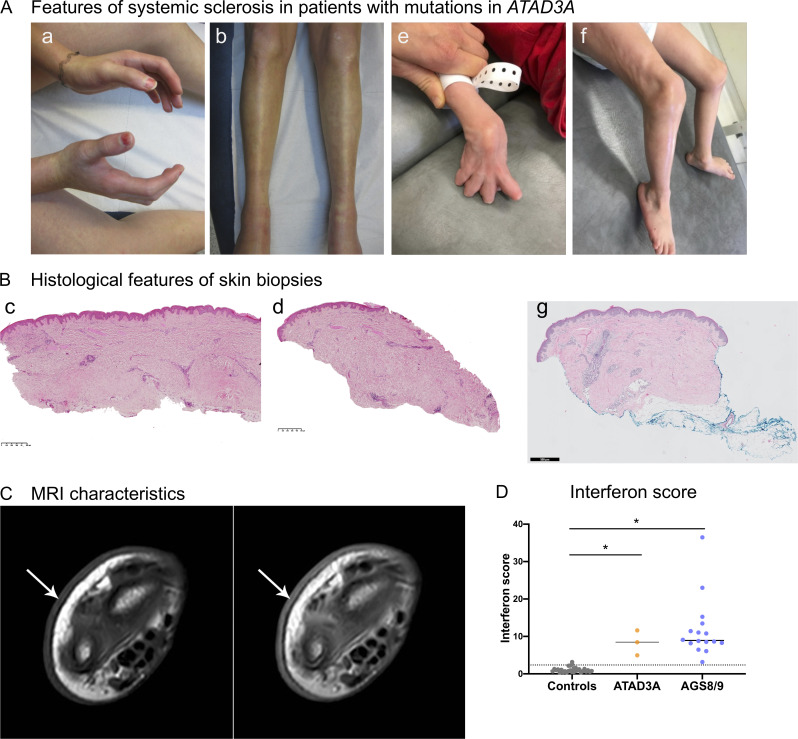
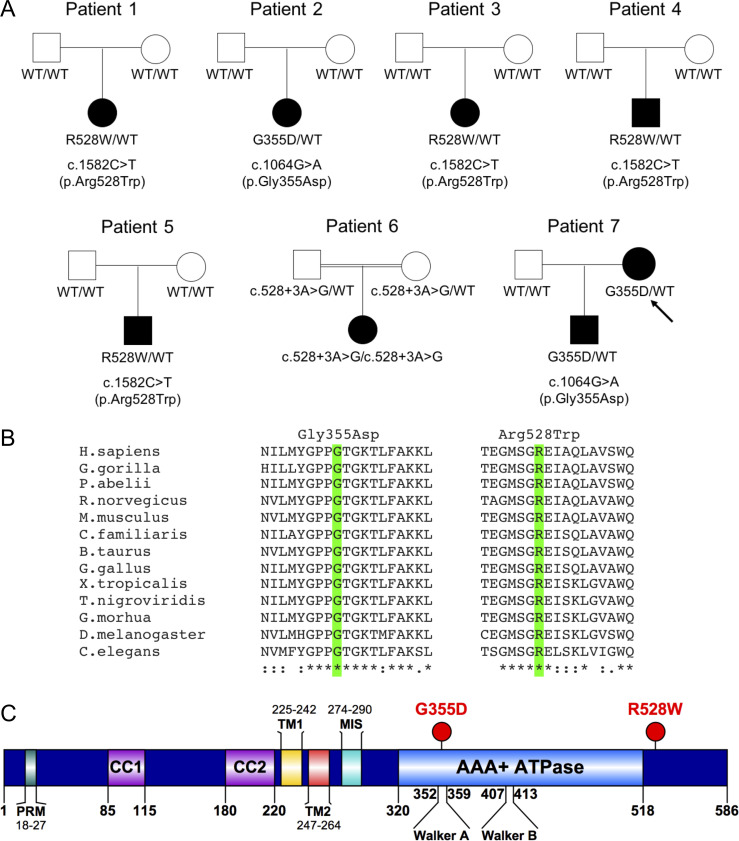
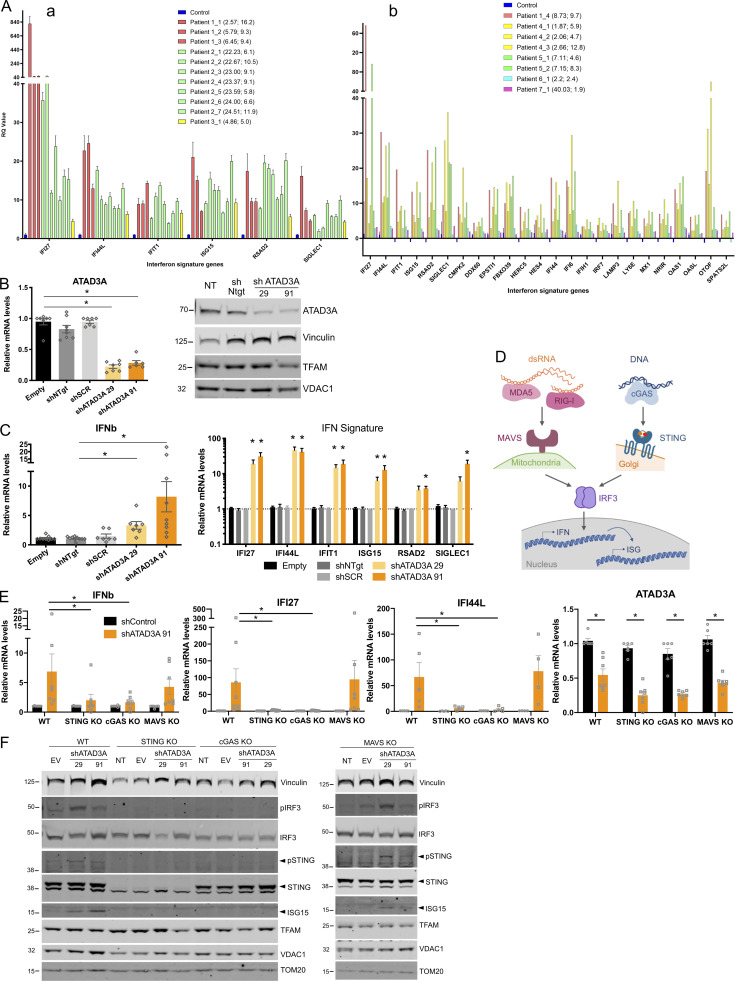
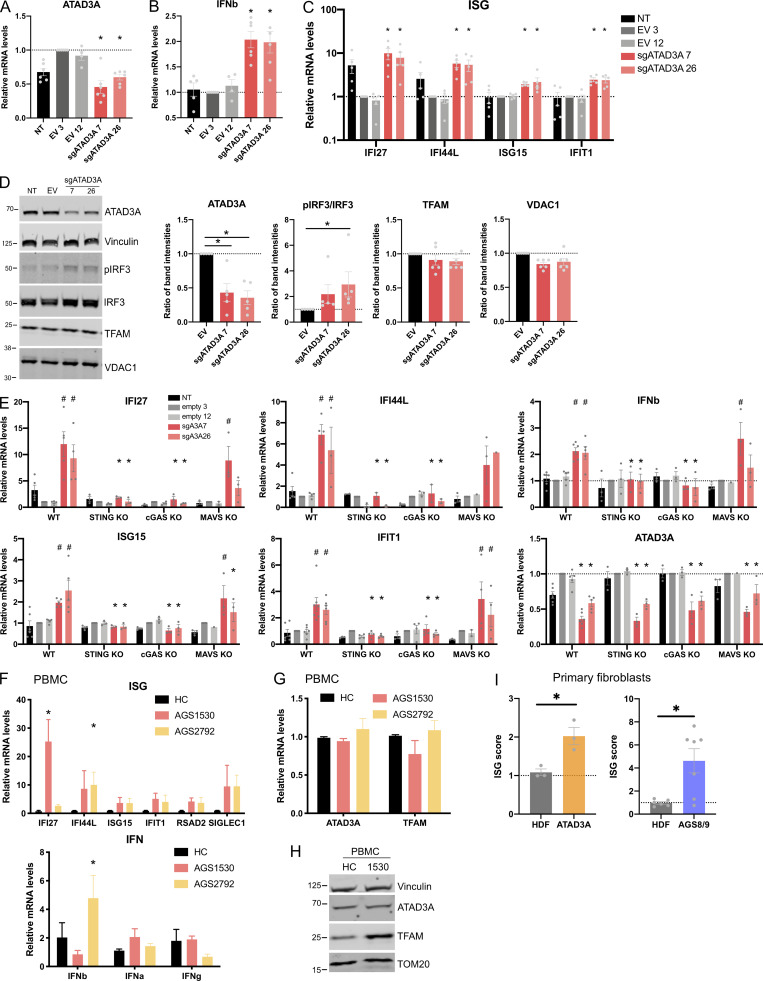
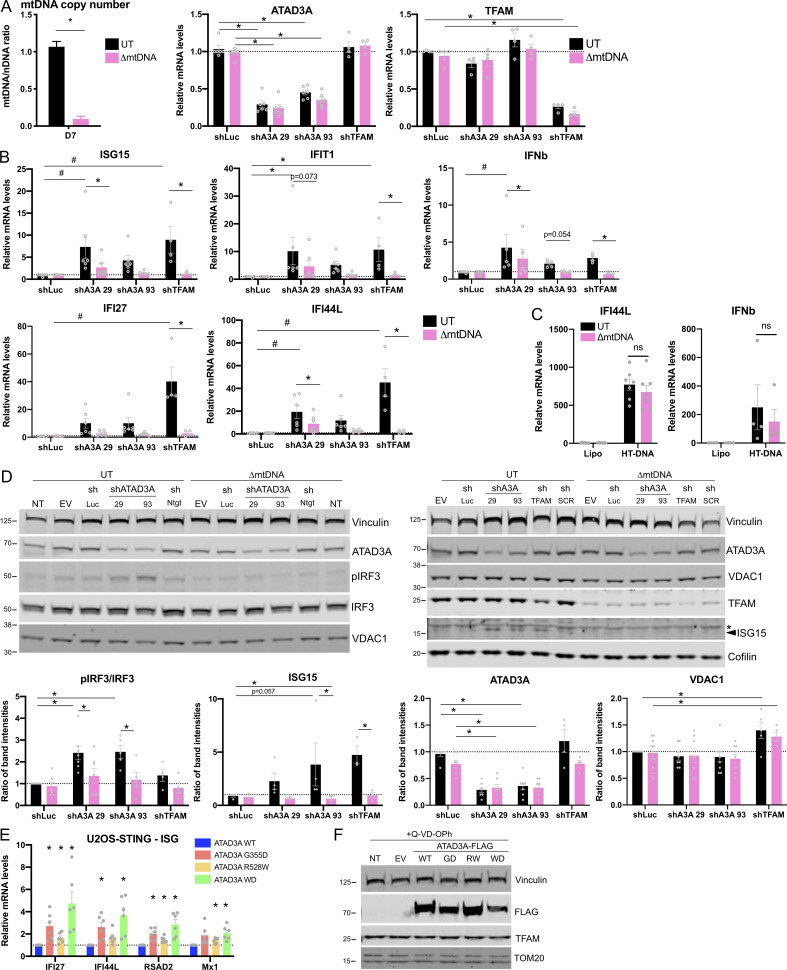
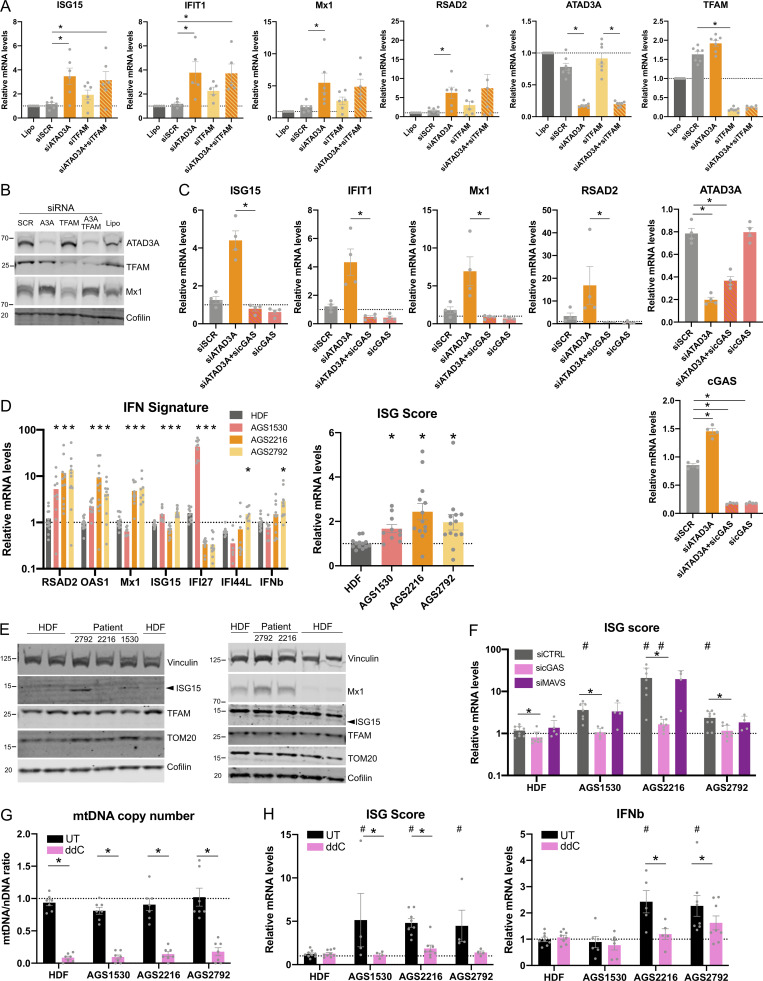
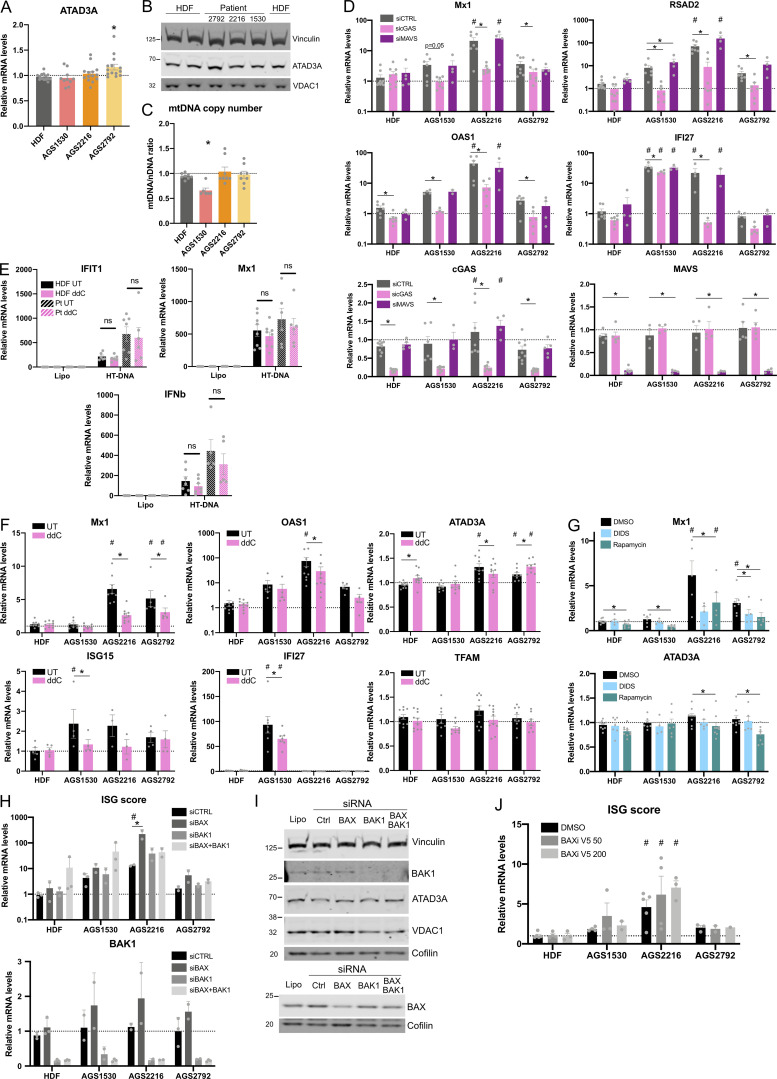
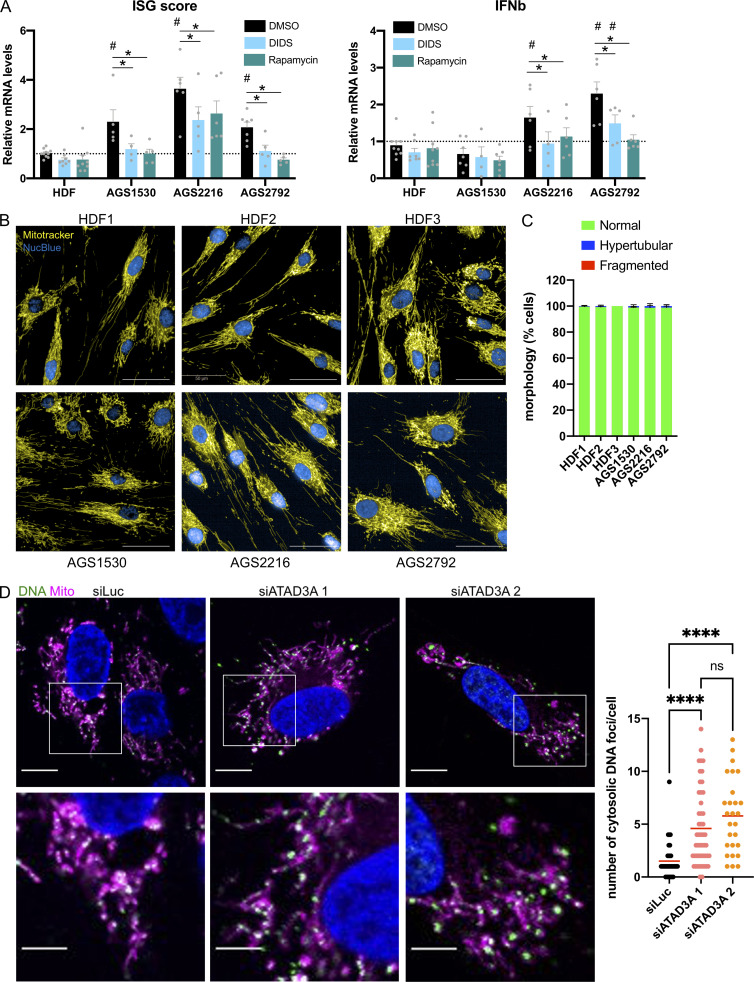
Mitochondrial DNA (mtDNA) has been suggested to drive immune system activation, but the induction of interferon signaling by mtDNA has not been demonstrated in a Mendelian mitochondrial disease. We initially ascertained two patients, one with a purely neurological phenotype and one with features suggestive of systemic sclerosis in a syndromic context, and found them both to demonstrate enhanced interferon-stimulated gene (ISG) expression in blood. We determined each to harbor a previously described de novo dominant-negative heterozygous mutation in ATAD3A, encoding ATPase family AAA domain-containing protein 3A (ATAD3A). We identified five further patients with mutations in ATAD3A and recorded up-regulated ISG expression and interferon α protein in four of them. Knockdown of ATAD3A in THP-1 cells resulted in increased interferon signaling, mediated by cyclic GMP-AMP synthase (cGAS) and stimulator of interferon genes (STING). Enhanced interferon signaling was abrogated in THP-1 cells and patient fibroblasts depleted of mtDNA. Thus, mutations in the mitochondrial membrane protein ATAD3A define a novel type I interferonopathy.


Conflict of interest statement

Disclosures: E. Van Nieuwenhove reported grants from FWO/Research Foundation Flanders (SB grant 1S22718N) during the conduct of the study. No other disclosures were reported.

Figures

None
Graphical abstract
Figure S1.
Figure S1.
Clinical, histological, and imaging features of systemic sclerosis seen in patients 2 and 3 and IFN score in ATAD3A and AGS8/9 patients. (A) Clinical features of systemic sclerosis seen in patients 2 and 3. Subpanels a and b highlight sclerodermatous involvement of the hands and legs of patient 2 at 22 yr of age. Similar features were observed in patient 3 at age 4 yr (subpanels e and f). (B) Features of systemic sclerosis seen on skin biopsy. Subpanels c, d, and g demonstrate the appearances on skin biopsy observed in patients 2 and 3, respectively. In subpanel c, the overlying epidermis is normal, while the dermis is increased in thickness and composed of broad sclerotic collagen bundles extending into the subcutis and replacing fat. The deep dermis shows homogenized collagen and is devoid of elastic tissue. In addition, eccrine glands are very atrophic. The arrectores pilorum of the hair follicles are only recognizable in the upper part of the dermis, because the epithelium is almost completely absent. Subpanel d is from another part of the biopsy, showing the same changes with, in addition, perivascular lymphocytic infiltrate in the deep dermis. In subpanel g, similar changes are seen to those observed in patient 2, but with skin adnexae (hair follicles and sweat glands) still present, consistent with an earlier stage in the same disease spectrum. Scale bars, 500 µm. (C) MRI of right forearm of patient 3. Left: Turbo spin-echo T1 sequence before contrast shows diffuse cutaneous thickening in the right forearm, most pronounced on the dorsal-ulnar aspect. Right: Turbo spin-echo T1 sequence after contrast administration (Dotarem 0.5 mmol/ml). Arrows indicate signal in the thickened cutis before and after enhancement. (D) Dot plot showing the IFN score calculated from the median fold change of six ISGs measured in blood of ATAD3A patients 1, 2, and 3 and AGS8/9 patients. Average of one to eight serial samples for each patient is represented. * indicates statistical significance (P < 0.05) in a t test. Data for AGS8/9 patients are from Uggenti et al. (2020).
Figure 1.
Figure 1.
ATAD3A genetic data. (A) Family structures relating to patients 1–7. Solid symbols indicate the affected patients, open symbols indicate unaffected parents, squares indicate males, circles indicate females, and the double line indicates consanguinity. Genotype is indicated below each individual. Genomic mutation (NM_001170535) and amino acid changes are detailed below each family. Arrow indicates patient 7. (B) Evolutionary conservation of the ATAD3A amino acid substitutions p.(Gly355Asp; G355D) and p.(Arg528Trp; R528W; highlighted in green). (C) Domains of the ATAD3A protein, and the position of the p.(Gly355Asp) and p.(Arg528Trp) substitutions. G355 is located in the ATP-binding (Walker A) subdomain of the AAA+ ATPase domain. R528 is located in the C-terminus of ATAD3A after the AAA+ ATPase domain. PRM, proline-rich motif; CC, coiled-coil domain; TM, transmembrane domain; MIS, mitochondrial import signal. The homozygous c.528+3A>G splice-site variant identified in patient 6, leading to a loss of ATAD3A protein expression, is not depicted.
Figure 2.
Figure 2.
ATAD3A dysfunction leads to up-regulated IFN signaling in patient blood and in THP-1 cells through the cGAS-STING pathway. (A) Enhanced ISG mRNA expression in peripheral whole blood recorded in five of seven patients with ATAD3A mutations. Subpanel a shows the expression of six ISGs measured using TaqMan probes, and subpanel b shows a larger panel of 24 genes assessed using a NanoString platform. Colored bars indicate different patients. The first number in the brackets is the decimalized age at the time of sampling and the second the IFN score (calculated according to the median fold change in relative quantification of the ISGs compared with 29 (a) or 27 (b) controls (blue bars; normal < 2.466 [a] or < 2.75 [b]). (B) Knockdown of ATAD3A gene expression (qPCR; left) and of ATAD3A protein (Western blot; right) in THP-1 cells using two shRNAs (shATAD3A 29 and shATAD3A 91) compared with controls (transduction with a vector with no shRNA [Empty], two different unspecific scrambled shRNAs [shNTgt and shSCR]) or non-transduced (NT) and analyzed 4 d later. For qPCR, mean values of six or seven independent experiments are shown and are expressed as the ratio of the mRNA levels, normalized to housekeeping gene HPRT mRNA, in indicated conditions to that in the empty condition. * indicates statistical significance (P < 0.05) using a Kruskal–Wallis test with Dunn’s post hoc. Western blot images are representative of four experiments. VDAC1 and TFAM are mitochondrial proteins, and vinculin is a loading control. (C) Knockdown of ATAD3A leads to increased expression of the IFN-β (IFNb) gene and six representative ISGs (IFI27, IFI44L, IFIT1, ISG15, RSAD2, and SIGLEC1) compared with control vectors (Empty, shNTgt, and shSCR) in cells treated as in B. Mean values of 7–10 independent experiments are shown and are expressed as the ratio of the mRNA levels, normalized to housekeeping gene HPRT mRNA, in indicated conditions to that in the empty condition. For IFNb, * indicates significance (P < 0.05) in Kruskal–Wallis test with Dunn’s post hoc. For ISGs, * indicates statistical significance (P < 0.05) in two-way ANOVA with Dunnett’s multiple comparison test to shSCR. (D) Schematic of cytosolic nucleic acid sensing pathways; cytosolic dsRNA is sensed by RIG-I like receptors RIG-I and MDA5, triggering MAVS activation situated on mitochondria, and cytosolic DNA is detected by cGAS, signaling through STING on Golgi membranes. Subsequently, upon phosphorylation and dimerization, transcription factor IRF3 induces the expression of IFN-β (IFN), leading to the up-regulation of ISG expression. (E) Knockdown of ATAD3A with shATAD3A 91 in WT THP-1 cells and in cells null for either cGAS, STING, or MAVS. The increased expression of IFN-β (IFNb) and two representative ISGs (IFI27 and IFI44L) seen in WT THP-1 cells is lost in cells that are null (KO) for either cGAS or STING, while THP-1 cells null for MAVS behave similar to WT cells. Mean values of seven to eight independent experiments are shown and are expressed as the ratio of the mRNA levels, normalized to housekeeping gene HPRT mRNA, in indicated conditions to that with control shRNA (“shControl”: shNTgt or shSCR). * indicates statistical significance (P < 0.05) using two-way ANOVA with Dunnett’s multiple comparison test. (F) Western blot analysis of ATAD3A knockdown compared with NT cells, or cells treated with an EV, showing an increase in the expression of phosphorylated IRF3, phosphorylated STING, and ISG15 (bottom band) protein in WT and MAVS KO cells, but not in STING KO or cGAS KO cells. One experiment representative of three is shown. TOM20, VDAC1, and TFAM are mitochondrial proteins, and vinculin is a loading control.
Figure S2.
Figure S2.
ATAD3A down-regulation by CRISPR editing in THP-1 cells and IFN signaling in ATAD3A and AGS8/9 patient primary cells. (A) qPCR of ATAD3A following knockdown of ATAD3A by CRISPR editing in THP-1 cell pools using two different guide RNAs (sgATAD3A 7, sgATAD3A 26) compared with NT cells and cells transduced with one of two EVs (EV 3 and 12). (B) Up-regulation of IFN-β (IFNb) mRNA expression. (C) Up-regulation of ISG (IFI27, IFI44L, ISG15, and IFIT1) mRNA expression. Mean values of five independent experiments are shown and are expressed as the ratio of the mRNA levels, normalized to housekeeping gene HPRT mRNA, in indicated conditions to that in control EV 3. * indicates significance (P < 0.05) using a Kruskal–Wallis test with Dunn’s post hoc compared with EV 3 for each ISG. (D) Increased phosphorylated IRF3 (pIRF3; blot on the left, quantification on the right). The specificity of ATAD3A knockdown is indicated by an absence of a change in the expression of either of the mitochondrial proteins TFAM (matrix) or VDAC1 (outer membrane). Quantification of band intensities is expressed as phosphorylated IRF3/total IRF3 ratio and protein levels normalized to vinculin, averaged across four to five independent experiments; EV is EV 3. (E) IFN-β (IFNb) and representative ISG (IFI27, IFI44L, ISG15, and IFIT1) mRNA expression upon knockdown of ATAD3A with CRISPR editing as in A in WT THP-1 cells and in cells null (KO) for cGAS, STING, or MAVS. Mean values of three to five independent experiments are shown and are expressed as the ratio of the mRNA levels, normalized to housekeeping gene HPRT mRNA, in indicated conditions to that with EV 3. * indicates statistical significance (P < 0.05) using two-way ANOVA with Dunnett’s multiple comparison test between cell lines for each CRISPR condition. # indicates statistical significance (P < 0.05) using two-way ANOVA with Dunnett’s multiple comparison test between CRISPR conditions for each cell line. (F and G) ISGs, IFN-β (IFNb), IFN-α 2a (IFNa), and IFN-γ (IFNg; F) and ATAD3A and TFAM (G) mRNA expression in PBMCs isolated from healthy control (HC) donors or ATAD3A patients 2 and 4 (AGS1530 and AGS2792, respectively). Mean values and data points of two to three different samples are shown and are expressed as the ratio of the mRNA levels, normalized to housekeeping gene HPRT mRNA, in indicated conditions to that in one healthy control. * indicates statistical significance (P < 0.05) in two-way ANOVA with Dunnett’s multiple comparison test to healthy controls for each probe. (H) Representative protein expression analysis of ATAD3A and TFAM expression in PBMCs by Western blot. TOM20 is an outer mitochondrial membrane protein, and vinculin a loading control. (I) ISG mRNA expression, represented as an ISG score (i.e., the median fold change of mRNA levels of six ISGs [RSAD2, OAS1, Mx1, IFI27, ISG15, and IFI44L] for ATAD3A or five ISGs [IFI27, IFI44L, IFIT1, ISG15, and RSAD2] for AGS8/9 in control and ATAD3A or AGS8/9 patient–derived primary fibroblasts. Summary mean value of 5–10 experiments for each cell line is shown. * indicates statistical significance (P < 0.05) in a t test. Data for AGS8/9 patients are from Uggenti et al. (2020).
Figure 3.
Figure 3.
IFN signaling upon ATAD3A silencing in THP-1 cells is dependent on the presence of mtDNA. (A) Left: Depletion of mtDNA in THP-1 cells. Graph shows qPCR analysis of mtDNA copy number per cell, expressed as the ratio of the DNA quantity of the mitochondrial gene (MT-COXII) over the nuclear gene (GAPDH), in total DNA isolated from UT THP-1 cells or cells treated for 7 d with low-dose ethidium bromide to deplete mtDNA (ΔmtDNA). The average of four independent experiments is shown. * indicates statistical significance (P < 0.05) using a Mann–Whitney test. Right: Knockdown of ATAD3A or TFAM assessed by qPCR using either of two shRNAs targeting ATAD3A (shA3A 29 and shA3A 93), or an shRNA targeting TFAM (shTFAM) in mtDNA-depleted THP-1 cells compared with control shRNA (shLuc). * indicates statistical significance ( P < 0.05) in two-way ANOVA with Dunnett’s multiple comparison test compared with respective shLuc. (B) Upon knockdown of either ATAD3A or TFAM, the increase in the expression of IFN-β (IFNb) and of four representative ISGs (ISG15, IFIT1, IFI27, and IFI44L) seen in UT THP-1 cells was lost when THP-1 cells depleted of mtDNA were used. Mean values of five to six independent experiments are shown and are expressed as the ratio of the mRNA levels, normalized to housekeeping gene HPRT mRNA, in indicated conditions to that in the control shLuc condition. # indicates statistical significance (P < 0.05) in two-way ANOVA with Dunnett’s multiple comparison test compared with respective shLuc, and * indicates statistical significance in two-way ANOVA with Sidak’s multiple comparison test comparing ΔmtDNA and UT conditions for each shRNA. (C) qPCR analysis of IFI44L and IFNb expression in UT or ΔmtDNA THP-1 cells after a 24-h stimulation with 1 µg/ml HT-DNA. Mean values of three to four independent experiments are shown. ns indicates non-significance in two-way ANOVA with Sidak’s multiple comparison test. (D) Western blot analysis of ATAD3A and TFAM knockdowns described in A compared with NT cells or cells treated with an EV or a control shRNA (shNTgt/shLuc), showing an increase in the expression of phosphorylated IRF3 (left) and ISG15 (right, bottom band; *, nonspecific band) proteins, abrogated by mtDNA depletion. Two representative experiments are shown. Quantification of band intensities is expressed as the ratio of phosphorylated IRF3/total IRF3 or the ratio of ISG15, ATAD3A, and VDAC1 (mitochondrial protein control) protein levels normalized to vinculin, averaged from four to seven independent experiments. * indicates statistical significance (P < 0.05) in two-way ANOVA with Sidak’s multiple comparison test comparing relevant shRNA to control shLuc in each cell line and comparing UT and mtDNA-depleted cells for each shRNA. (E) mRNA expression analysis assessed by qPCR of ISGs IFI27, IFI44L, RSAD2, and Mx1 in U2OS cells stably expressing STING (U2OS-STING), transfected with FLAG-tagged ATAD3A WT or mutant G355D, R528W, and WD plasmids, treated with 10 µM QVD-OPh after 24 h and harvested 24 h later. Expression levels are expressed as the fold of levels in WT transfected cells. Mean values of six independent experiments, statistically analyzed using two-way ANOVA and Dunnett’s multiple comparisons test (*, P < 0.05). (F) Western blot analysis of FLAG, vinculin, TFAM, and TOM20 in whole-cell lysates of U2OS-STING treated and harvested as in E (GD, G355D; RW, R528W). Representative results from four independent experiments.
Figure 4.
Figure 4.
IFN signaling in fibroblasts from ATAD3A patients is cGAS and mtDNA dependent. (A) ISGs, ATAD3A, and TFAM mRNA expression in control primary fibroblasts after down-regulation of ATAD3A (siATAD3A), TFAM (siTFAM), or both (siATAD3A+siTFAM) by siRNA, treatment with control siRNA (siSCR) or transfection reagent alone (Lipo) for 72 h, expressed as the ratio of the mRNA levels, normalized to housekeeping gene HPRT mRNA, in indicated conditions to that in siSCR. Mean values and data points of six to seven independent experiments are shown. * indicates statistical significance (P < 0.05) in Friedman test with Dunn’s multiple comparison test to the siSCR condition. (B) Protein expression in primary fibroblasts treated as in A of a representative ISG Mx1, ATAD3A, and TFAM assessed by Western blot. Cofilin is a loading control. (C) ISGs, ATAD3A, and cGAS mRNA expression in control primary fibroblasts after down-regulation of ATAD3A (siATAD3A), cGAS (sicGAS), or both (siATAD3A+sicGAS) by siRNA, treatment with control siRNA (siSCR) or transfection reagent alone (Lipo) for 72 h, expressed as in A. Mean values and data points of six to seven independent experiments are shown; three datasets are also displayed in A. * indicates statistical significance (P < 0.05) in Mann–Whitney test between siATAD3A and siATAD3A+sicGAS conditions for ISGs, or statistical significance (P < 0.05) in one-way ANOVA for ATAD3A and cGAS. (D) Left: ISG and IFN-β (IFNb) mRNA expression in primary fibroblasts from control human dermal fibroblasts (HDF; average of three) or from ATAD3A patients 2, 3, and 4 (AGS1530, AGS2216, and AGS2792, respectively), expressed as the ratio of the mRNA levels, normalized to housekeeping gene HPRT mRNA, in indicated conditions to that in one control HDF. Mean values and data points of 10–13 independent experiments are shown. * indicates statistical significance (P < 0.05) in two-way ANOVA with Dunnett’s multiple comparison test. Right: ISG mRNA expression represented as an ISG score (i.e., the median fold change of mRNA levels of six ISGs [RSAD2, OAS1, Mx1, IFI27, ISG15, and IFI44L]) in control and ATAD3A patient–derived primary fibroblasts shown on the left. * indicates statistical significance (P < 0.05) in Kruskal–Wallis test with Dunn’s multiple comparison. (E) Protein expression in patient-derived primary fibroblasts of two representative ISGs (ISG15 and Mx1) assessed by Western blot. TFAM and TOM20 are mitochondrial proteins, and cofilin and vinculin are loading controls. Arrowhead indicates relevant band for ISG15. (F) ISG mRNA expression, represented as an ISG score (i.e., the median fold change of mRNA levels of seven ISGs [RSAD2, OAS1, Mx1, IFI27, ISG15, IRF7, and IFI44L] expressed as in D) in control and ATAD3A patient–derived primary fibroblasts, after down-regulation of cGAS (sicGAS) or MAVS (siMAVS) by siRNA or treatment with control siRNA (siCTRL). Mean values and data points of six to nine independent experiments are shown. * indicates statistical significance (P < 0.05) in two-way ANOVA with Dunnett’s multiple comparison tests between siRNA conditions for each cell line, and # indicates statistical significance (P < 0.05) in two-way ANOVA with Dunnett’s multiple comparison test between control and patient-derived fibroblasts for each siRNA condition. (G) Depletion of mtDNA in patient-derived primary fibroblasts. Graph shows qPCR analysis of mtDNA copy number per cell, expressed as the ratio of the DNA quantity of the mitochondrial gene (MT-COXII) over the nuclear gene (GAPDH), in total DNA isolated from UT fibroblasts or cells treated for 7–14 d with 100 µM ddC to deplete mtDNA. The mean of seven independent experiments is shown. * indicates statistical significance (P < 0.05) in two-way ANOVA with Sidak’s multiple comparison test comparing ddC and UT conditions for each fibroblast line. (H) ISG mRNA expression, represented as an ISG score (i.e., the median fold change of mRNA levels of seven ISGs [RSAD2, OAS1, Mx1, IFI27, ISG15, IRF7, and IFI44L] expressed as in D) and IFN-β (IFNb) mRNA expression in control and ATAD3A patient–derived primary fibroblasts, UT or mtDNA-depleted by ddC as in G. Mean values and data points of three to eight independent experiments are shown. * indicates statistical significance (P < 0.05) in two-way ANOVA with Sidak’s multiple comparison test between UT and ddC conditions. # indicates statistical significance (P < 0.05) in two-way ANOVA with Dunnett’s multiple comparison test between control and patient-derived fibroblasts for each treatment.
Figure S3.
Figure S3.
Characteristics of IFN signaling induction in ATAD3A patient–derived fibroblasts. (A) ATAD3A mRNA expression in primary fibroblasts from controls (HDF; average of three) or from ATAD3A patients 2, 3, and 4 (AGS1530, AGS2216, and AGS2792, respectively). Mean values and data points of 10–14 independent experiments are shown and are expressed as the ratio of the mRNA levels, normalized to housekeeping gene HPRT mRNA, in indicated conditions to that in one control HDF. * indicates statistical significance (P < 0.05) in one-way ANOVA with Dunn’s multiple comparison test. (B) Protein expression of ATAD3A in primary fibroblasts assessed by Western blot. VDAC1 is a mitochondrial protein, and vinculin a loading control. (C) qPCR analysis of mtDNA copy number per cell, expressed as the ratio of the DNA quantity of the mitochondrial gene (MT-COXII) over the nuclear gene (GAPDH), in total DNA isolated from fibroblasts. The mean of eight independent experiments is shown. * indicates statistical significance (P < 0.05) in one-way ANOVA with Dunn’s multiple comparison test. (D) Representative ISG (Mx1, RSAD2, OAS1, and IFI27), cGAS, and MAVS mRNA expression, expressed as in A, in control and ATAD3A patient–derived primary fibroblasts, after down-regulation of cGAS (sicGAS) or MAVS (siMAVS) by siRNA or treatment with control siRNA (siCTRL). Mean values and data points of six to nine independent experiments are shown. * indicates statistical significance (P < 0.05) in two-way ANOVA with Dunnett’s multiple comparison tests between siRNA conditions for each cell line. # indicates statistical significance (P < 0.05) in two-way ANOVA with Dunnett’s multiple comparison test between control and patient-derived fibroblasts for each siRNA condition. (E) Representative ISG (IFIT1 and Mx1) and IFNb mRNA expression, expressed as in A, in control (HDF; three lines pooled) and ATAD3A patient–derived primary fibroblasts (Pt; three lines pooled), UT) or mtDNA-depleted by ddC as in Fig. 4 D, and stimulated with 1 μg/ml HT-DNA or lipofectamine (Lipo) alone for 24 h. Mean values and data points of three independent experiments are shown. ns indicates nonsignificance in two-way ANOVA with Sidak’s multiple comparison test between UT and ddC conditions. (F) Representative ISG (Mx1, OAS1, ISG15, and IFI27), ATAD3A, and TFAM mRNA expression, expressed as in A, in control and ATAD3A patient–derived primary fibroblasts, UT or mtDNA depleted by ddC as in Fig. 4 D. Mean values and data points of three to eight independent experiments are shown. * indicates statistical significance (P < 0.05) in two-way ANOVA with Sidak’s multiple comparison test between UT and ddC conditions. # indicates statistical significance (P < 0.05) in two-way ANOVA with Dunnett’s multiple comparison test between control and patient-derived fibroblasts for each treatment. (G) Representative ISG Mx1 and ATAD3A mRNA expression in fibroblasts vehicle-treated (DMSO) or treated with 300 µM DIDS or 100 nM rapamycin for 72 h. Mean values and data points of five to seven independent experiments are shown. * indicates statistical significance (P < 0.05) in two-way ANOVA with Sidak’s multiple comparison test between treatment conditions. # indicates statistical significance (P < 0.05) in two-way ANOVA with Dunnett’s multiple comparison test between control and patient-derived fibroblasts for each treatment. (H) ISG mRNA expression, represented as an ISG score, and BAK1 mRNA expression expressed as in A, in fibroblasts after down-regulation of BAX (siBAX) or BAK1 (siBAK1) or both (siBAX+siBAK1) by siRNA or treatment with control siRNA (siCTRL). Mean values and data points of two to three independent experiments are shown. * indicates statistical significance (P < 0.05) in two-way ANOVA with Dunnett’s multiple comparison tests between siRNA conditions for each cell line. # indicates statistical significance (P < 0.05) in two-way ANOVA with Dunnett’s multiple comparison test between control and patient-derived fibroblasts for each siRNA condition. (I) Protein BAK1, BAX, and ATAD3A levels in primary fibroblasts assessed by Western blot; VDAC1 is a mitochondrial protein, and vinculin and cofilin are loading controls. (J) ISG mRNA expression, represented as an ISG score, in fibroblasts after treatment with 50–200 µM of BAX inhibitor peptide V5 (BAXi V5) for 72 h. Mean values and data points of three to four independent experiments are shown. # indicates statistical significance (P < 0.05) in two-way ANOVA with Dunnett’s multiple comparison test between control and patient-derived fibroblasts for each treatment.
Figure 5.
Figure 5.
ATAD3A down-regulation in fibroblasts leads to cytosolic release of mtDNA. (A) ISG mRNA expression, represented as an ISG score (i.e., the median fold change of mRNA levels of seven ISGs [RSAD2, OAS1, Mx1, IFI27, ISG15, IRF7, and IFI44L] and IFN-β (IFNb) mRNA expression in control and ATAD3A patient–derived primary fibroblasts, vehicle-treated (DMSO) or treated with 300 µM DIDS or 100 nM rapamycin for 72 h. Mean values and data points of five to seven independent experiments are shown. * indicates statistical significance (P < 0.05) in two-way ANOVA with Dunnett’s multiple comparison tests between treatment conditions. # indicates statistical significance (P < 0.05) in two-way ANOVA with Dunnett’s multiple comparison test between control and patient-derived fibroblasts for each treatment. (B) Representative confocal images of control (HDF 1, 2, and 3) and ATAD3A patient–derived primary fibroblasts (AGS1530, AGS2216, and AGS2792) stained for the nucleus (NucBlue in blue) and mitochondria (MitoTracker in yellow). Scale bars, 50 µm. (C) Mitochondrial morphology quantification of control and ATAD3A fibroblasts was performed via supervised machine learning training using HDF 1 cells with fragmented (CCCP-treated), normal (DMSO-treated), and hypertubular (CHX-treated) mitochondria, and automatic single-cell trinary classification. Data represent mean ± SD of three independent experiments (200–442 cells per cell line), nonsignificant in one-way ANOVA. (D) Representative images of immunofluorescence staining of mitochondria (MitoTracker, magenta), dsDNA (DNA, green), and nucleus (DAPI, blue) in BJ-5ta fibroblasts knocked down for ATAD3A by two siRNAs (siATAD3A 1 and 2), observed by confocal microscopy. Mitochondria/DNA overlap is represented in white. Bottom panel shows a magnification of indicated frames in top panel. Scale bars represent 10 µm (top panels) and 5 µm (bottom panels). Graph on the right shows a quantification of DNA spots not colocalized with mitochondrial staining per cell. Means are symbolized by red bars. Results averaged from at least 25 cells counted from one experiment representative of three independent experiments. ****, statistical significance (P < 0.0001) in one-way ANOVA with Tukey’s multiple comparison test.

Similar articles

Cited by

References

    1. Ah Kioon, M.D., Tripodo C., Fernandez D., Kirou K.A., Spiera R.F., Crow M.K., Gordon J.K., and Barrat F.J.. 2018. Plasmacytoid dendritic cells promote systemic sclerosis with a key role for TLR8. Sci. Transl. Med. 10:eaam8458. 10.1126/scitranslmed.aam8458 - DOI - PMC - PubMed
    1. Barrat, F.J., Elkon K.B., and Fitzgerald K.A.. 2016. Importance of Nucleic Acid Recognition in Inflammation and Autoimmunity. Annu. Rev. Med. 67:323–336. 10.1146/annurev-med-052814-023338 - DOI - PubMed
    1. Baudier, J. 2018. ATAD3 proteins: brokers of a mitochondria-endoplasmic reticulum connection in mammalian cells. Biol. Rev. Camb. Philos. Soc. 93:827–844. 10.1111/brv.12373 - DOI - PubMed
    1. Bhattacharyya, S., Wei J., and Varga J.. 2011. Understanding fibrosis in systemic sclerosis: shifting paradigms, emerging opportunities. Nat. Rev. Rheumatol. 8:42–54. 10.1038/nrrheum.2011.149 - DOI - PMC - PubMed
    1. Bird, M.J., Adant I., Windmolders P., Vander Elst I., Felgueira C., Altassan R., Gruenert S.C., Ghesquière B., Witters P., Cassiman D., and Vermeersch P.. 2019. Oxygraphy Versus Enzymology for the Biochemical Diagnosis of Primary Mitochondrial Disease. Metabolites. 9:220. 10.3390/metabo9100220 - DOI - PMC - PubMed

Publication types

MeSH terms