

Patient-specific iPSC-derived endothelial cells reveal aberrant p38 MAPK signaling in atypical hemolytic uremic syndrome
- PMID: 34388364
- PMCID: PMC8452517
- DOI: 10.1016/j.stemcr.2021.07.011
Patient-specific iPSC-derived endothelial cells reveal aberrant p38 MAPK signaling in atypical hemolytic uremic syndrome
Abstract
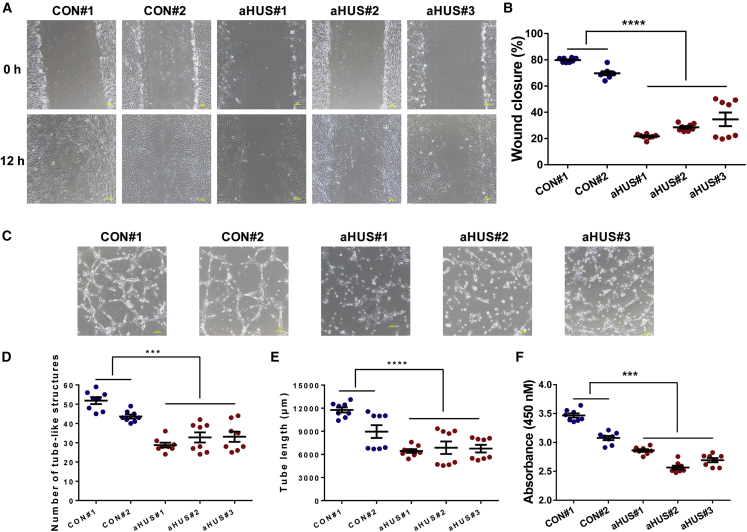
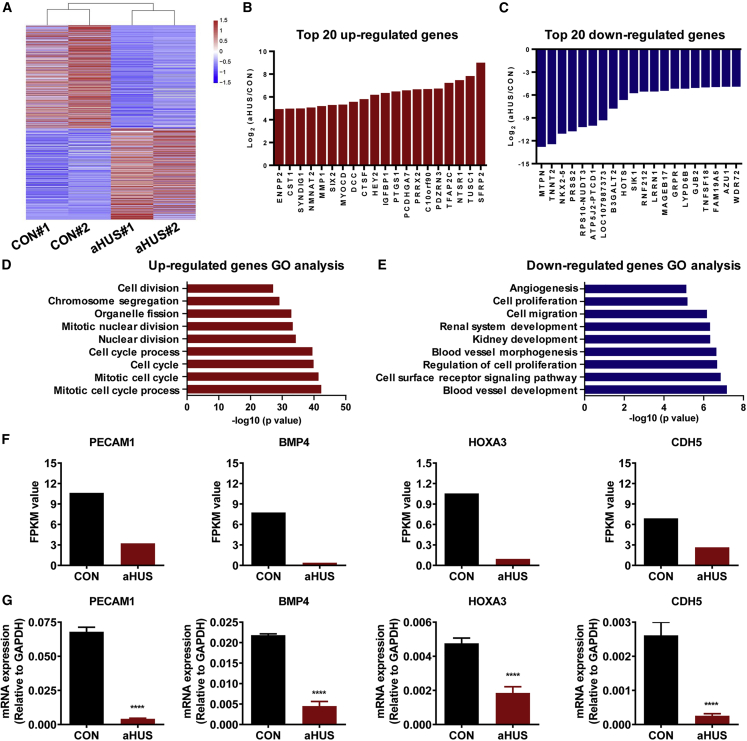
Atypical hemolytic uremic syndrome (aHUS) is a rare disease associated with high morbidity and mortality. Existing evidence suggests that the central pathogenesis to aHUS might be endothelial cell damage. Nevertheless, the role of endothelial cell alterations in aHUS has not been well characterized and the underlying mechanisms remain unclear. Utilizing an induced pluripotent stem cell-derived endothelial cell (iPSC-EC) model, we showed that anti-complement factor H autoantibody-associated aHUS patient-specific iPSC-ECs exhibited an intrinsic defect in endothelial functions. Stimulation using aHUS serums exacerbated endothelial dysfunctions, leading to cell apoptosis in iPSC-ECs. Importantly, we identified p38 as a novel signaling pathway contributing to endothelial dysfunctions in aHUS. These results illustrate that iPSC-ECs can be a reliable model to recapitulate EC pathological features, thus providing a unique platform for gaining mechanistic insights into EC injury in aHUS. Our findings highlight that the p38 MAPK signaling pathway can be a therapeutic target for treatment of aHUS.
Keywords: aHUS; anti-CFH autoantibodies; endothelial dysfunction; iPSC-ECs; p38 MAPK.
Copyright © 2021 The Authors. Published by Elsevier Inc. All rights reserved.
Figures


Similar articles
-
The major autoantibody epitope on factor H in atypical hemolytic uremic syndrome is structurally different from its homologous site in factor H-related protein 1, supporting a novel model for induction of autoimmunity in this disease.J Biol Chem. 2015 Apr 10;290(15):9500-10. doi: 10.1074/jbc.M114.630871. Epub 2015 Feb 6. J Biol Chem. 2015. PMID: 25659429 Free PMC article.
-
Immunological features and functional analysis of anti-CFH autoantibodies in patients with atypical hemolytic uremic syndrome.Pediatr Nephrol. 2019 Feb;34(2):269-281. doi: 10.1007/s00467-018-4074-4. Epub 2018 Oct 12. Pediatr Nephrol. 2019. PMID: 30315407
-
Overactivation of Complement Alternative Pathway in Postpartum Atypical Hemolytic Uremic Syndrome Patients with Renal Involvement.Am J Reprod Immunol. 2015 Oct;74(4):345-56. doi: 10.1111/aji.12404. Epub 2015 May 24. Am J Reprod Immunol. 2015. PMID: 26011580
-
Atypical hemolytic uremic syndrome with C3 mutation: A case report and literature review.Clin Nephrol. 2021 Mar;95(3):156-160. doi: 10.5414/CN110103. Clin Nephrol. 2021. PMID: 33210998 Review.
-
[Atypical hemolytic uremic syndrome].Med Clin (Barc). 2015 Nov 20;145(10):438-45. doi: 10.1016/j.medcli.2014.08.006. Epub 2014 Nov 26. Med Clin (Barc). 2015. PMID: 25433773 Review. Spanish.
Cited by
-
Sources and applications of endothelial seed cells: a review.Stem Cell Res Ther. 2024 Jun 18;15(1):175. doi: 10.1186/s13287-024-03773-6. Stem Cell Res Ther. 2024. PMID: 38886767 Free PMC article. Review.
-
Bridging the Gap: Endothelial Dysfunction and the Role of iPSC-Derived Endothelial Cells in Disease Modeling.Int J Mol Sci. 2024 Dec 11;25(24):13275. doi: 10.3390/ijms252413275. Int J Mol Sci. 2024. PMID: 39769040 Free PMC article. Review.
-
Implication of CXCR2-Src axis in the angiogenic and osteogenic effects of FP-TEB.NPJ Regen Med. 2024 Sep 20;9(1):24. doi: 10.1038/s41536-024-00364-0. NPJ Regen Med. 2024. PMID: 39304660 Free PMC article.
-
Hemocyanin controls Vibrio levels in hemolymph by modulating intracellular ROS via p38 MAPK.Virulence. 2025 Dec;16(1):2546066. doi: 10.1080/21505594.2025.2546066. Epub 2025 Aug 25. Virulence. 2025. PMID: 40852966 Free PMC article.
-
Recent advances in lung organoid development and applications in disease modeling.J Clin Invest. 2023 Nov 15;133(22):e170500. doi: 10.1172/JCI170500. J Clin Invest. 2023. PMID: 37966116 Free PMC article. Review.
References
-
- Barruet E., Morales B.M., Lwin W., White M.P., Theodoris C.V., Kim H., Urrutia A., Wong S.A., Srivastava D., Hsiao E.C. The ACVR1 R206H mutation found in fibrodysplasia ossificans progressiva increases human induced pluripotent stem cell-derived endothelial cell formation and collagen production through BMP-mediated SMAD1/5/8 signaling. Stem Cell Res. Ther. 2016;7:115. - PMC - PubMed
-
- Blanc C., Roumenina L.T., Ashraf Y., Hyvarinen S., Sethi S.K., Ranchin B., Niaudet P., Loirat C., Gulati A., Bagga A., et al. Overall neutralization of complement factor H by autoantibodies in the acute phase of the autoimmune form of atypical hemolytic uremic syndrome. J. Immunol. 2012;189:3528–3537. - PubMed
-
- Bruneau S., Neel M., Roumenina L.T., Frimat M., Laurent L., Fremeaux-Bacchi V., Fakhouri F. Loss of DGKepsilon induces endothelial cell activation and death independently of complement activation. Blood. 2015;125:1038–1046. - PubMed
-
- Chen Y., Dawes P.T., Packham J.C., Mattey D.L. Interaction between smoking and functional polymorphism in the TGFB1 gene is associated with ischaemic heart disease and myocardial infarction in patients with rheumatoid arthritis: a cross-sectional study. Arthritis Res. Ther. 2012;14:R81. - PMC - PubMed
Publication types
MeSH terms
Substances
LinkOut - more resources
Full Text Sources
Miscellaneous
