. 2021 Oct 11;31(19):4388-4396.e5.
doi: 10.1016/j.cub.2021.07.047. Epub 2021 Aug 12.

A midbrain dynorphin circuit promotes threat generalization

Affiliations

A midbrain dynorphin circuit promotes threat generalization

Lizz Fellinger et al. Curr Biol. .

Abstract

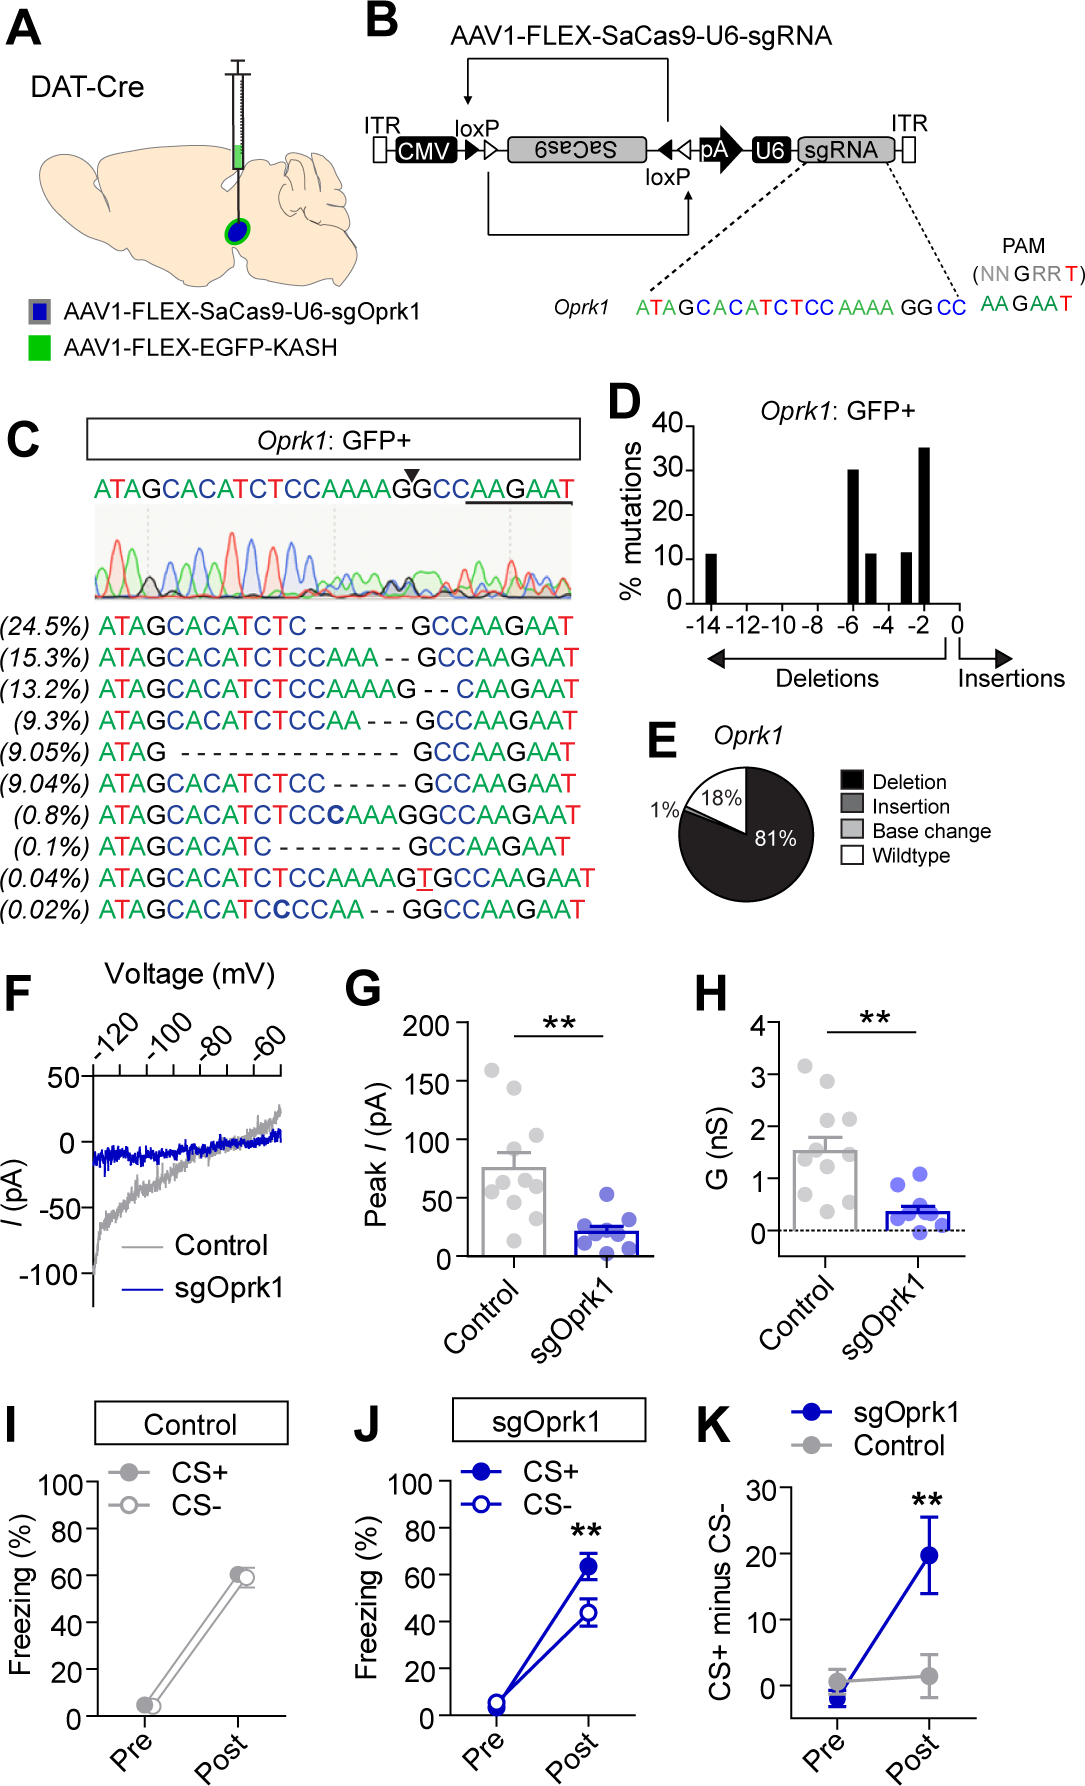
Discrimination between predictive and non-predictive threat stimuli decreases as threat intensity increases. The central mechanisms that mediate the transition from discriminatory to generalized threat responding remain poorly resolved. Here, we identify the stress- and dysphoria-associated kappa opioid receptor (KOR) and its ligand dynorphin (Dyn), acting in the ventral tegmental area (VTA), as a key substrate for regulating threat generalization. We identify several dynorphinergic inputs to the VTA and demonstrate that projections from the bed nucleus of the stria terminalis (BNST) and dorsal raphe nucleus (DRN) both contribute to anxiety-like behavior but differentially affect threat generalization. These data demonstrate that conditioned threat discrimination has an inverted "U" relationship with threat intensity and establish a role for KOR/Dyn signaling in the midbrain for promoting threat generalization.

Keywords: CRISPR; dopamine; dorsal raphe; dynorphin; fear; generalization; kappa opioid receptor.


Conflict of interest statement

Declaration of interests The authors declare no competing interests.

Figures

Figure 1
Figure 1. KOR modulation of threat discrimination.
(A) Schematic of experimental paradigm. (B) Freezing to CS+ during test in context A. (C) Freezing to CS− during test in context A (N=10 mice per group; Two-way ANOVA, F(4,90)=4.15, P=0.0039; Bonferroni’s multiple comparisons, *P<0.05, ***P<0.001). (D) Discrimination index (CS+ minus CS−) during test (Two-way ANOVA, F(4,90)=4.31, P=0.0031; Bonferroni’s multiple comparisons, ***P<0.001). Data are presented as mean ± standard error of the mean (S.E.M). Related data are presented in Figure S1 and S2.
Figure 2
Figure 2. Mutagenesis of Oprk1 in dopamine neurons.
(A-B) Schematic of viral injection location (A) and AAV1-FLEX-SaCas9-U6-sgRNA containing guide for Oprk1 (B). (C) Oprk1 guide sequence and predicted cut site (arrowhead) with corresponding sanger sequencing of PCR amplicon (top). Bottom: sequence reads from targeted deep sequencing with percentage of occurrence on left. (D) Distribution of indel mutations from targeted deep sequencing. (E) Proportion of sequence reads with insertions, deletions, base changes, or wild type sequence. (F) Representative subtracted current (I)-voltage (V) plot (ACSF-U69,593) in a cell from Oprk1-targeted or control mouse. (G-H) Peak subtracted I (G; Two-tailed Student’s t-test, t(18)=3.47, P=0.0028) and conductance (H) in cells from control and sgOprk1 mice (H; Two-tailed Student’s t-test, t(18)=3.63, P=0.0019; n=11 cells from N=3 control and n=9 cells from N=3 sgOprk1 mice). (I) Freezing to CS+ and CS− during baseline (pre) and test (post) in control mice (N=9) after conditioning with 0.5mA foot shock. (J) Freezing to CS+ and CS− pre- and post-conditioning in sgOprk1 mice (N=12; Two-way repeated measures ANOVA, F(1,22)=7.54, P=0.012; Bonferonni’s multiple comparisons **P<0.01). (K) Discrimination index pre-and post-conditioning in control and sgOprk1 mice (Two-way repeated measures ANOVA, F(1,19)=8.22, P=0.0099; Bonferonni’s multiple comparisons **P<0.01). Data are presented as mean ± S.E.M. Related data are presented in Figure S3.
Figure 3
Figure 3. Inactivation of Pdyn in the inputs to the VTA.
(A) Schematic of CAV2-FLEX-ZsGreen injection into PdynCre mice. (B) Representative images of ZsGreen fluorescence in the DRN, BNST, and NAc. (C) Normalized cell counts of DRN-Pdyn inputs are significantly higher than NAc or BNST inputs (N=6 mice; One-way ANOVA, F(2,15)=25.01, P<0.0001, Tukey’s multiple comparisons, ****P<0.0001). (D) Normalized distribution of Pdyn-expressing neurons in subregions of the DRN (One-way ANOVA, F(3,20)=347.07, P<0.0001, Tukey’s multiple comparisons, ***P<0.0001, **P<0.01). (E) Normalized distribution of Pdyn-expressing neurons in subregions the BNST (One-way ANOVA, F(3,20)=78.57, P<0.0001, Tukey’s multiple comparisons, ***P<0.0001, **P<0.01). (F) Schematic of CAV2-Cre injection into the VTA of Pdynlox/lox or Ai14 mice. Schematic of Pdynlox allele before and after Cre-mediated recombination. (H) Representative image of TdTomato (red) and TH (cyan) fluorescence in VTA of Ai14 mouse injected with CAV2-Cre. (I) Representative image of TdTomato fluorescence in DRN, BNST, and NAc of Ai14 mouse injected with CAV2-Cre. (J) Freezing to CS+ and CS− during baseline (pre) and test (post) in control mice (N=10). (K) Freezing to CS+ and CS− pre- and post-conditioning (0.5 mA foot shock) in CAV2-Cre::Pdynlox/lox mice (N=12; Two-way repeated measures ANOVA, F(1,22)=12.55, P=0.0018; Bonferonni’s multiple comparisons ****P<0.0001). (L) Discrimination index pre-and post-conditioning in control and CAV2-Cre::Pdynlox/lox mice (Two-way repeated measures ANOVA, F(1,20)=13.15, P=0.0017; Bonferonni’s multiple comparisons ***P<0.01). Data are presented as mean ± S.E.M. Abbreviations: DRD: dorsal raphe dorsal, DRV: dorsal raphe ventral, DRL: dorsal raphe lateral, PDR: posterior dorsal raphe, Aq: cerebral aqueduct, scp: superior cerebellar peduncle, STLP: stria terminalis posterior, STLV: stria terminalis ventral, STMA: stria terminalis medial anterior, STMV: stria terminalis medial ventral, ac: anterior commissure, acp: anterior commissure posterior. Related data are presented in Figure S3.
Figure 4
Figure 4. Stimulation of Pdyn inputs to the VTA.
(A) Schematic illustration of AAV1-FLEX-ChR2-mCherry injection into the BNST or DRN and bilateral optical cannula implantation into the VTA. (B) Representative histological verification of ChR2-mCherry expression in the BNST or DRN and ChR2-mCherry fibers in the VTA; scale bar = 50 μm. (C) Schematic illustration of experimental paradigm with 20 Hz optical stimulation (474 nm, 0.5 ms pulse width) for 1 s beginning 0.5 s before footshock (0.3 mA) onset and co-terminating with US and CS+. (D-E) Velocity of movement during foot shock presentation on day 1 (D) and day 2 (E); note control and BNST stimulation curves are nearly completely superimposed. (F) Pre- and post-conditioning freezing in BNST-Pdyn::mCherry control mice (N=10; Two-way repeated measures ANOVA, F(1,18)=9.36, P=0.0067, Bonferonni’s multiple comparisons ***P<0.001). (G) Pre- and post-conditioning freezing in BNST-Pdyn::ChR2-mCherry mice (N=9; Two-way repeated measures ANOVA, F(1,16)=6.35, P=0.023, Bonferonni’s multiple comparisons **P<0.01). Discrimination index pre- and post-conditioning. (I) Time spent in open arm of EPM (N=10 control and N=9 BNST, two-tailed, unpaired Student’s t-test, t(17)=3.75, **P=0.0016). (J-K) Velocity of movement during foot shock presentation (0.3 mA) and stimulation on day 1 (J) and day 2 (K); note control and DRN stimulation curves are nearly completely superimposed. (L) Pre- and post-conditioning freezing in DRN-Pdyn::mCherry control mice (N=12; Two-way repeated measures ANOVA, F(1,22)=12.99, P=0.0016, Bonferonni’s multiple comparisons ***P<0.001). (M) Pre- and post-conditioning freezing in DRN-Pdyn::ChR2-mCherry mice (N=10). (N) Discrimination index pre- and post-conditioning (Two-way repeated measures ANOVA, F(1,20)=5.78, P=0.026, Bonferonni’s multiple comparisons ***P<0.001). (O) Time spent in open arm of EPM (N=12 control and N=10 DRN, two-tailed, unpaired Student’s t-test, t(20)=2.20, *P=0.04). Data are presented as mean ± S.E.M. Related data are presented in Figure S4.

Comment in

References

    1. Dunsmoor JE and Paz R, Fear Generalization and Anxiety: Behavioral and Neural Mechanisms. Biol Psychiatry, 2015. 78(5): p. 336–43. - PubMed
    1. LeDoux JE, Emotion circuits in the brain. Annu Rev Neurosci, 2000. 23: p. 155–84. - PubMed
    1. Tovote P, Fadok JP, and Luthi A, Neuronal circuits for fear and anxiety. Nat Rev Neurosci, 2015. 16(6): p. 317–31. - PubMed
    1. Laxmi TR, Stork O, and Pape HC, Generalisation of conditioned fear and its behavioural expression in mice. Behav Brain Res, 2003. 145(1–2): p. 89–98. - PubMed
    1. Baldi E, Lorenzini CA, and Bucherelli C, Footshock intensity and generalization in contextual and auditory-cued fear conditioning in the rat. Neurobiol Learn Mem, 2004. 81(3): p. 162–6. - PubMed

Publication types

LinkOut - more resources