. 2021 Sep 2;184(18):4772-4783.e15.
doi: 10.1016/j.cell.2021.07.024. Epub 2021 Aug 12.

Developmental and temporal characteristics of clonal sperm mosaicism

Affiliations

Developmental and temporal characteristics of clonal sperm mosaicism

Xiaoxu Yang et al. Cell. .

Abstract

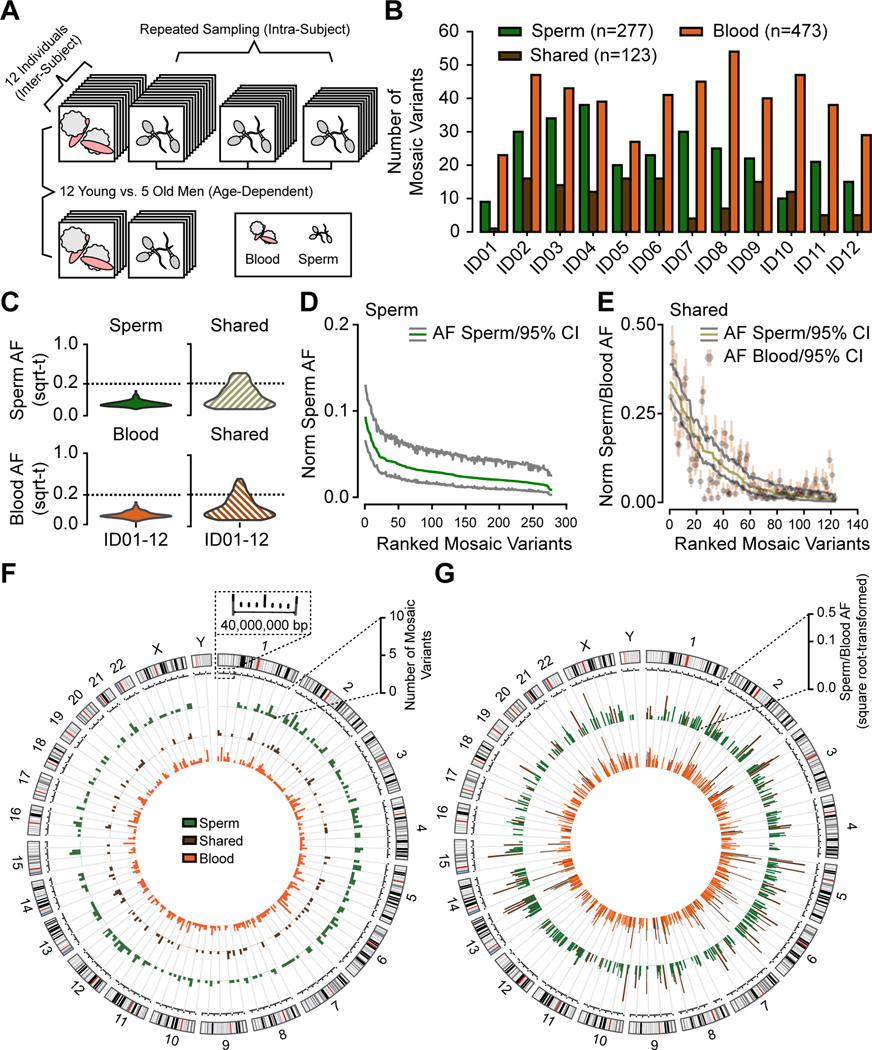
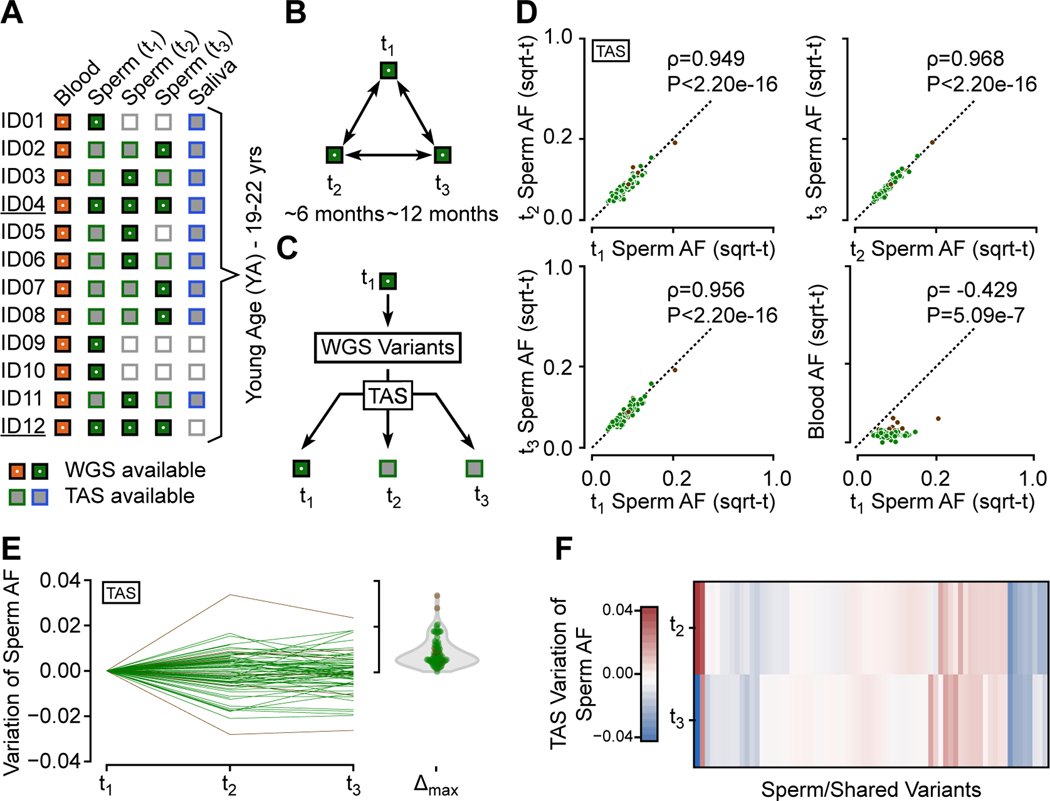
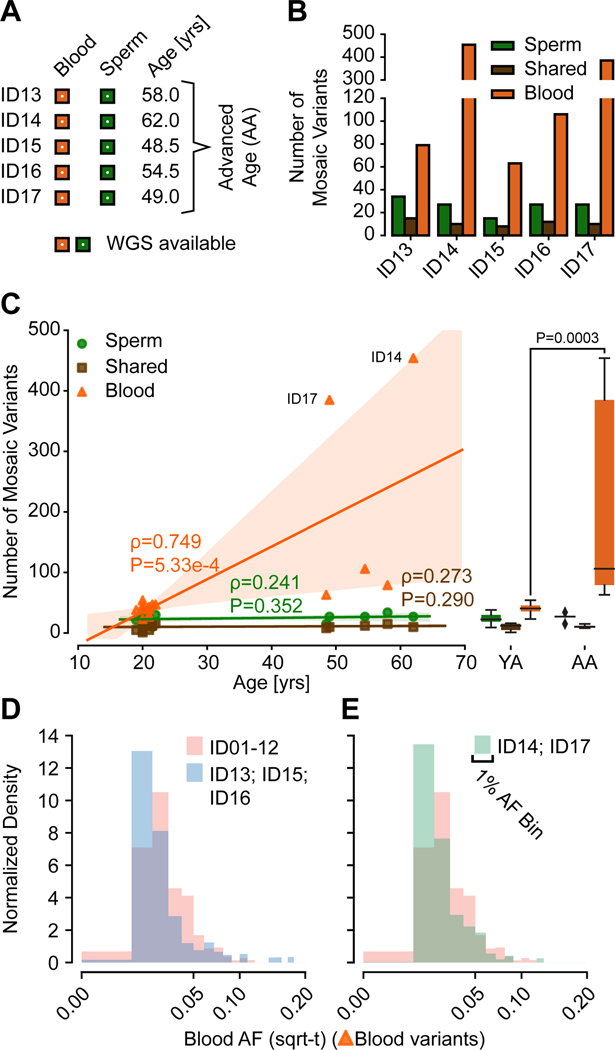
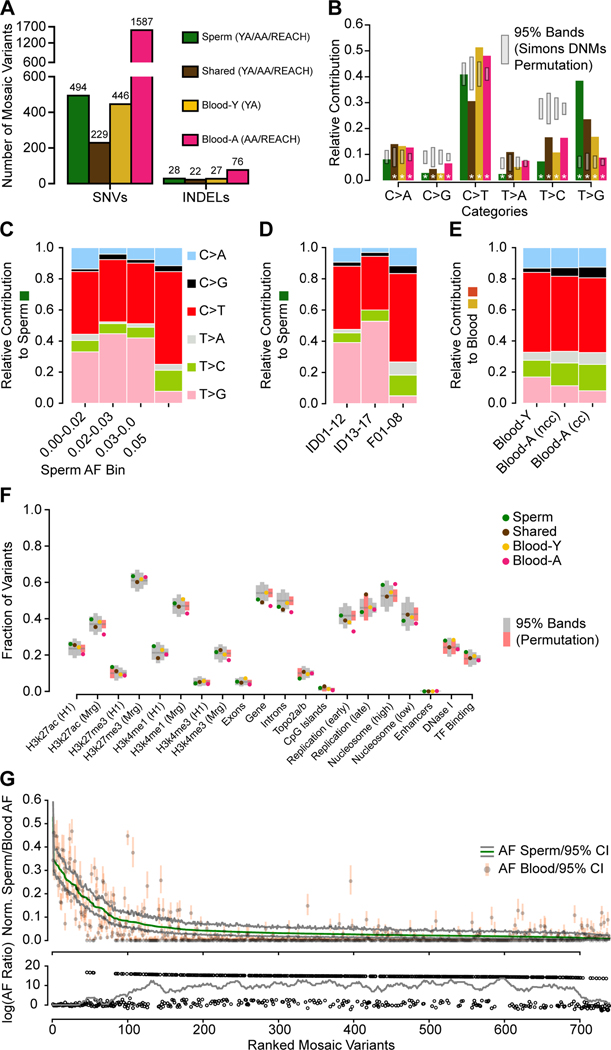
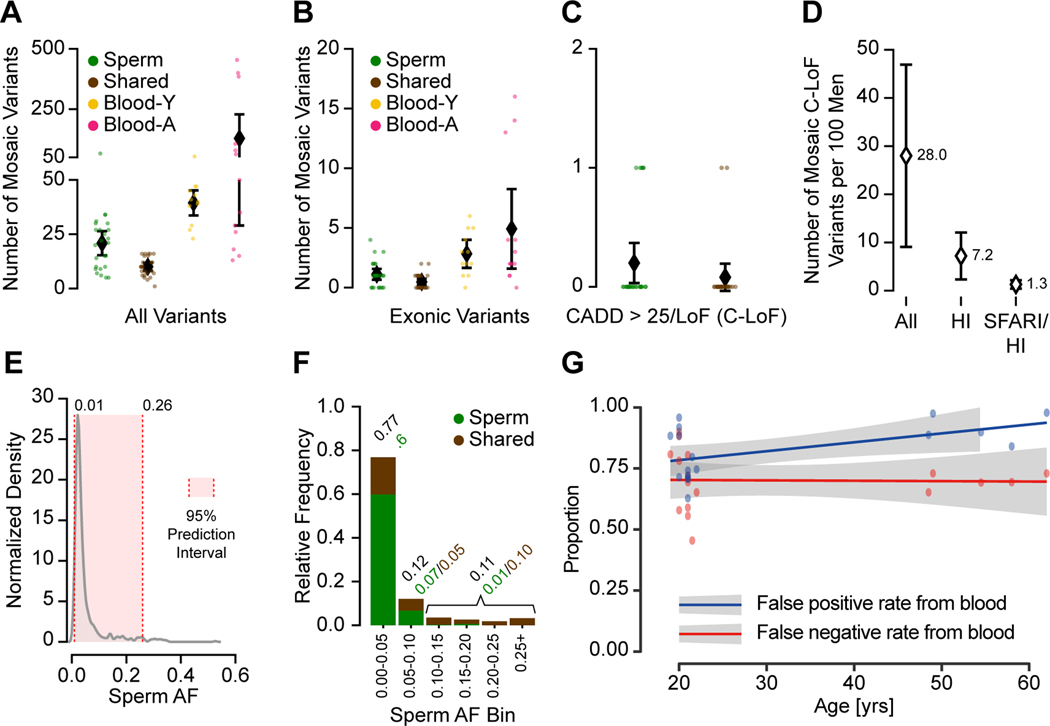
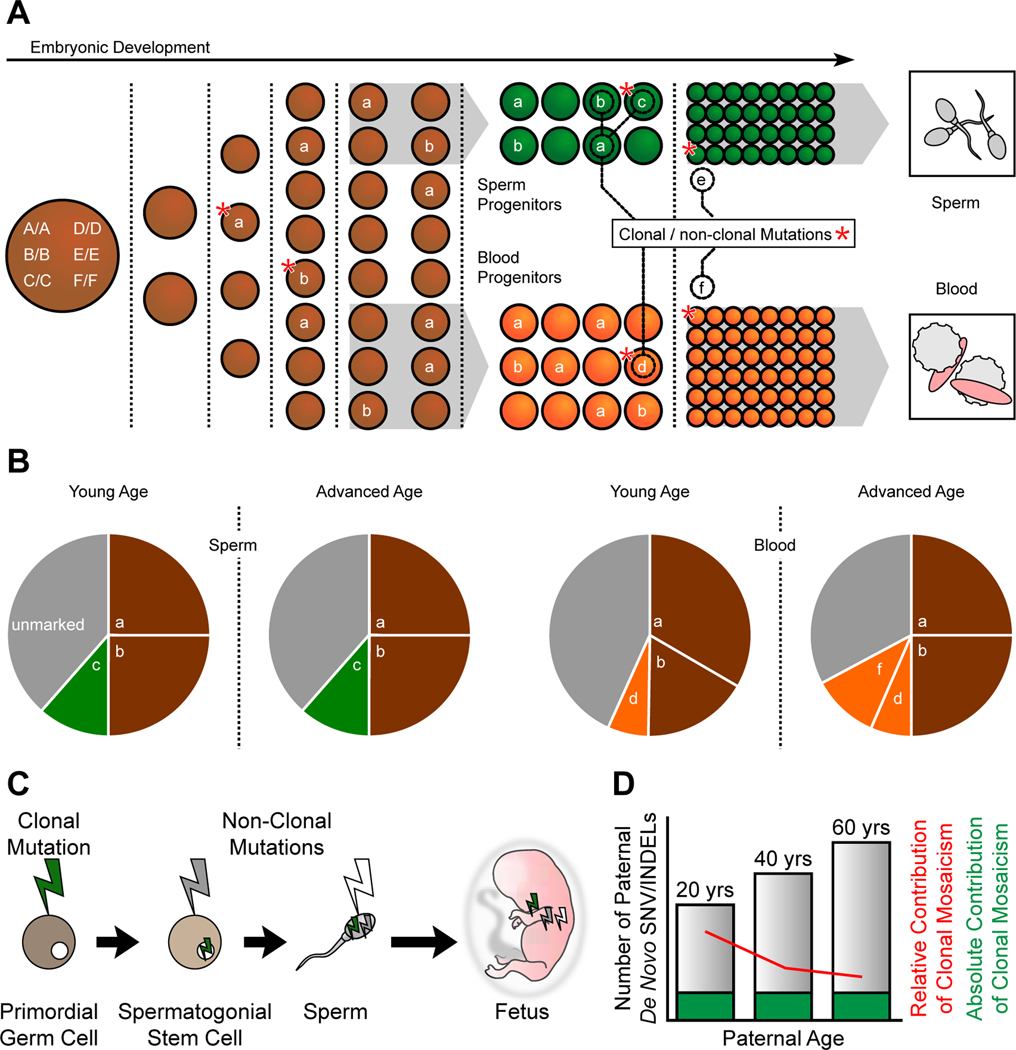
Throughout development and aging, human cells accumulate mutations resulting in genomic mosaicism and genetic diversity at the cellular level. Mosaic mutations present in the gonads can affect both the individual and the offspring and subsequent generations. Here, we explore patterns and temporal stability of clonal mosaic mutations in male gonads by sequencing ejaculated sperm. Through 300× whole-genome sequencing of blood and sperm from healthy men, we find each ejaculate carries on average 33.3 ± 12.1 (mean ± SD) clonal mosaic variants, nearly all of which are detected in serial sampling, with the majority absent from sampled somal tissues. Their temporal stability and mutational signature suggest origins during embryonic development from a largely immutable stem cell niche. Clonal mosaicism likely contributes a transmissible, predicted pathogenic exonic variant for 1 in 15 men, representing a life-long threat of transmission for these individuals and a significant burden on human population health.

Keywords: autism spectrum disorder; clonal mosaicism; congenital disorders; de novo mutation; embryogenesis; mutational signature; somatic; sperm; transmission risk.


Conflict of interest statement

Declaration of interests M.W.B., D.A., K.N.J., J.S., and J.G.G. are inventors on a patent (PCT/US2018/024878, WO2018183525A1) filed by University of California, San Diego that is titled “Methods for assessing risk of or diagnosing genetic defects by identifying de novo mutations or somatic mosaic variants in sperm or somatic tissues”.

Figures

Figure 1.
Figure 1.. Analysis in 12 young aged men uncovers the landscape of sperm clonal mosaicism
(A) Sampling strategy: 12 healthy males of young age (YA, 18–22 years, blood and up to 3 sperm samples) and 5 healthy males of advanced age (AA, >48 years, blood and 1 sperm sample). Samples subjected to 300× whole-genome sequencing (WGS), then the MSMF computational workflow (see STAR Methods). (B) Bar charts: number of clonal mosaic variants per individual from each class (sperm-specific: ‘Sperm’, blood-specific: ‘Blood’, tissue-shared: ‘Shared’); Blood typically outnumber Shared or Sperm. (C) AF distribution (square root-transformed; sqrt-t) of Sperm, Shared, and Blood variants in YA cohort. Shared variants showed higher peak and overall AF compared to Sperm and Blood. sqrt-t: square-root transformed. (D-E) Rank plot of estimated sperm and blood AFs with 95% exact binomial confidence intervals (CIs) from the YA cohort, grouped by class. Sperm (D) showed steeper initial decay curves, suggesting a relatively lower mutation or higher expansion rate than Shared (E), showing a shallower decay. Norm Sperm AF: sex-chromosome normalized allelic fraction. (F) Circos histograms for the number of mSNV/INDELs detected from the YA cohort. Variants were evenly distributed across the genome. Colors distinguish classes of variants. (G) Mosaic SNV/INDELs and the corresponding allelic fractions (AFs) detected from the YA cohort, colors are the same as B. Inner circle: AFs in the blood; outer circle: AFs in the sperm. Colors distinguish classes of variants. Note that Shared variants in brown will be represented in both circles as they are—by definition—detected within both tissues. See also Figure S1, S2, and Data S1.
Figure 2.
Figure 2.. Sperm clonal mosaicism shows temporal stability within an individual
(A) Available blood, sperm, and saliva samples for ID01–12 and their WGS status. ID04 and ID12 (underlined) had three samples subjected to WGS to assess whether new mutations appear over time. (B) Analysis strategy for ID04 and ID12. 300× WGS was used on 3 independent sperm sample time points (t1, 2, 3). (C) WGS-discovery of sperm mosaicism variants in each male at one time point, followed by >5000× read depth targeted amplicon sequencing (TAS) in all available samples for all individuals, allowing for accurate assessment of AFs at each time point. (D) Scatter plot showing pair-wise AF comparison across the YA cohort by TAS. All validated variants were detected in all available sperm samples (i.e. new variants did not appear, nor did existing variants disappear). Number of variants per plot: upper left: 84, upper right and lower left: 71, lower right: 103, with Spearman’s ρ and P-values. (E) Modified scatter plot showing absolute sperm AF changes for each variant tested across the three time points was typically below 0.02 (i.e. 2%) AF. Violin plot: maximal, absolute change for each variant. (F) Heatmap of AF variation relative to t1 for variants with three available samples did not show a clear linear increase or decrease. See also Figure S2 and Data S2.
Figure 3.
Figure 3.. Blood but not Sperm clonal mosaic mutations increase with advanced age (AA)
(A) Both blood and sperm in 5 AA men were subjected to 300× WGS. (B) Number of clonal mosaic variants detected in the 5 AA men, with Sperm and Shared clonal variants comparable to the YA cohort, whereas Blood variants showed dramatic accumulation especially in ID14 and ID17. (C) Scatter plot, regression lines, and 95% prediction intervals showing the number of mosaic variants from YA (n=12) and AA (n=5) cohort. Left: stability of the number of Sperm and Shared variants, but a dramatic age-dependent accumulation of Blood variants (orange). Right: combined boxplot of all data points (black: median, box: quartiles, whiskers: total data extent). Mann-Whitney U: Sperm 23, Shared 29.5, Blood 0; Two-tailed P-value: Sperm 0.4866, Shared 0.9764, Blood 0.0003). (D-E) Histogram of the AF distribution of individuals without (D; ID13, ID15, and ID16) or with (E; ID14 and ID17) clonal hematopoiesis compared to YA (ID01–12) individuals. Both subgroups of the AA cohort exhibited similar differences compared to the YA cohort despite their difference in Blood variant numbers. See also Figure S3 and Data S1.
Figure 4.
Figure 4.. Distinct early developmental signatures distinguish Shared and tissue-specific clonal mosaicism
(A) Combination of the YA (n=12), AA (n=5), and REACH (n=8) cohorts. Blood-Y from YA, Blood-A from AA and REACH (n=13) were analyzed separately for SNVs and INDELs. Sperm and Shared variants were combined across all cohorts (n=25). (B) Bar charts show the base substitution profiles of variant classes from panel A. All mosaic classes showed depletion of the aging T>C substitution supporting their origin during embryogenesis. Grey: 95% CI from 10,000 permutations of Simons Simplex Cohort Control de novo mutations (Simons DNMs). Asterisks: data points outside of the 95% permutation CI. (C-E) Relative contribution of 6-category variant base substitution profiles. (C) C>T predominance and an additional T>G enrichment only in sperm samples with AF < 5%. (D) After distinguishing the cohorts into different sequencing groups, the higher read depths used in ID01–17 (i.e. 300×) likely accounted for the greater sensitivity to detect this T>G signature. (YA: ID01–12, AA: ID13–17, REACH: F01–08). (E) After distinguishing cohorts into those with and without evidence of clonal hematopoiesis, C>T relative contribution correlated with stronger clonal collapse in blood. nCH, non-clonal hematopoiesis (ID13, ID15, and ID16), CH, clonal hematopoiesis (ID14 and ID17). (F) Scatter plot showing the fraction of variants located across genomic regions for the six categories based on tissue distribution. H3k27ac/H3k27me3/H3K4me1 (H1/Mrg): H3k27ac/H3k27me3/H3K4me1 acetylation peak regions measured in human H1esc or merged from 9 different cell lines; Top2a/b: topoisomerase binding regions; Early and Late replication: measured DNA replication timing; Nucleosome (high/low): nucleosome occupancy tendency; Enhancers: annotated enhancer regions; DNase I: DNase I hypersensitive regions; TF Binding: Transcription factor binding sites. 95% permutation CIs were calculated from 10,000 random permutations of the same number of variants of Simons Simplex Consortium de novo mutations (if a data point is outside of the permutation interval it is colored red). Blood-A showed the most deviations from expectations. (G) Rank plot of estimated sperm and blood AF with 95% confidence intervals for all 773 gonadal mosaic variants detected as mosaic in sperm (Sperm and Shared). Lower plot shows the log10 transformed ratio of sperm and blood AFs (0 replaced by 1e-8) and the rolling average of over 20 data points to display the local trend. Sperm variants reached maximal AF of 15% and showed a relatively lower average AF. See also Figure S4, S5, S6, and Data S3.
Figure 5.
Figure 5.. Clonal sperm mosaicism represents a life-long transmission risk with 1 in 15 males carrying a predicted high-impact pathogenic mutation
(A) Number of detectable mosaic variants in each category from 2909 total variants; shown are numbers of variants from each individual and the population mean with the 95% CI. (B) Number of detectable mosaic variants in each category for exonic variants. Shown are individual data points and mean with a 95% confidence interval. (C) Number of Sperm and Shared variants with a CADD score >25 or a loss-of-function prediction (C-LoF); shown are numbers of variants from each individual and the population mean with the 95% CI. (D) Estimated number of males per 100 (with 95% CI) with a detectable C-LoF variant in any gene (All), a haploinsufficient (HI) gene, or in a HI gene in the SFARI gene list (SFARI/HI). (E) Kernel density estimation of the AF distribution of all sperm mosaic variants. The 95% prediction interval for AF is 1–26%. (F) Stacked bar charts show the relative frequency of AF categories, binned at 5% increments or above 25% for Sperm and Shared variants. The majority of mutations were <5% AF, and most of these were not shared with blood. (G) Scatter plot and regression lines show the inaccuracy of transmissible mosaicism detection from blood increases with age (YA and AA cohort). Based on the number of blood detectable mosaic variants and their presence in sperm, blood-only detection produces a high false-positive rate that further increases with age due to CH (blue). Blood-only detection produces a consistent 66% false-negative rate (red) for the prediction of transmission across different age groups. See also Data S3.
Figure 6.
Figure 6.. Developmental origin and transmission of clonal and non-clonal mosaicism in sperm
(A) Mosaic variants occur throughout development and are typically Shared if they occur prior to germ cell specification. For instance mutation a (resulting in genotype A/a) occurs during the 4 cell stage, is present in ∼25% of cells (i.e. ∼12.5% AF), and is shared across blood and sperm. B/b, which occurs later, is also shared in sperm and blood and are clonal. C/c and D/d occur in specific tissues and are present as clonal mosaicism, whereas E/e, and F/f occur later and are non-clonal at young age (i.e. not detectable from bulk sequencing). This schematic shows male development; however, due to the similarity of early germ cell development between sexes, female mosaicism likely exhibits similar patterns. (B) Relative contributions of variants to cellular diversity detected in blood and sperm, and changes with age. Variants occurring during early embryogeneis (a and b) are shared in young and aged in both sperm and blood. A group of sperm specific (c) or blood specific (d) variants arise during embryogenesis and are stable during aging. A group of blood specific variants (f) arise to the level of clonal during aging. Gray: unmarked clones. (C) Sperm mosaicism subtypes. Clonal mosaicism is present in primordial germ cells (green bolt); non-clonal mutations arise in spermatogonial stem cells (gray bolt) and sperm (white bolt). Note that the mutations accumulate within sperm, and ultimately the fetus which harbors all as de novo mutations. (D) Absolute contribution of clonal sperm mosaicism (green) is stable as men age whereas non-clonal sperm mosaicism increases with age (gray). As a result, the relative contribution of clonal mosaic SNVs or INDELs to the number of de novo mutations in an offspring decreases with age (red line).

References

    1. Acuna-Hidalgo R, Veltman JA, and Hoischen A. (2016). New insights into the generation and role of de novo mutations in health and disease. Genome biology 17, 241. - PMC - PubMed
    1. Adelman ER, Huang HT, Roisman A, Olsson A, Colaprico A, Qin T, Lindsley RC, Bejar R, Salomonis N, Grimes HL, et al. (2019). Aging Human Hematopoietic Stem Cells Manifest Profound Epigenetic Reprogramming of Enhancers That May Predispose to Leukemia. Cancer Discov 9, 1080–1101. - PMC - PubMed
    1. Alankarage D, Ip E, Szot JO, Munro J, Blue GM, Harrison K, Cuny H, Enriquez A, Troup M, Humphreys DT, et al. (2019). Identification of clinically actionable variants from genome sequencing of families with congenital heart disease. Genet Med 21, 1111–1120. - PubMed
    1. Alexandrov LB, Jones PH, Wedge DC, Sale JE, Campbell PJ, Nik-Zainal S, and Stratton MR (2015). Clock-like mutational processes in human somatic cells. Nat Genet 47, 1402–1407. - PMC - PubMed
    1. Alexandrov LB, Nik-Zainal S, Wedge DC, Aparicio SA, Behjati S, Biankin AV, Bignell GR, Bolli N, Borg A, Borresen-Dale AL, et al. (2013). Signatures of mutational processes in human cancer. Nature 500, 415–421. - PMC - PubMed

Publication types