

In-situ synchrotron X-ray imaging of ultrasound (US)-generated bubbles: Influence of US frequency on microbubble cavitation for membrane fouling remediation
- PMID: 34388491
- PMCID: PMC8361323
- DOI: 10.1016/j.ultsonch.2021.105697
In-situ synchrotron X-ray imaging of ultrasound (US)-generated bubbles: Influence of US frequency on microbubble cavitation for membrane fouling remediation
Abstract
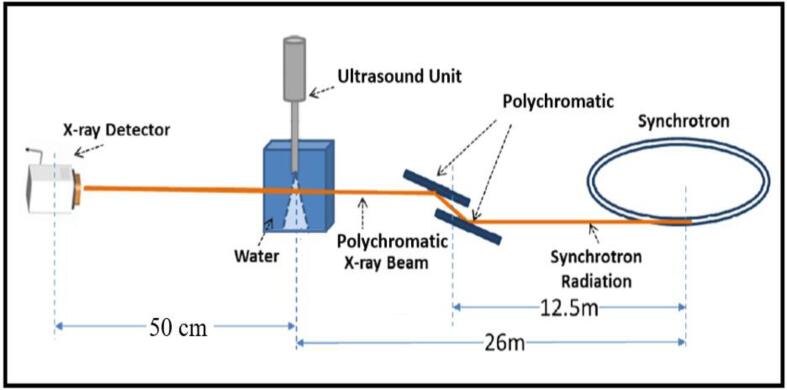
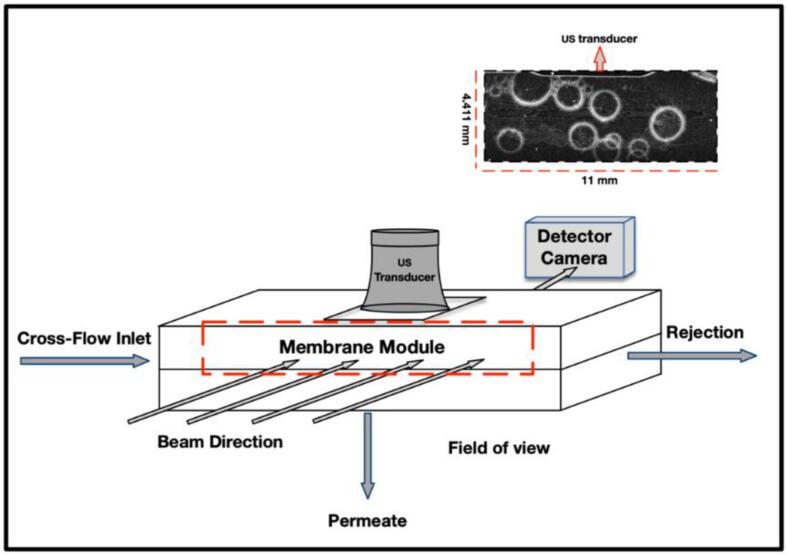
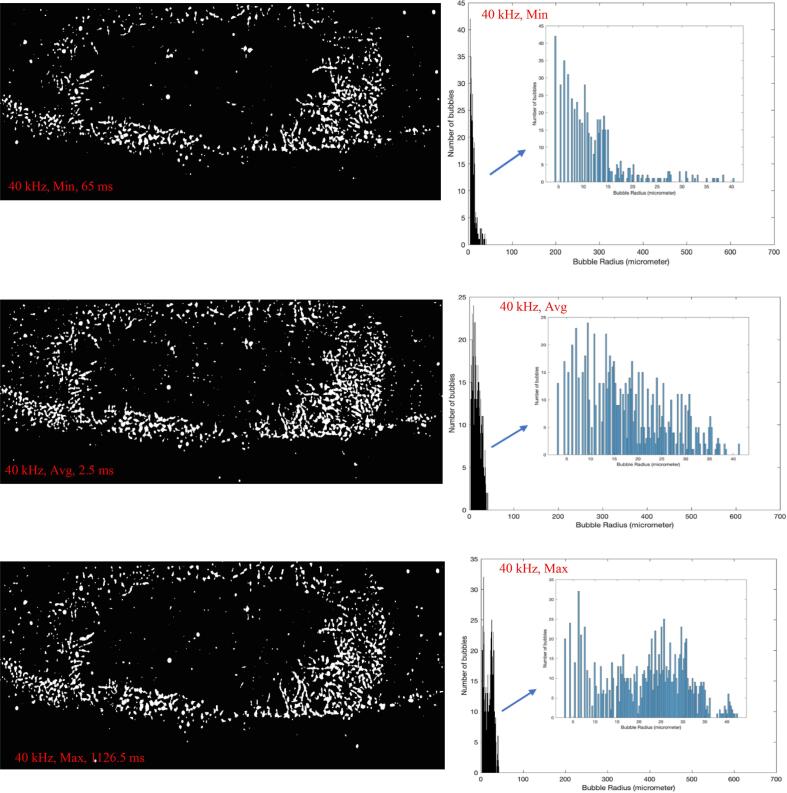
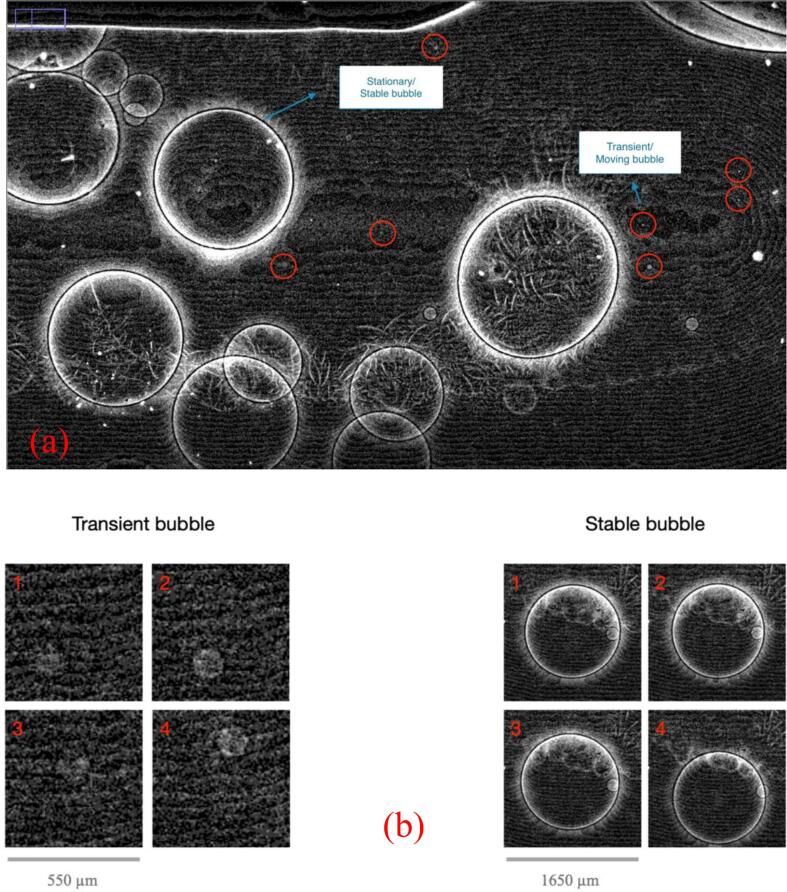
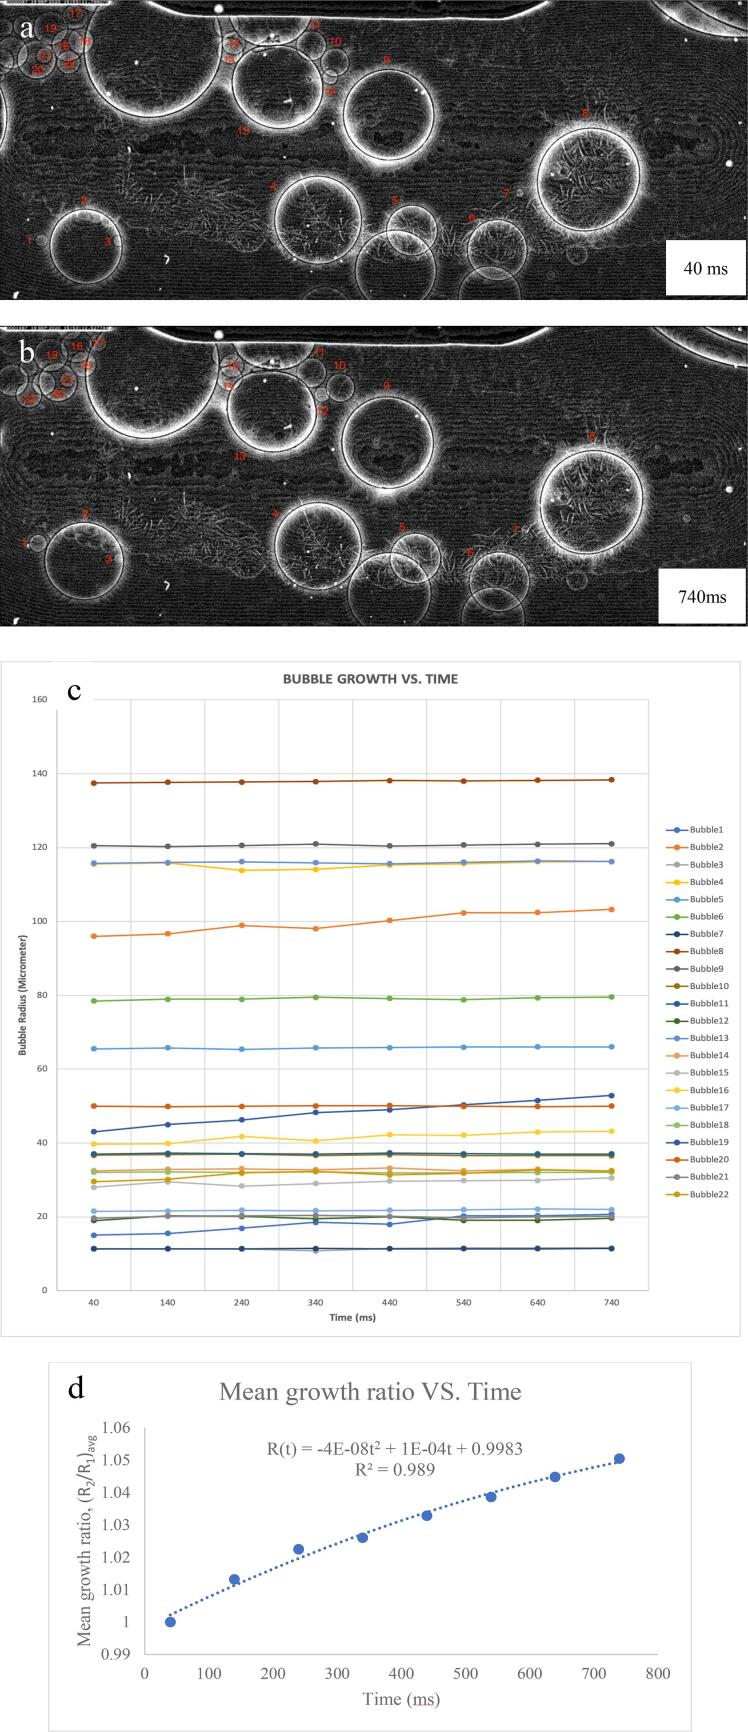
Gaining an in-depth understanding of the characteristics and dynamics of ultrasound (US)--generated bubbles is crucial to effectively remediate membrane fouling. The goal of present study is to conduct in-situ visualization of US-generated microbubbles in water to examine the influence of US frequency on the dynamics of microbubbles. This study utilized synchrotron in-line phase contrast imaging (In-line PCI) available at the biomedical imaging and therapy (BMIT) beamlines at the Canadian Light Source (CLS) to enhance the contrast of liquid/air interfaces at different US frequencies of 20, 28 and 40 KHz at 60 Watts. A high-speed camera was used to capture 2,000 frames per second of the bubble cavitation generated in water under the ultrasound influence. Key parameters at the polychromatic beamlines were optimized to maximize the phase contrast of gas/liquid of the microbubbles with a minimum size of 5.5 µm. ImageJ software was used to analyze the bubble characteristics and their behavior under the US exposure including the microbubble number, size, and fraction of the total area occupied by the bubbles at each US frequency. Furthermore, the bubble characteristics over the US exposure time and at different distances from the transducer were studied. The qualitative and quantitative data analyses showed that the microbubble number or size did not change over time; however, it was observed that most bubbles were created at the middle of the frames and close to the US field. The number of bubbles created under the US exposure increased with the frequency from 20 kHz to 40 kHz (about 4.6 times). However, larger bubbles were generated at 20 kHz such that the average bubble radius at 20 kHz was about 6.8 times of that at 40 kHz. Microbubble movement/traveling through water was monitored, and it was observed that the bubble velocity increased as the frequency was increased from 20 kHz to 40 kHz. The small bubbles moved faster, and the majority of them traveled upward towards the US transducer location. The growth pattern (a correlation between the mean growth ratio and the exposure time) of bubbles at 20 kHz and 60 W was obtained by tracking the oscillation of 22 representative microbubbles over the 700 ms of imaging. The mean growth ratio model was also obtained.
Keywords: Bubble cavitation; Microbubble characteristics; Synchrotron X-ray imaging; Ultrasound (US) frequency; Ultrasound (US)irradiation.
Copyright © 2021. Published by Elsevier B.V.
Conflict of interest statement
The authors declare that they have no known competing financial interests or personal relationships that could have appeared to influence the work reported in this paper.
Figures


References
-
- Li J., Sanderson R.D., Jacobs E.P. Ultrasonic cleaning of nylon microfiltration membranes fouled by Kraft paper mill effluent. J. Mem. Sci. 2002;205:247–257. doi: 10.1016/S0376-7388(02)00121-7. - DOI
-
- Muthukumaran S., Yang K., Seuren A., Kentish S., Ashokkumar M., Stevens G.W., Grieser F. The use of ultrasonic cleaning for ultrafiltration membranes in the dairy industry. Sep. & Puri. Tech. 2004;39(1-2):99–107. doi: 10.1016/j.seppur.2003.12.013. - DOI
-
- Li X., Yu J., Nnanna A.G.A. Fouling mitigation for hollow- fiber UF membrane by sonication. Desalination. 2011;281:23–29. doi: 10.1016/j.desal.2011.07.036. - DOI
-
- Lee K.M., Doan H., Ein-Mozaffari F. intermittent ultrasound-ssited ceramic membrane fouling control in ultrafiltration. Canadian. J. Chem. Eng. 2020;98:1648–1667. doi: 10.1002/cjce.23777. - DOI
Publication types
LinkOut - more resources
Full Text Sources
Miscellaneous
