. 2022 Feb;48(1):e12758.
doi: 10.1111/nan.12758. Epub 2021 Sep 5.

A systems-level analysis highlights microglial activation as a modifying factor in common epilepsies

Andre Altmann  1 Mina Ryten  2 Martina Di Nunzio  3 Teresa Ravizza  3 Daniele Tolomeo  3 Regina H Reynolds  2 Alyma Somani  4 Marco Bacigaluppi  5 Valentina Iori  3 Edoardo Micotti  3 Rossella Di Sapia  3 Milica Cerovic  3 Eleonora Palma  6 Gabriele Ruffolo  6 Juan A Botía  2   7 Julie Absil  8 Saud Alhusaini  9   10 Marina K M Alvim  11 Pia Auvinen  12   13 Nuria Bargallo  14   15 Emanuele Bartolini  16   17 Benjamin Bender  18 Felipe P G Bergo  11 Tauana Bernardes  11 Andrea Bernasconi  19 Neda Bernasconi  19 Boris C Bernhardt  20 Karen Blackmon  21 Barbara Braga  11 Maria Eugenia Caligiuri  22 Anna Calvo  14 Chad Carlson  23   24 Sarah J A Carr  25 Gianpiero L Cavalleri  9   26 Fernando Cendes  11 Jian Chen  27 Shuai Chen  28   29 Andrea Cherubini  22 Luis Concha  30 Philippe David  8 Norman Delanty  9   26   31 Chantal Depondt  32 Orrin Devinsky  33 Colin P Doherty  26   34 Martin Domin  35 Niels K Focke  36   37 Sonya Foley  38 Wendy Franca  11 Antonio Gambardella  22   39 Renzo Guerrini  16 Khalid Hamandi  38   40 Derrek P Hibar  41 Dmitry Isaev  41 Graeme D Jackson  42   43 Neda Jahanshad  41 Reetta Kälviäinen  12   13 Simon S Keller  44 Peter Kochunov  45 Raviteja Kotikalapudi  18   35   36 Magdalena A Kowalczyk  42 Ruben Kuzniecky  46 Patrick Kwan  47 Angelo Labate  22   39 Soenke Langner  35 Matteo Lenge  16 Min Liu  19 Pascal Martin  36 Mario Mascalchi  48 Stefano Meletti  49 Marcia E Morita-Sherman  11   50 Terence J O'Brien  47   51 Jose C Pariente  14 Mark P Richardson  25   52 Raul Rodriguez-Cruces  20   30 Christian Rummel  53 Taavi Saavalainen  13   54 Mira K Semmelroch  42   43 Mariasavina Severino  55 Pasquale Striano  56 Thomas Thesen  23 Rhys H Thomas  57 Manuela Tondelli  50 Domenico Tortora  55 Anna Elisabetta Vaudano  49 Lucy Vivash  47   58 Felix von Podewils  59 Jan Wagner  60 Bernd Weber  61 Roland Wiest  53 Clarissa L Yasuda  11 Guohao Zhang  62 Junsong Zhang  28   29 ENIGMA-Epilepsy Working GroupCostin Leu  63   64   65 Andreja Avbersek  64 EpiPGX ConsortiumMaria Thom  4   65 Christopher D Whelan  9   41 Paul Thompson  41 Carrie R McDonald  66   67 Annamaria Vezzani  3 Sanjay M Sisodiya  65   68
Affiliations

A systems-level analysis highlights microglial activation as a modifying factor in common epilepsies

Andre Altmann et al. Neuropathol Appl Neurobiol. 2022 Feb.

Abstract

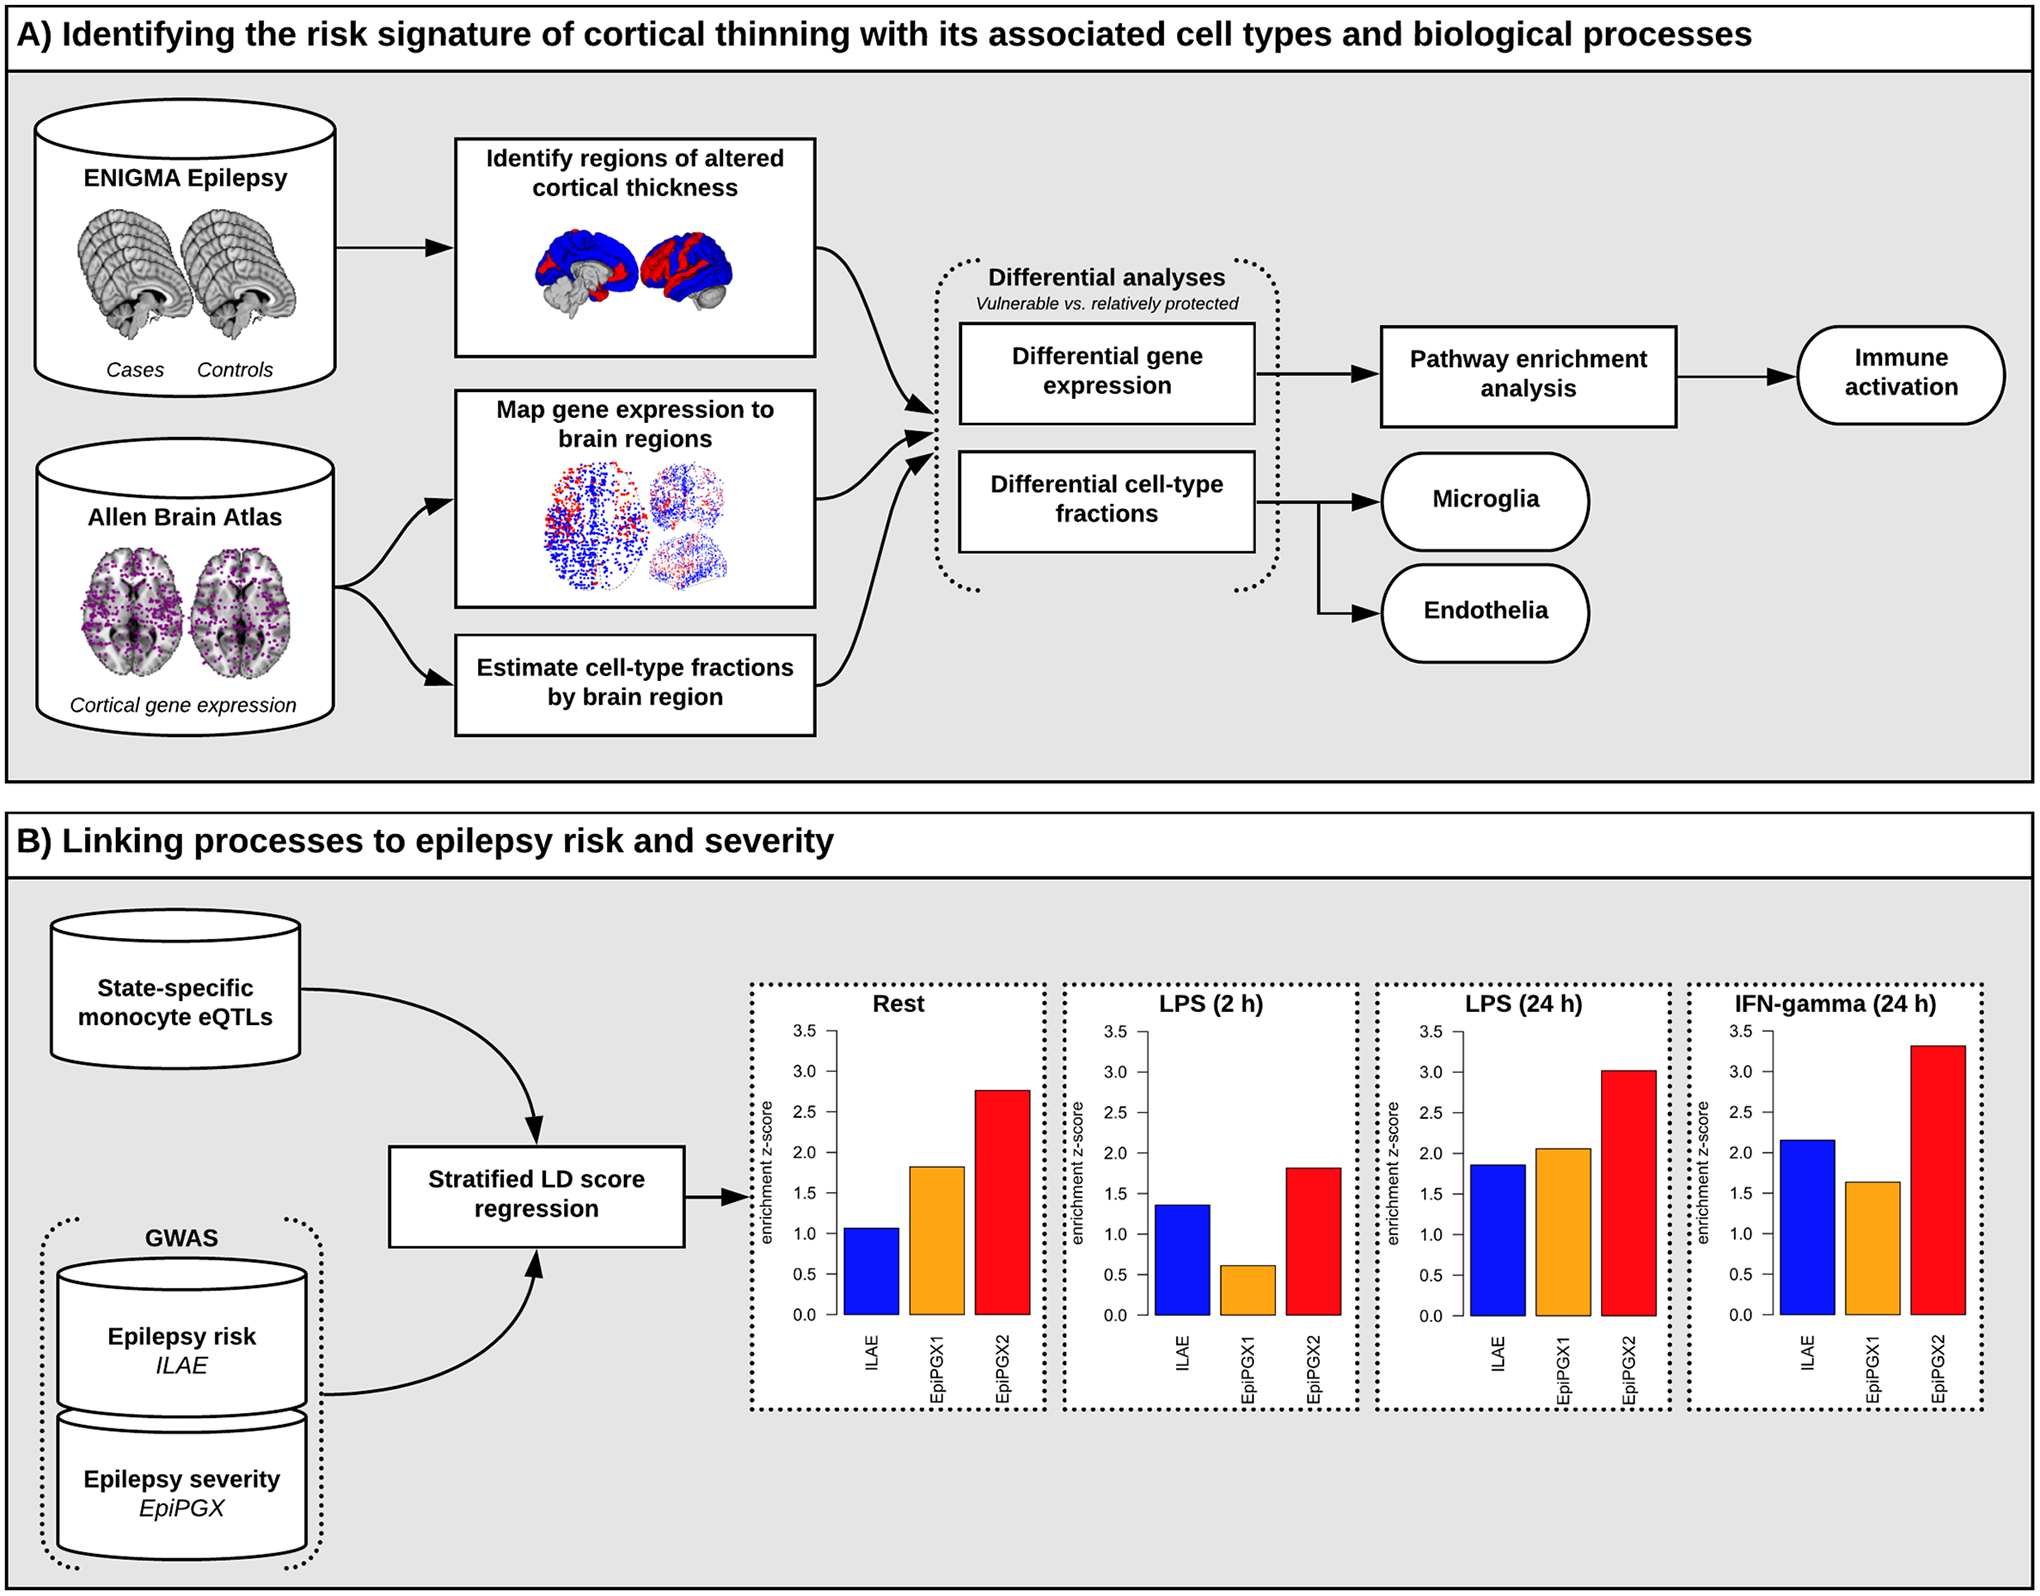
Aims: The causes of distinct patterns of reduced cortical thickness in the common human epilepsies, detectable on neuroimaging and with important clinical consequences, are unknown. We investigated the underlying mechanisms of cortical thinning using a systems-level analysis.

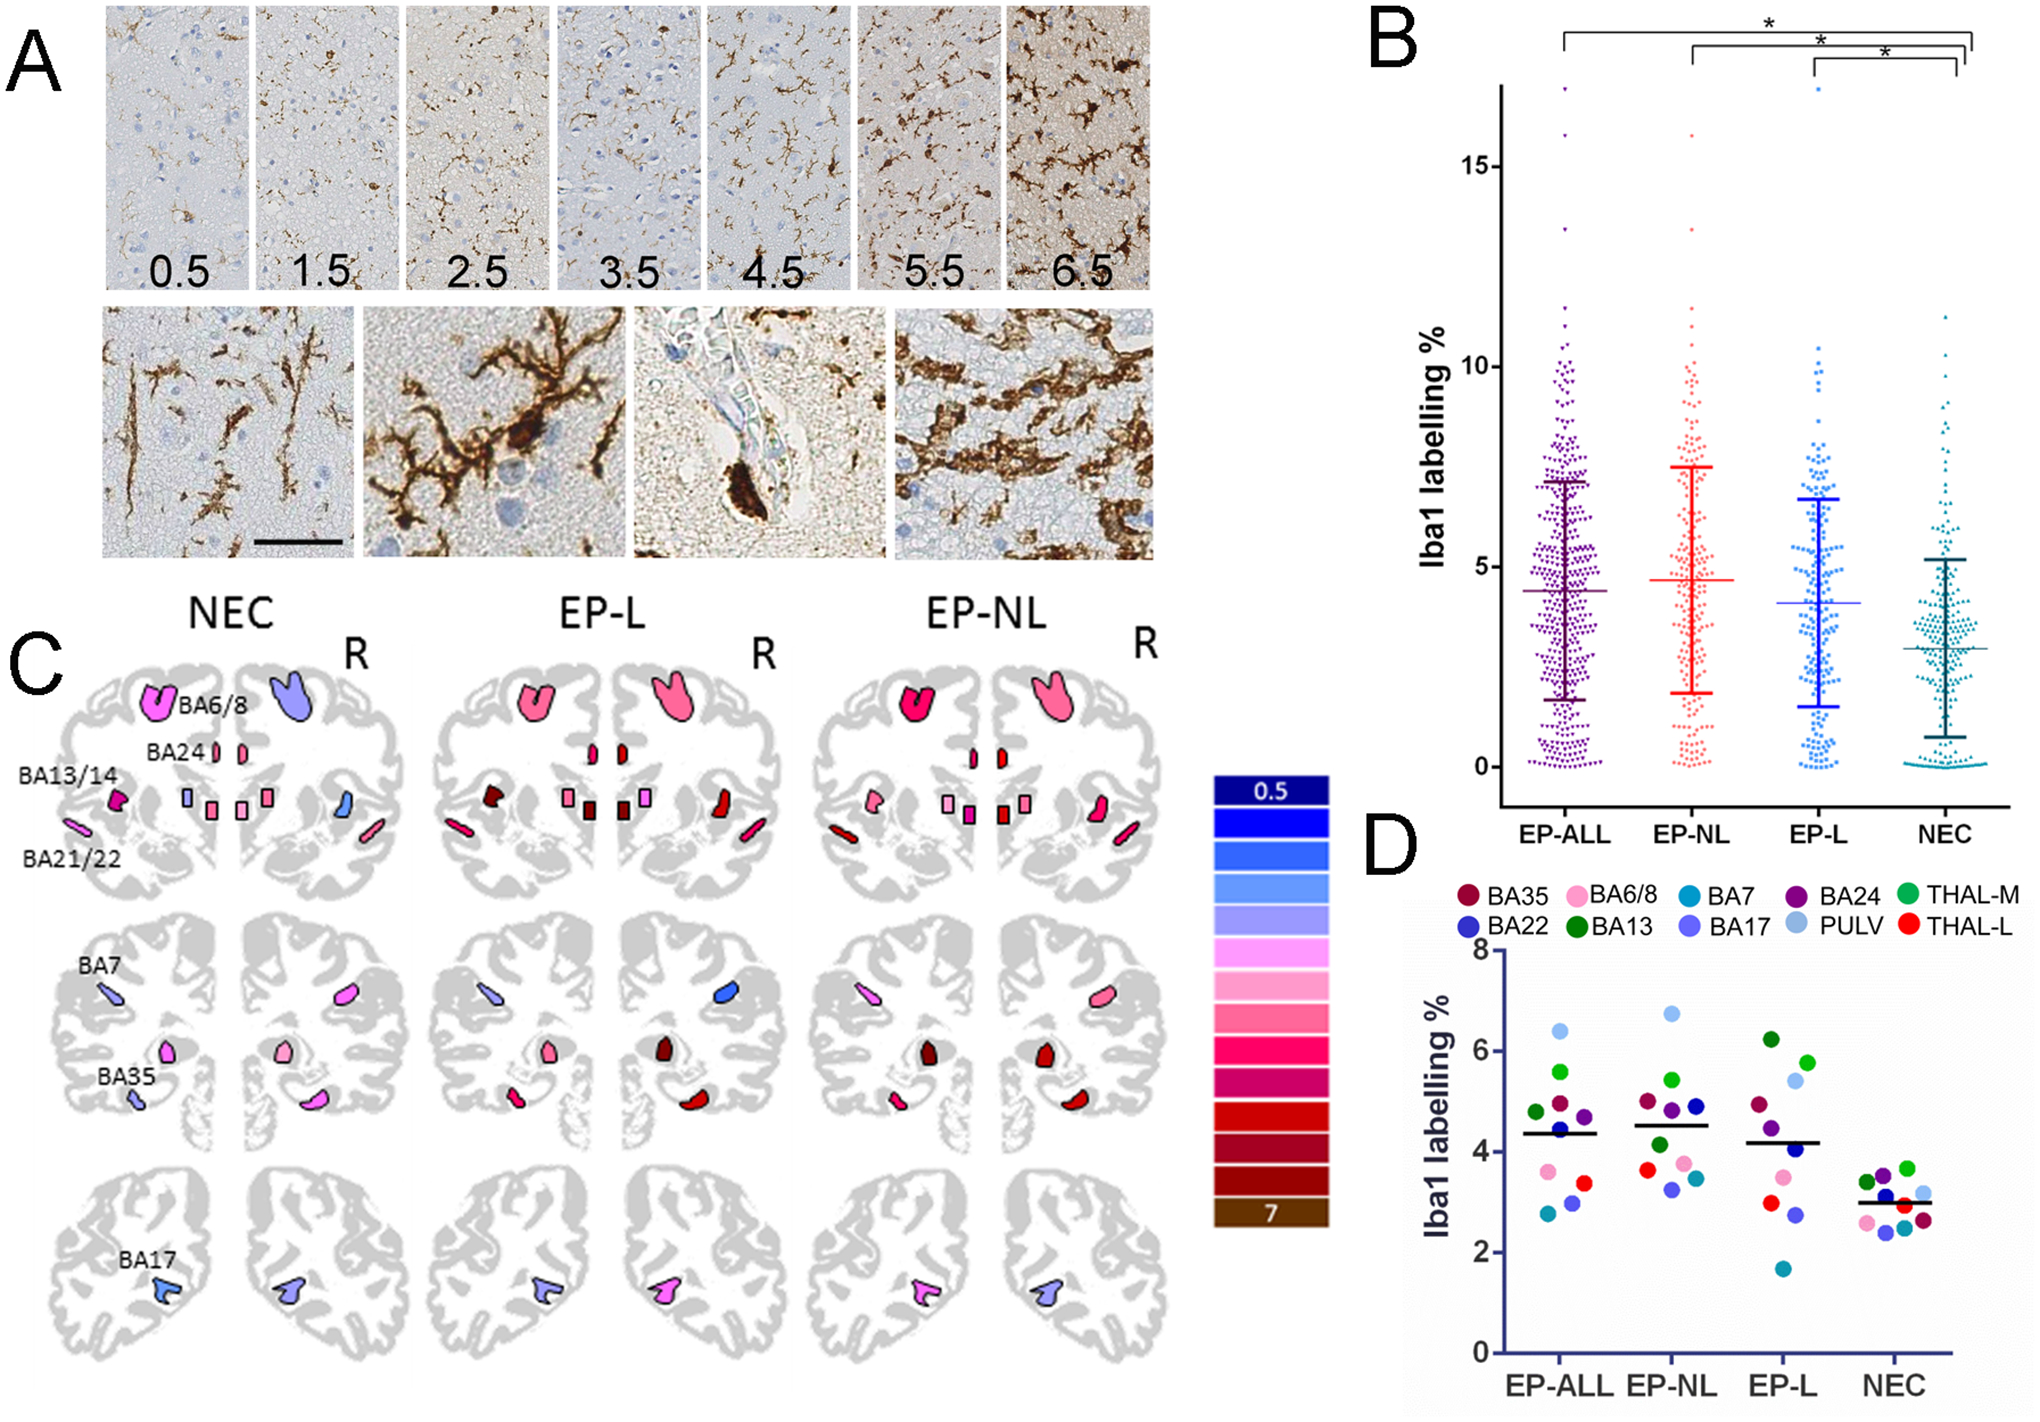
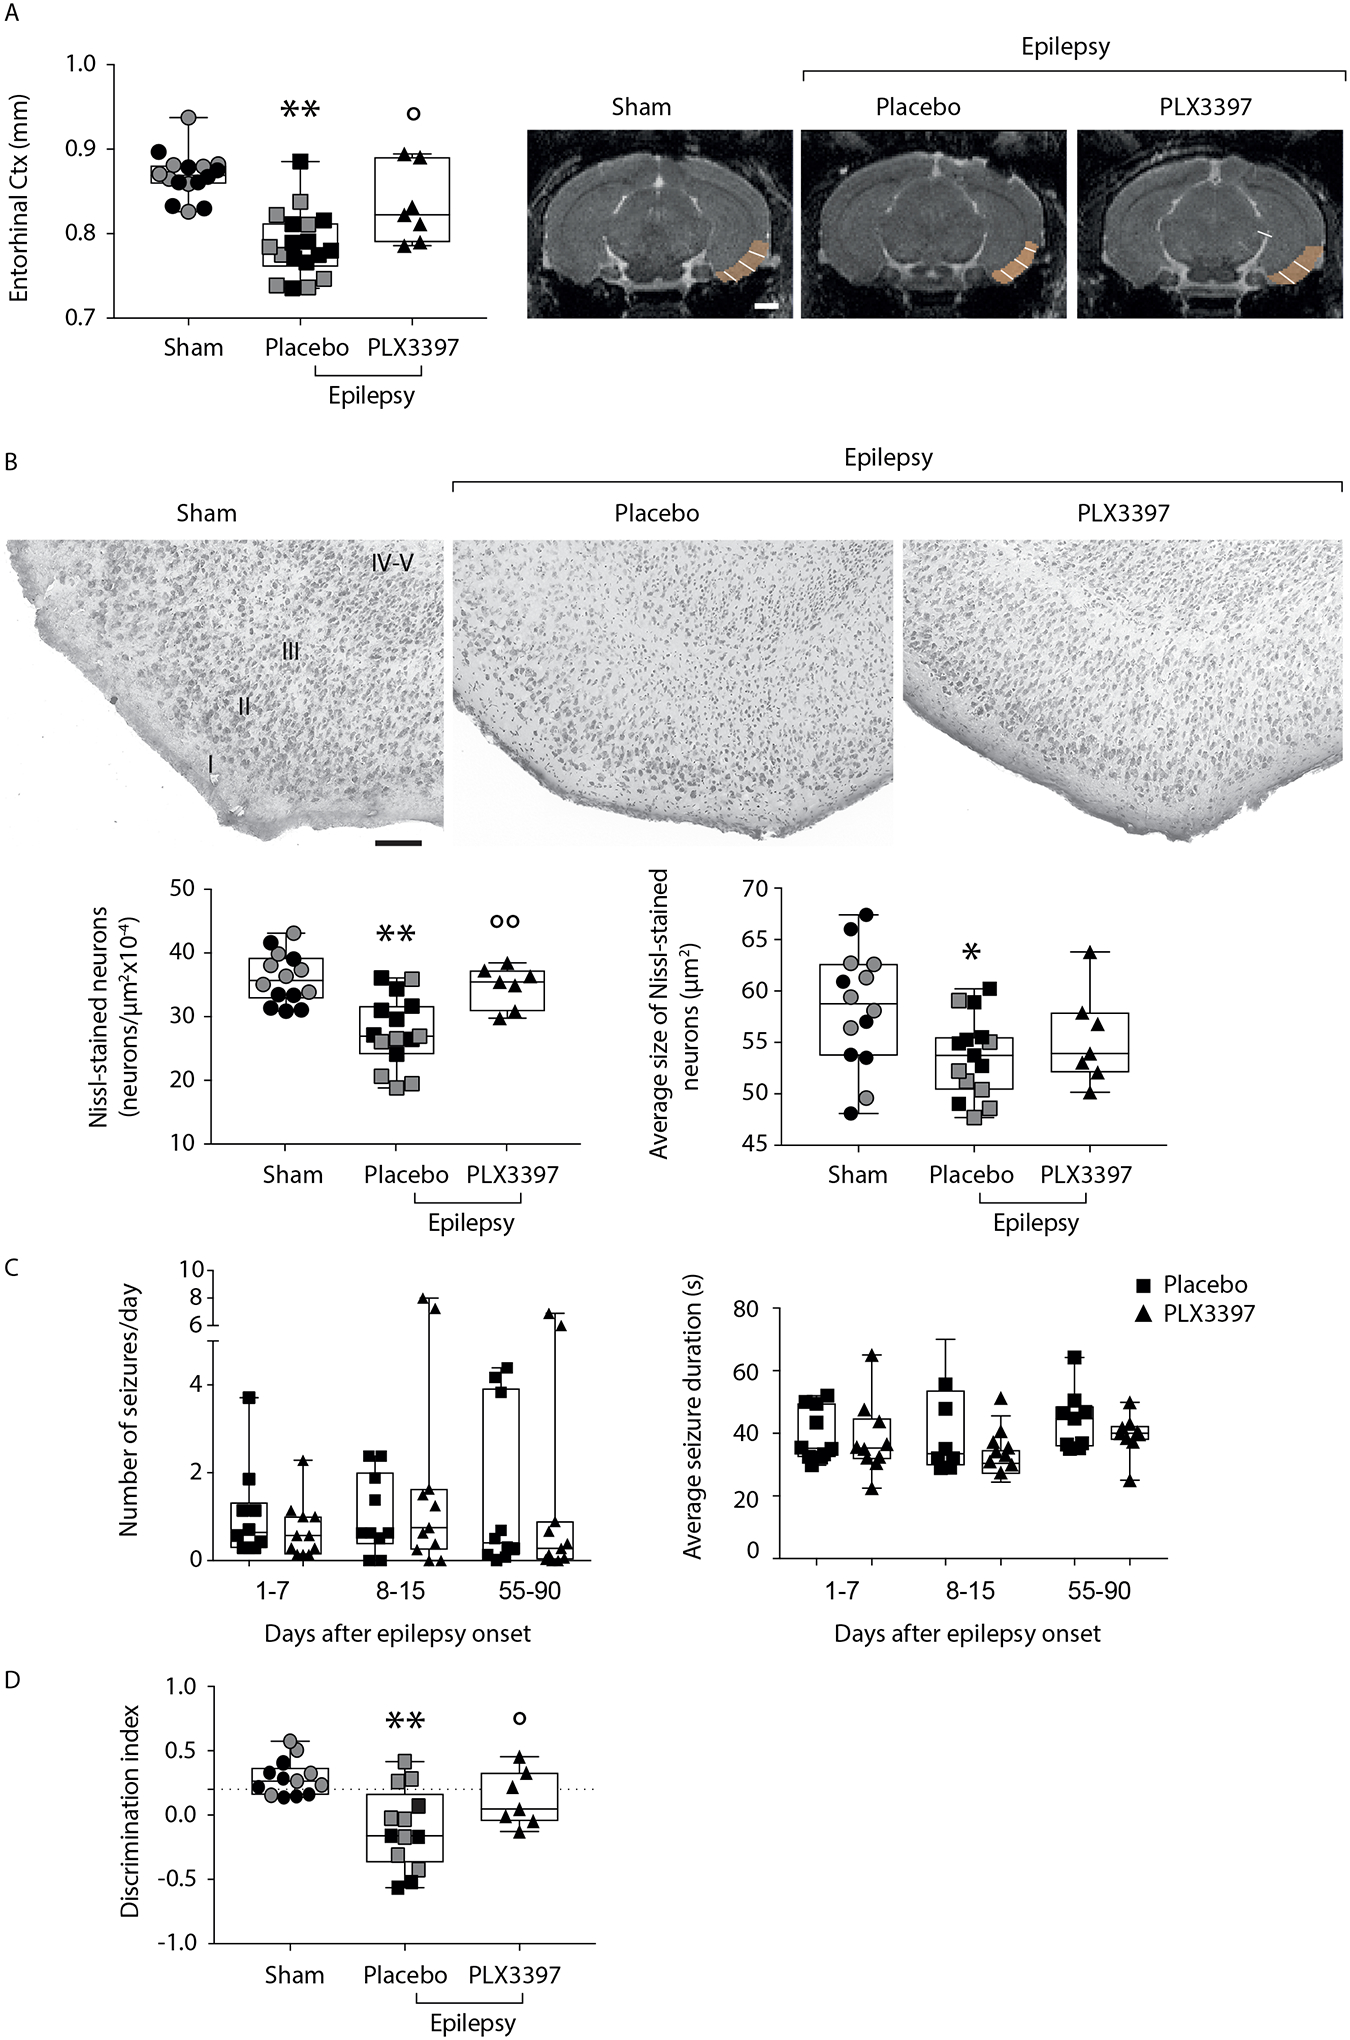
Methods: Imaging-based cortical structural maps from a large-scale epilepsy neuroimaging study were overlaid with highly spatially resolved human brain gene expression data from the Allen Human Brain Atlas. Cell-type deconvolution, differential expression analysis and cell-type enrichment analyses were used to identify differences in cell-type distribution. These differences were followed up in post-mortem brain tissue from humans with epilepsy using Iba1 immunolabelling. Furthermore, to investigate a causal effect in cortical thinning, cell-type-specific depletion was used in a murine model of acquired epilepsy.

Results: We identified elevated fractions of microglia and endothelial cells in regions of reduced cortical thickness. Differentially expressed genes showed enrichment for microglial markers and, in particular, activated microglial states. Analysis of post-mortem brain tissue from humans with epilepsy confirmed excess activated microglia. In the murine model, transient depletion of activated microglia during the early phase of the disease development prevented cortical thinning and neuronal cell loss in the temporal cortex. Although the development of chronic seizures was unaffected, the epileptic mice with early depletion of activated microglia did not develop deficits in a non-spatial memory test seen in epileptic mice not depleted of microglia.

Conclusions: These convergent data strongly implicate activated microglia in cortical thinning, representing a new dimension for concern and disease modification in the epilepsies, potentially distinct from seizure control.

Keywords: MRI; cortical thinning; gene expression; post mortem.


Conflict of interest statement

Conflict of Interest statements

C.D.W. is now an employee of Biogen Research and Early Development (Cambridge, Massachusetts, 02142, USA).

Figures

Fig. 1.
Fig. 1.. Analysis overview
Panel A: The ENIGMA-Epilepsy study identified “vulnerable” and “relatively protected” brain regions indicated in red and blue, respectively (second column; top) [8]. Cortical samples of the AIBS dataset (purple dots; first column, bottom) were marked as either “vulnerable” (red dots) or “relatively protected” (blue dots) depending on their location (second column; middle). Brain cell-type fractions were estimated from the gene expression data and the differential analysis showed an increased fraction of microglia and endothelial cells in “vulnerable” compared to “relatively protected” regions. Differential gene expression analysis between the two groups followed by pathway analysis confirmed the enrichment for marker genes for microglia as well as immune activation related pathways. Panel B: LD score regression estimating the enrichment of immune response eQTL signatures in different epilepsy GWAS finds strong enrichment in disease severity (drug-resistant vs drug-susceptible) but not in disease risk (cases vs controls).
Fig. 2.
Fig. 2.. Presence of excess activated microglia in post mortem brain tissue from people with epilepsy
Panel A: High magnification of morphological types of Iba1-labelled cells including (a) ‘rod’ cells, (b) ramified microglia, (c) perivascular macrophage and (d) amoeboid forms. Fixation time in illustration of ramified microglia was 467 days (bar = 30 microns). Right column shows Iba1 labelling in randomly selected from cases in the study (representing all three groups) with a range of immunostaining quantified from 0.5 to 6.5% field fraction with progressive increase in complexity, number and size of ramified microglial (all taken at X20). Panel B: Scatter graph of all data points from 709 sections including all brain regions showing mean and standard deviation for labelling index in the four main groups: Epilepsy-ALL (EP-ALL), Epilepsy Non-Lesional (EP-NL), Epilepsy-Lesional (EP-L) and non-epilepsy controls (NEC). EP-ALL, EP-NL, EP-L are all significantly greater than NEC (*respective P-values: 4.0×10⁻¹³, 3.7×10⁻¹³, 3.5×10⁻¹³). Panel C. Iba1 immunolabelling shown in 10 Brodmann areas and thalamus in each hemisphere, colour coded for the mean percentage labelling index in the three groups as in B. Panel D. Scatter graph of the mean Iba1 LI in the same Brodmann areas and thalamus (averaged over both hemispheres) in the three groups as in B.
Fig. 3.
Fig. 3.. Effects of microglia depletion in the early disease phase on entorhinal cortex thickness and neuronal cell loss, and on cognitive deficit in epileptic mice
The experimental design is depicted in Fig. S1A. Grey symbols represent sham (n=6–8) and epileptic mice fed with placebo diet (n=8) run in parallel with experimental mice of Fig 3C (see text for details). Panel A: box-and-whisker plots depicting median, minimum, maximum and single values related to the entorhinal cortex thickness, as assessed by quantitative post mortem MRI analysis performed in epileptic mice at the end of EEG monitoring (placebo are mice fed with non-medicated diet: n=18; PLX3397 are mice fed with medicated diet supplemented with PLX3397: n=7), and in sham mice (not exposed to status epilepticus; n=16). MRI images depict representative slices showing the ROI used to quantify the cortical thickness. Four mice in the PLX3397 group did not undergo MRI analysis and therefore they were not included in the subsequent histological (B) and behavioral analyses (D). The white line within the ROI was manually drawn to measure the cortical thickness. **P=0.0001 vs sham; °P=0.022 vs placebo by ANOVA followed by Tukey’s test. Scale bar: 1 cm. Panel B: representative Nissl-stained sections (top row) of the entorhinal cortex in the experimental groups (top row; sham, n=14; placebo, n=15; PLX3397, n=7), and the relative quantification of the number and the average size of Nissl-stained neurons (bottom row). Two sham and three placebo mice were excluded from the analysis due to poor quality of Nissl staining. Data are shown by box-and-whisker plots depicting median, minimum, maximum and single values *P=0.0037, **P=0.0001 vs sham; °°P=0.006 vs placebo diet by ANOVA followed by Tukey’s test. Scale bars: 100 μm. Panel C: box-and-whisker plots depicting median, minimum, maximum and single values of the number of spontaneous seizures/day and their average duration during days 1–7, 8–15 and 55–90 from epilepsy onset (day 1) in the placebo (n=10) and PLX3397-supplemented diet (n=11) experimental groups (protocol in Fig. S1A). Friedman’s two-way nonparametric ANOVA (p=0.041) followed by post-hoc multiple comparisons test with Bonferroni correction: P-values for Number of seizures/day: p=0.363, days 1–7; p=0.339, days 8–15; p=0.965, days 55–90; P-values for Seizures duration: p=0.799, days 1–7; p=0.325, days 8–15; p=0.262, days 55–90. Outliers were identified only for the Number of seizures/day in the placebo group (n=1 in days 1–7) and in the PLX3397 group (n=2 in days 8–15 and n=2 in days 55–90), however, their omission did not change the results of the primary statistical analysis therefore the values were not removed from the corresponding data set (P-values for sensitivity analysis: p=0.831, days 1–7; p=0.375, days 8–15; p=0.084, days 55–90). Panel D: Novel object recognition test (NORT) in epileptic mice fed with placebo- (n=13) or PLX3397-supplemented diet (n=7), and sham controls (n=13). Three sham and five placebo diet epileptic mice were excluded from the analysis since they showed a total exploration time <6 sec during the familiarisation phase. Memory was evaluated by measuring the discrimination index, which was calculated as time spent (sec) exploring the familiar (F) and the novel (N) object as follows: (N - F)/(N + F). Data are shown by box-and-whisker plots depicting median, minimum, maximum and single values, differences significant at **P=0.0004 vs sham by ANOVA followed by Tukey’s test; *P=0.049 vs placebo by Mann-Whitney test.

Comment in

References

    1. Orsini A, Zara F, Striano P. Recent advances in epilepsy genetics. Neurosci Lett. 2018;667:4–9. - PubMed
    1. The International League Against Epilepsy Consortium on Complex Epilepsies. Genetic determinants of common epilepsies: a meta-analysis of genome-wide association studies. Lancet Neurol. 2014;13(9):893–903. - PMC - PubMed
    1. The International League Against Epilepsy Consortium On Complex Epilepsies. Genome-wide mega-analysis identifies 11 new loci and highlights diverse biological mechanisms in the common epilepsies. Nat Commun. 2018;9:5269. - PMC - PubMed
    1. Barkovich AJ, Dobyns WB, Guerrini R. Malformations of Cortical Development and Epilepsy. Cold Spring Harb Perspect Med. 2015;5(5):a022392. - PMC - PubMed
    1. Bell GS, Neligan A, Giavasi C, Keezer MR, Novy J, Peacock JL, et al. Outcome of seizures in the general population after 25 years: A prospective follow-up, observational cohort study. J Neurol Neurosurg Psychiatry. 2016;87(8):843–50. - PubMed

Publication types