. 2021 Aug 13;22(1):224.
doi: 10.1186/s13059-021-02447-3.

Straglr: discovering and genotyping tandem repeat expansions using whole genome long-read sequences

Affiliations

Straglr: discovering and genotyping tandem repeat expansions using whole genome long-read sequences

Readman Chiu et al. Genome Biol. .

Abstract

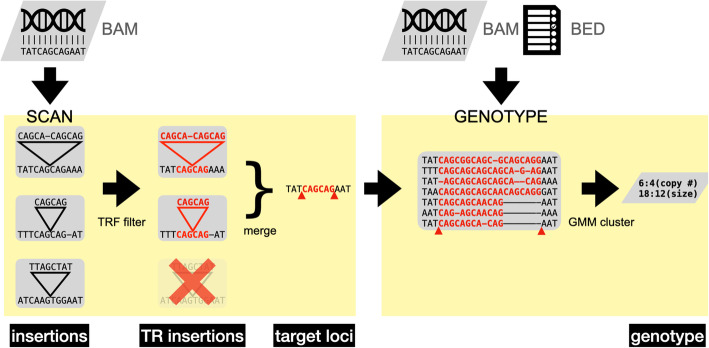
Tandem repeat (TR) expansion is the underlying cause of over 40 neurological disorders. Long-read sequencing offers an exciting avenue over conventional technologies for detecting TR expansions. Here, we present Straglr, a robust software tool for both targeted genotyping and novel expansion detection from long-read alignments. We benchmark Straglr using various simulations, targeted genotyping data of cell lines carrying expansions of known diseases, and whole genome sequencing data with chromosome-scale assembly. Our results suggest that Straglr may be useful for investigating disease-associated TR expansions using long-read sequencing.


Conflict of interest statement

The authors declare that they have no competing interests.

Figures

Fig. 1
Fig. 1
Genotyping benchmark (simulated data): repeat capture. a Repeat size distribution of genotyping results from Straglr (ST), tandem-genotypes (TG) and RepeatHMM (RH) compared against real sizes (Truth) in simulated samples. Each sample is composed of 17 heterozygous loci (Table 1) with a reference and expanded alleles. Violin plot of each tool (orange, right) is juxtaposed with violin plot of the real distribution (blue, left) in each of the nine samples with different expansion sizes. Horizontal lines within the violin plot indicate the actual repeat sizes (y-positions) and relative frequencies (widths) detected. Red lines indicate sizes classified (ST) or generated (Truth) as the expanded allele (AH), green the reference (AL) allele, and black unclassified. PKS indicates the p value from a KS test comparing the tool’s estimated and truth repeat size distributions. b True-positive (TP), false-positive (FP), and false-negative (FN) histograms in each of the nine experiments. Classifications are separated for expanded (dark red) and reference (green) alleles in ST based on the reported genotypes. No classification is possible with RH as supporting read identities were not revealed. Numbers in RH just indicate the total number of Truths reads plus the difference detected; e.g., 305 + 6 indicate 311 reads in total were detected by RH, 6 more than the total truth
Fig. 2
Fig. 2
Genotyping benchmark (simulated data): resolving power. A series of bi-allelic (a) and tri-allelic (b) samples composed of a “base” expansion (columns) at 17 disease loci (legend) combined with one (a) or two (b) larger alleles separated from the next smaller allele by a fixed separation size (rows). Red vertical lines indicate the targeted allele sizes for simulation in each sample. Colored circles represent the allele sizes (x-axis) reported by Straglr for each locus (y-axis)
Fig. 3
Fig. 3
FXS mosaicism simulation. The Y-axis labels specify the composition of full (FM) and premutation (PM) alleles in each mosaic sample simulated. The left panel plots the number of reads simulated (white) overlaid by the number of reads assigned by Straglr for each allele (green) in each sample. The right panel plots the copy number(s) simulated (white) overlaid by Straglr’s reported copy number(s) (green) for each sample. The horizontal length of each green bar represents the average of results from ten samples of the same composition and the error bar represents the 95% confidence interval. Thirty simulated reads spanning the FMR1 repeat locus with the specified allele composition is used as the input for each experiment. FM allele has 500 repeats and PM has 150 repeats
Fig. 4
Fig. 4
PacBio’s No-Amp targeted sequencing benchmark. Per-read repeat size distributions obtained from genotyping results of Straglr (blue) and PacBio’s repeat analysis (orange) were plotted for the eight samples (columns) in the No-Amp targeted sequencing dataset at four target loci (rows). Y-axis represents the density for each detected repeat size in the distribution. The four HTT and three FMR1 repeat-expansion samples are highlighted by a pink background
Fig. 5
Fig. 5
Genotyping benchmark for AQ3 HG00733: sizing accuracy. Correlation of the mean allele size (AS¯tool) reported by Straglr (ST), tandem-genotypes (TG), and RepeatHMM (RH) against the mean allele size (AS¯asm) determined from the HG00733 assembly between 200 and 4000 bp at 2992 annotated (hg38 Simple Repeats) loci that all three tools were able to genotype. AS¯tool was calculated as the mean of all repeat sizes reported by the tool at a given locus. R = Pearson correlation coefficient. Linear correlation equation is shown
Fig. 6
Fig. 6
Heterozygous loci genotyping benchmark for HG00733. Comparison of allele sizes determined from the assembly against Straglr’s genotyping results for 418 annotated heterozygous loci (see the “Results” section for selection criteria). Each radial line in the circular plot represents a locus. The chromosome on which the locus lies is shown as a number and arc along the circumference. The black segment on each radial line represents the span in size (bp) between the two alleles determined from the assembly. Colored circle markers on each radial line indicate allele sizes according to Straglr’s genotype. One or two markers may be present on each radius because Straglr may only report a single allele that is found heterozygous by the assembly. Green markers represent agreement between the allele sizes (see the “Methods” section for matching criteria), red indicates disagreement
Fig. 7
Fig. 7
Characterization of homozygous and heterozygous expansions detected in HG00733 Straglr genome scan. a Correlation of TR sizes of homozygous loci (see the “Results” section for selection criteria) detected by Straglr genome scan (ST) and their corresponding sizes determined from the assembly (ASM). Averages of two alleles from the assembly were calculated and plotted because two differently sized TR may have been reconstructed in the assembly. b Heterozygous loci based on Straglr genome scan (see the “Results” section for selection criteria). Each radial line in the circular plot represents a locus. The chromosome on which the locus lies is shown as a number and arc along the circumference. The black segment on each radial line represents the span in size (bp) between the two alleles within Straglr’s genotype. Colored circle markers on each radial line indicate allele sizes determined from the assembly. One or two markers may be present on each radius because the assembly may only report a single allele that is found heterozygous by Straglr. Green markers represent agreement between the allele sizes (see the “Methods” section for matching criteria), red indicates disagreement
Fig. 8
Fig. 8
Runtime comparison. Sequences from HG00733 (accession SRR7615963) were randomly sub-sampled to generate six samples of different read depths: 11, 16, 22, 33, 44, and 87X (original library). Runtimes were shown for running the aligners alone (minimap2 or LAST), the analysis tools alone (Straglr or tandem-genotypes), and the sum (minimap2 + Straglr, LAST + tandem-genotypes) using 32 threads/processors. tandem-genotypes time is taken from the longest completion time of any one of the 32 equal-size batches (22,445 loci) generated from hg38 simple repeats. LAST alignment times are the sum of running last-train and lastal
Fig. 9
Fig. 9
Straglr workflow. Straglr has two stages: Scan and Genotype. Inputting a bam file, the Scan stage identifies insertions, filters them for tandem repeats, and merges reads to annotate events at target loci. Inputting bam and bed files, the Genotype stage uses a Gaussian mixture model to cluster reads into alleles to report copy numbers of repeat motifs and the nucleotide lengths of tandem repeats

References

    1. Mantere T, Kersten S, Hoischen A. Long-read sequencing emerging in medical genetics. Front Genet. 2019;10:426. doi: 10.3389/fgene.2019.00426. - DOI - PMC - PubMed
    1. Shafin K, Pesout T, Lorig-Roach R, Haukness M, Olsen HE, Bosworth C, Armstrong J, Tigyi K, Maurer N, Koren S, Sedlazeck FJ, Marschall T, Mayes S, Costa V, Zook JM, Liu KJ, Kilburn D, Sorensen M, Munson KM, Vollger MR, Monlong J, Garrison E, Eichler EE, Salama S, Haussler D, Green RE, Akeson M, Phillippy A, Miga KH, Carnevali P, Jain M, Paten B. Nanopore sequencing and the Shasta toolkit enable efficient de novo assembly of eleven human genomes. Nat Biotechnol. 2020;38(9):1044–1053. doi: 10.1038/s41587-020-0503-6. - DOI - PMC - PubMed
    1. Wenger AM, Peluso P, Rowell WJ, Chang PC, Hall RJ, Concepcion GT, Ebler J, Fungtammasan A, Kolesnikov A, Olson ND, Töpfer A, Alonge M, Mahmoud M, Qian Y, Chin CS, Phillippy AM, Schatz MC, Myers G, DePristo MA, Ruan J, Marschall T, Sedlazeck FJ, Zook JM, Li H, Koren S, Carroll A, Rank DR, Hunkapiller MW. Accurate circular consensus long-read sequencing improves variant detection and assembly of a human genome. Nat Biotechnol. 2019;37(10):1155–1162. doi: 10.1038/s41587-019-0217-9. - DOI - PMC - PubMed
    1. Dohm JC, Peters P, Stralis-Pavese N, Himmelbauer H. Benchmarking of long-read correction methods. NAR Genomics and Bioinformatics. 2020;2:lqaa037. doi: 10.1093/nargab/lqaa037. - DOI - PMC - PubMed
    1. Logsdon GA, Vollger MR, Eichler EE. Long-read human genome sequencing and its applications. Nat Rev Genet. 2020;21(10):597–614. doi: 10.1038/s41576-020-0236-x. - DOI - PMC - PubMed

Publication types

Grants and funding