. 2021 Nov:98:219-233.
doi: 10.1016/j.bbi.2021.08.007. Epub 2021 Aug 11.

Chronic VEGFR-3 signaling preserves dendritic arborization and sensitization under stress

Affiliations

Chronic VEGFR-3 signaling preserves dendritic arborization and sensitization under stress

Adri Chakraborty et al. Brain Behav Immun. 2021 Nov.

Abstract

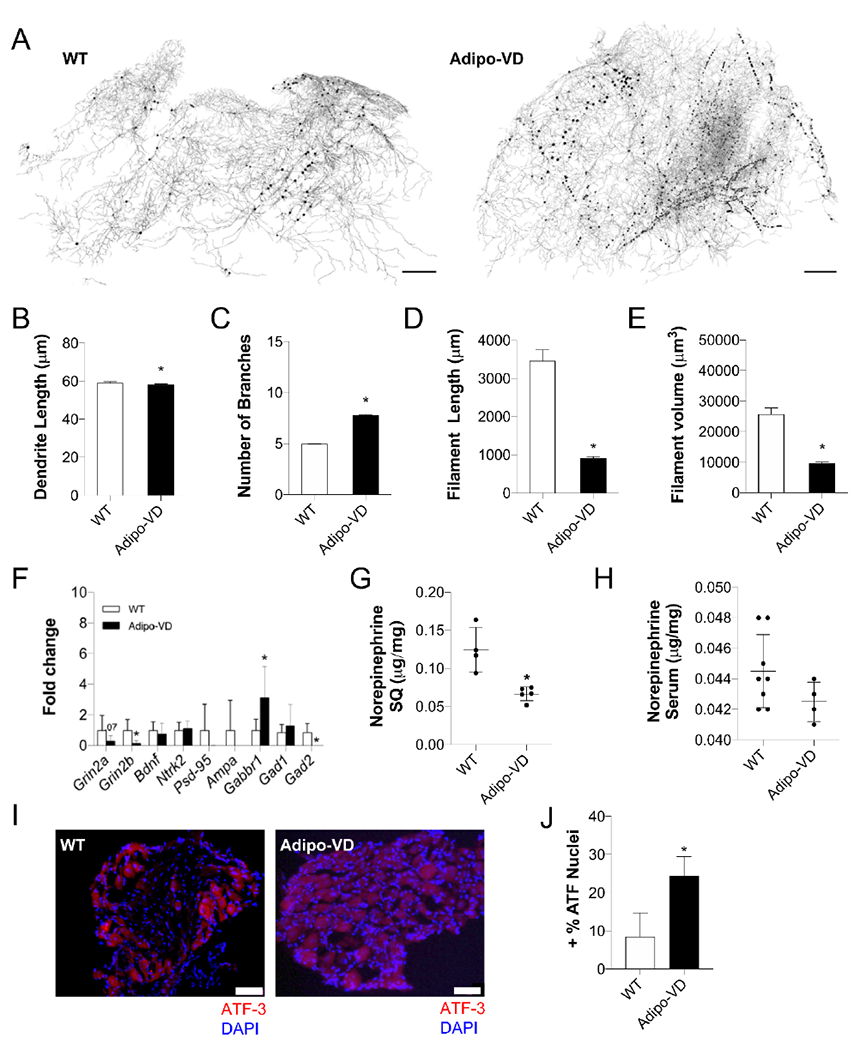
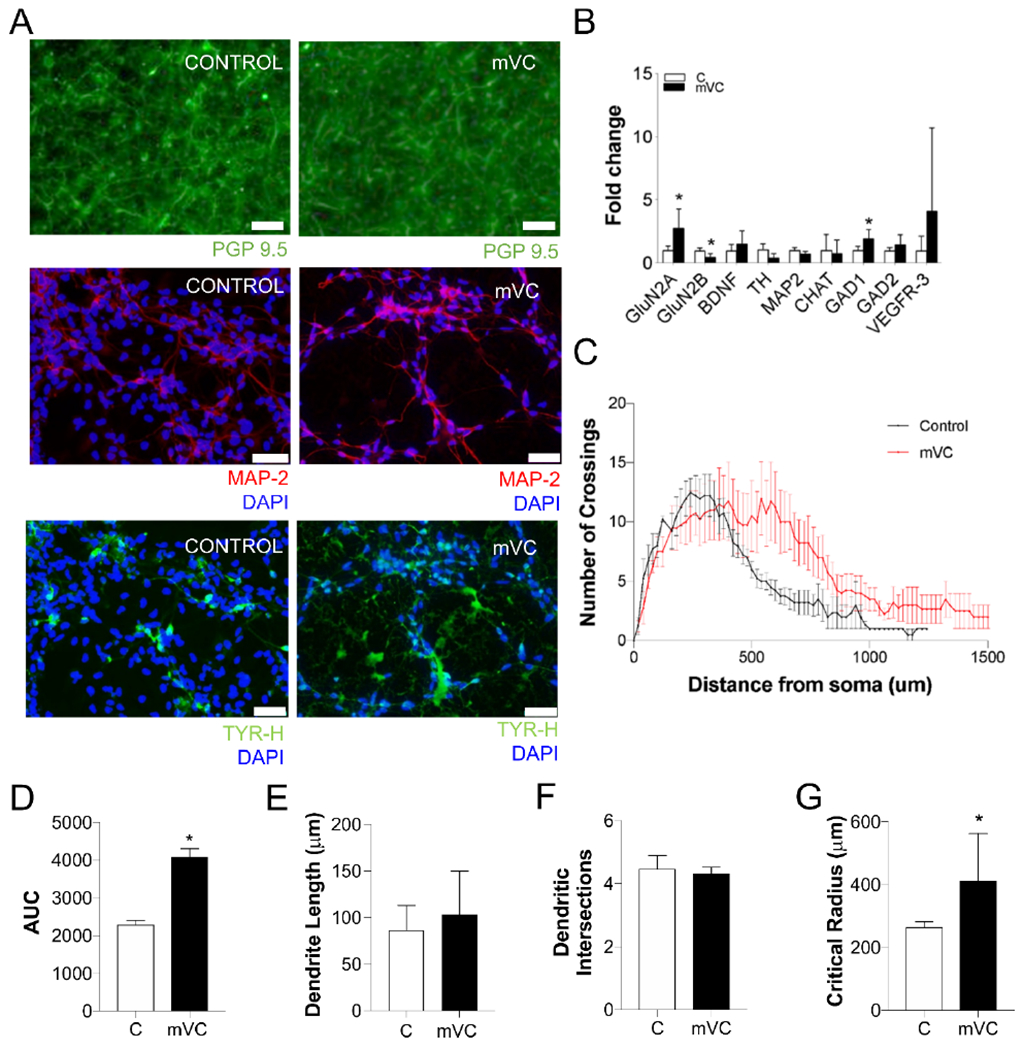
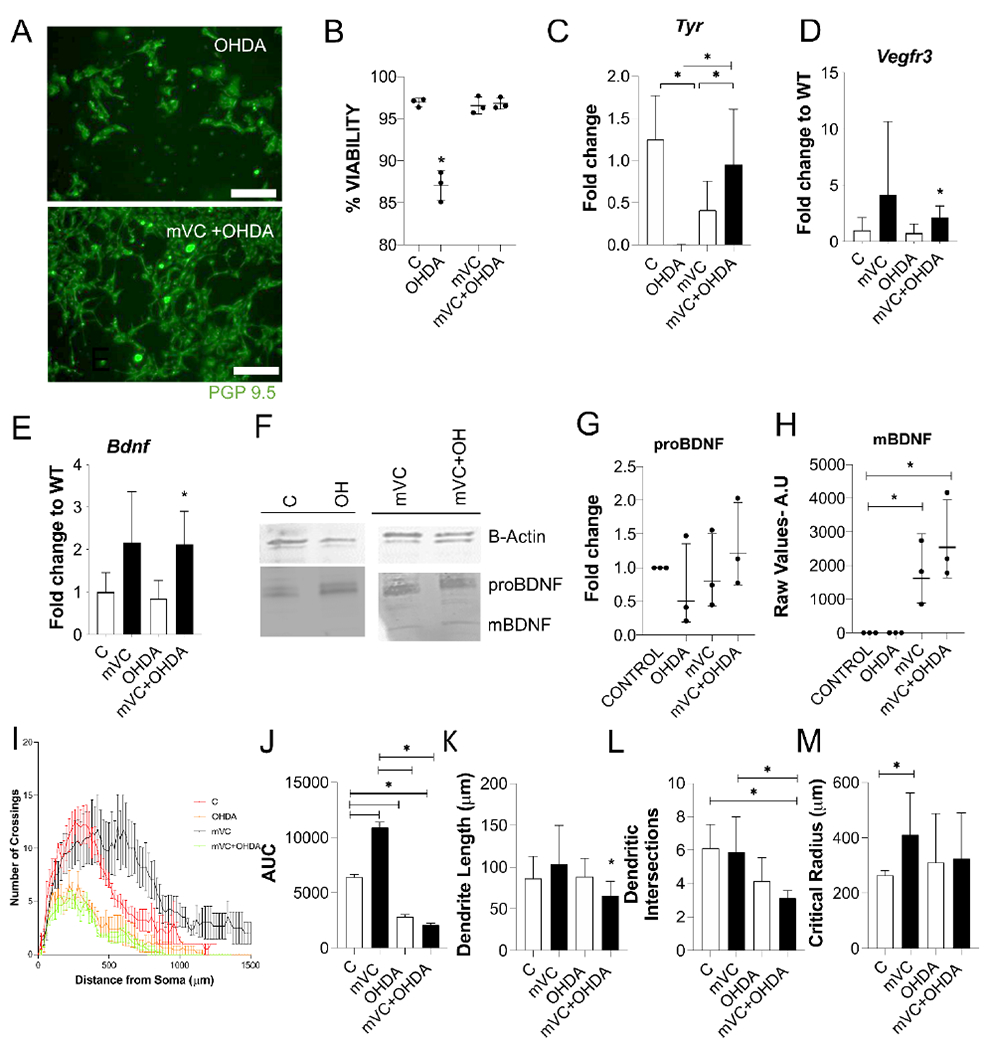
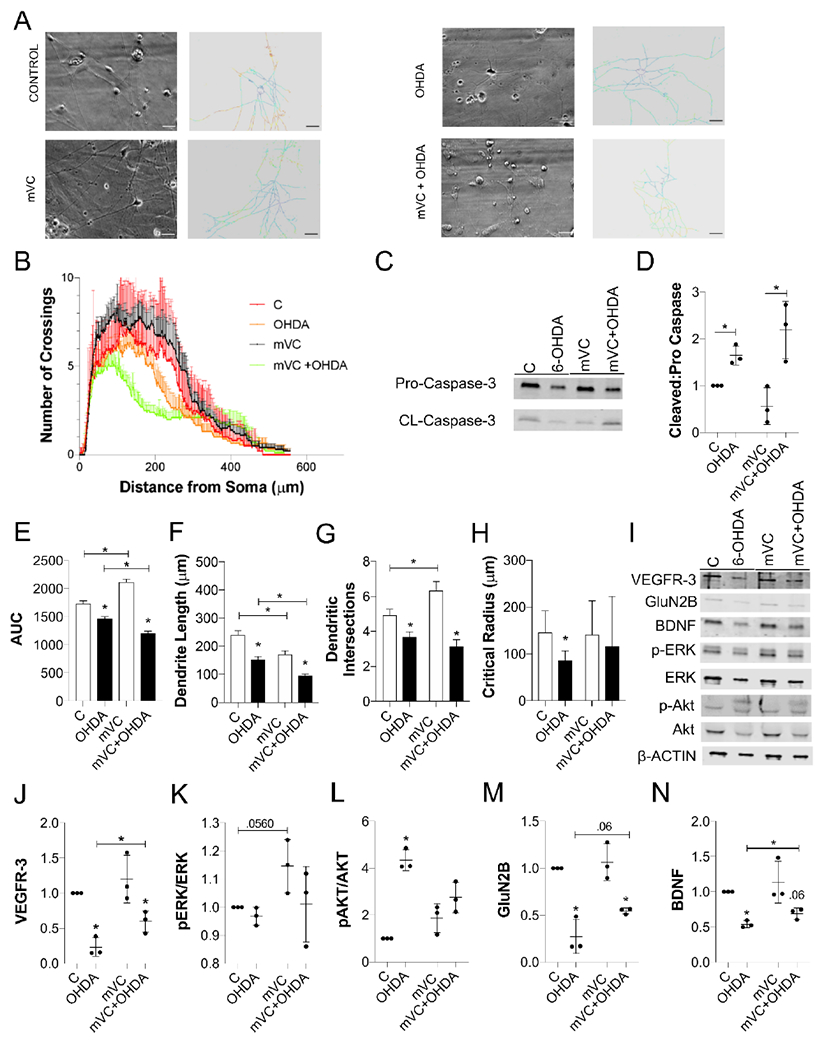
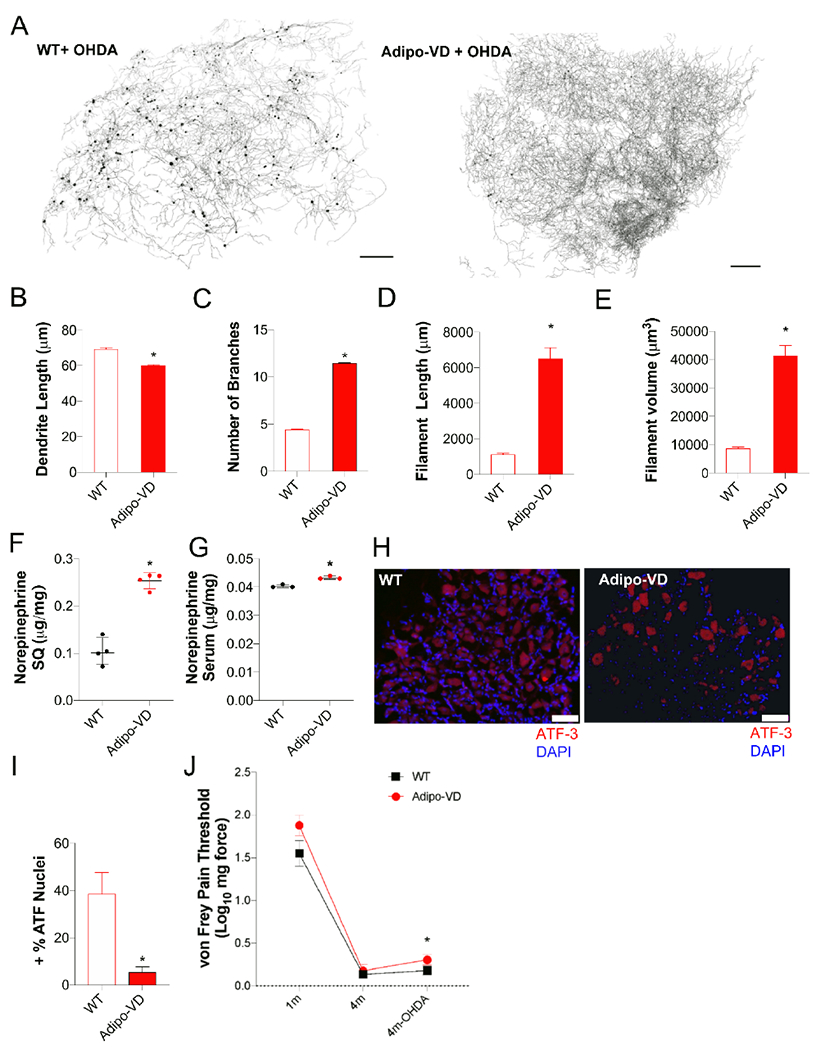
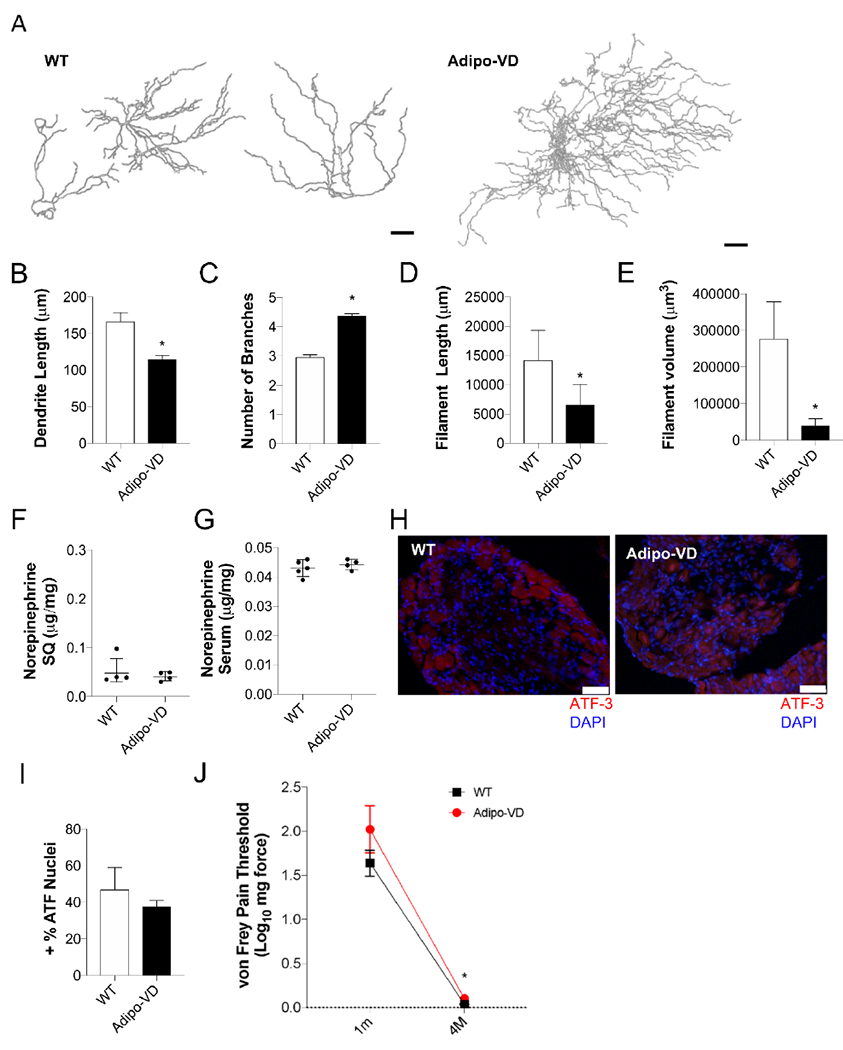
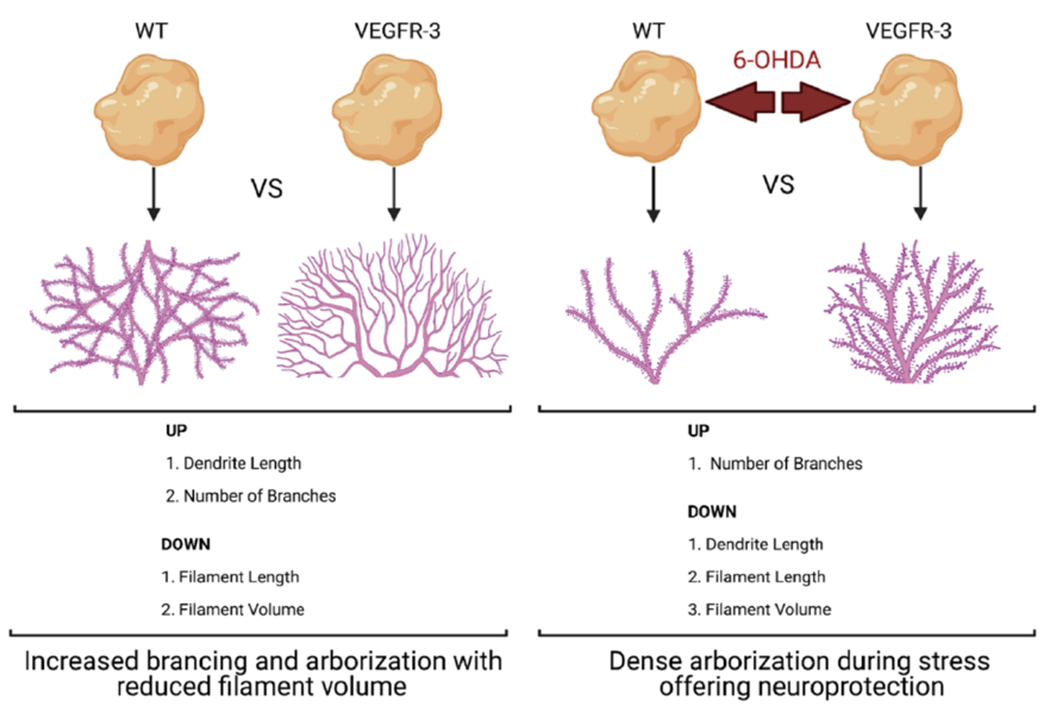
Dendritic arborization is critical for the establishment and maintenance of precise neural circuits. Vascular endothelial growth factor D (VEGF-D), well-characterized as a "lymphangiogenic" growth factor, reportedly maintains dendritic arborization and synaptic strength in the hippocampus of adult mice through VEGF receptor (VEGFR-3) signaling. Here, we investigated the effect of chronic VEGFR-3-specific activation on adipose arbor morphometry using the Adipo-VD mouse, a model of inducible, adipose-specific VEGF-D overexpression. We examined whether adipose tissue innervation was preserved or functionally different in Adipo-VD mice during stress in vivo and if VEGFR-3 signaling afforded neuroprotection to challenged neurons in vitro. Chronic VEGFR-3 signaling in Adipo-VD subcutaneous adipose tissue resulted in a reduction in the dendrite length, dendritic terminal branches (filament length), and dendritic terminal branch volume (filament volume), but increased dendrite branching. We also identified reduced stimulus-evoked excitatory sympathetic nerve activity in Adipo-VD mice. Following 6-hydroxydopamine (6-OHDA) denervation, Adipo-VD dendritic arbors were preserved, including improved dendritic branch volume, length, and dendritic branches than in wildtype tissues. In vitro, we found that chronic elevation of VEGFR-3 signaling in developing mVC neurons changes the dendritic arbor complexity and improves stress-induced structure remodeling. Developing neurons are conferred neuroprotection against stress, potentially by upregulation of proteolytic conversion of pro-BDNF to mature BDNF. Mature neurons, however, display improved dendritic arbor complexity, and unaltered dendritic structural remodeling and improved resistance to stress with VEGFR-3 signaling. Overall, chronically increasing VEGFR-3 signaling in neurons has a synergistic impact on neurosensitization and neuroprotection during stress.

Keywords: Arborization; Dendrite; Neuroprotection; VEGF-C; VEGF-D.


Figures

Figure 1.
Figure 1.. Chronically elevated VEGF-D levels impact subcutaneous adipose tissue innervation.
(A) Volume imaging of subcutaneous adipose neuronal structures in wild type: WT (−rtTA) and Adipo-VD (+rtTA) chow mice; (Map-2, set as grey scale for visual clarity). (B) Comparison of adipose dendrite length (measured from the cell body); (C) dendrite branching; (D) dendritic terminal filament length; and (E) dendritic terminal filament volume in adipose between WT and Adipo-VD mice. (F) RT-qPCR of neuronal phenotype genes in 1-month Adipo-VD mice normalized to ubiquitin and compared to WT tissue. (G) Norepinephrine within WT and Adipo-VD inguinal adipose per mg protein. (H) Serum norepinephrine levels in WT and Adipo-VD mice. (I) ATF3+ (red) positive nuclei (blue) in L3 dorsal root ganglia (DRG) of WT and Adipo-VD mice. (J) Comparison of the ratio of ATF3+ positive nuclei vs total DRG cell body nuclei of WT and Adipo-VD mice. (A) n=3,3; scale bar= 200 μm (B-E) n=3,3 (F) n=6,6 (G) n=4,5 (H) n=8,4 (I-J) n=4,4. *p<0.05 vs −rtTA (B-E) mean ± SEM (F, G, H, J) mean ± SD.
Figure 2.
Figure 2.. Developing neurons differentiated in the presence of VEGFR-3 ligand results in minimal phenotypic change
(A) hiPSC-NSC control and mVC (VEGFR-3-specific mutant VEGF-C) neurons phenotypically characterized using PGP9.5 (green), MAP-2 (red), tyrosine-hydroxylase-TYR-H (green) and DAPI (blue). (B) RT-qPCR of neuronal phenotype genes and VEGFR-3 gene expression were compared between control and mVC neurons at day 31. (C) Sholl quantification of total dendritic intersections of hiPSC-NSC control and mVC neurons. (D) Area under the curve (AUC); (E) dendrite length; (F) dendrite intersection; and (G) critical radius of the dendrite processes calculated from Sholl intersections. (A) PGP 9.5 scale bar= 100 μm. MAP-2and TH scale bar= 20 μm n=2, (B) n=10 Bars represent mean ± SD (C-G) n=10,10 Statistically significant differences are indicated with asterisks, *p < 0.005. Bars represent mean ± SEM.
Figure 3.
Figure 3.. Developing neurons differentiated in the presence of chronic VEGFR-3 ligand display improved dendritic arbor restructuring in-vitro
(A) hiPSC- Neural Stem Cell (NSC) control and mVC (VEGFR-3-specific mutant VEGF-C) neurons after 2 hrs. of 6-hydroxydopamine (6-OHDA represented as OHDA in figures) treatment PGP9.5 (green). (B) PI/trypan Blue exclusion assay based % viable cells calculated across various treatments. (C) RT-qPCR fold change of TYR expression between control, mVC, 6-OHDA and mVC-6-OHDA treated neurons. (D) RT-qPCR of VEGFR-3 gene expression compared between control, mVC, 6-OHDA and mVC-6-OHDA day 31 neurons. (E) RT-qPCR of BDNF gene expression. (F) BNDF immunoblot. (G) pro-BDNF represented as fold change and (H) mature-BDNF represented as raw densitometric arbitrary unit values across neurons with various treatments groups. (I) Quantification of total dendritic intersections through Shall analysis of hiPSC-NSC control, mVC, 6-OHDA and mVC-6-OHDA neurons. (J) Area under the curve (AUC); (K) dendrite length; (L) dendrite intersections; and (M) critical radius of the dendrite processes. (A) PGP 9.5 scale bar= 100 μm, n=2, (B-E) n=10,10 (F, G, H) n=3, (I, J, K, L, M) n=10. Statistically significant differences are indicated with asterisks, *p < 0.005, (B, C, D, E, G, H) Bars represent mean ± SD, (J, K, L, M) Bars represent mean ± SEM.
Figure 4.
Figure 4.. Effects of acute VEGFR-3 activation in hiPSC-Neural Stem Cell (NSC) derived neurons
(A) Representative raw and skeletonized Sholl intersection micrograph of hiPSC-NSC (control, VEGFR-3-specific mutant VEGF-C (mVC), 6-hydroxydopamine (6-OHDA represented as OHDA in figures) and mVC+6-OHDA) neurons. (B) Quantification of total dendritic length, intersections through Sholl analysis. (C, D) Immunoblot and quantified ratio of cleaved:pro caspase across the treatment conditions. (E) Area under the curve (AUC); (F) dendrite length; (G) dendritic intersections; (H) and critical radius of the dendrite processes calculated from Sholl intersections. (I) Immunoblot analysis by using phosphospecific antibodies of hiPSC-NSC neurons with or without mVC and 6-OHDA treatment. (J) Quantification of the immunoblot for VEGFR-3; (K) pERK/Total ERK; (L) pAKT/Total AKT; (M) GluN2B; and (N) BDNF (A) Original scale bar= 100 μm, images cropped with scales adjusted to 100 μm, n=10 (B,E,F,G,H) n=10 (C,D,I-N) n=3 Statistically significant differences are indicated with asterisks, *p < 0.005, (E-H) Bars represent mean ± SEM. (D,J-N) Bars represent mean ± SD.
Figure 5.
Figure 5.. Chronically elevated VEGF-D levels protect inguinal adipose tissue innervation against injury.
(A) Volume imaging of subcutaneous adipose neuronal structures in wild type: WT (−rtTA) and Adipo-VD (+rtTA) chow mice after the injection of 6-hydroxydopamine (represented as OHDA in the figure) in the tissue; (Map-2, set as grey scale for visual clarity). (B) Comparison of adipose dendrite length (measured from the cell body); (C) dendrite branching; (D) dendritic terminal filament length; and (E) dendritic terminal filament volume in adipose between WT and Adipo-VD mice after OHDA. (F) Norepinephrine level within WT and Adipo-VD inguinal adipose per mg protein. (G) Serum Norepinephrine levels of WT and Adipo-VD mice. (H) ATF3+ (red) positive nuclei (blue) in L3 dorsal root ganglia (DRG) of WT and Adipo-VD mice. (I) Comparison of the ratio of ATF3+ positive nuclei vs total DRG cell body nuclei of WT and Adipo-VD mice. (J) Von-Frey pain threshold fold change comparison between WT and Adipo-VD quantified following 1 and 4-month chow diet feeding (+/− 6-OHDA) and all values normalized to WT reading at 1 month. (A) n=3,3 Grey Scale=MAP-2, scale bar= 200 μm (B-E) n=3,3 (F) n=4,4 (G) n=3,3 (H-I) n=4,4 (J) n=40. *p<0.05 vs WT (B-E) mean ± SEM (F, G, I, J) mean ± SD.
Figure 6.
Figure 6.. Tissue innervation in Adipo-VD obese remains unchanged across normal and obese Adipo-VD mice.
(A) Volume imaging of subcutaneous adipose neuronal structures in wild type: WT (−rtTA) and Adipo-VD (+rtTA) high fed diet (HFD) mice; (Map-2, set as grey scale for visual clarity). (B) Comparison of adipose dendrite length (measured from the cell body); (C) dendrite branching; (D) dendritic terminal filament length; and (E) dendritic terminal filament volume in adipose between obese WT and Adipo-VD mice. (F) Norepinephrine concentration within obese WT and Adipo-VD inguinal adipose per mg protein. (G) Serum Norepinephrine levels in obese WT and Adipo-VD mice. (H) ATF3+ (red) positive nuclei (blue) in L3 dorsal root ganglia (DRG) of obese WT and Adipo-VD mice. (I) Comparison of the ratio of ATF3+ positive nuclei vs total DRG cell body nuclei of WT and Adipo-VD mice. (J) Von-Frey pain threshold fold change comparison between WT and Adipo-VD quantified following 1 and 4-month HFD diet feeding and all values normalized to WT reading at 1 month. (A) n=3,3 Grey Scale=MAP-2, scale bar= 200 μm (B-E) n=3,3 (F) n=4,4 (G) n=5,4 (H, I) n=4,4 (J) n=36. *p<0.05 vs WT (B-E) mean ± SEM (F, G, I, J) mean ± SD.
Figure 7.
Figure 7.. Figure summarizing neuronal innervation changes in Adipo-VD mice.
Chronic over expression of the VEGFR-3 ligand VEGF-D in the tissue of Adipo-VD mice alters neuronal dendrite morphology, length, branching, dendritic terminal filament volume and dendritic terminal filament length. This dense arborization response is protective against 6-hydroxydopamine (6-OHDA) neurotoxic stress in vivo and also in cultured neurons. Created with Biorender.com.

References

    1. Pop-Busui R, et al., Inflammation as a Therapeutic Target for Diabetic Neuropathies. Curr Diab Rep, 2016. 16(3): p. 29. - PMC - PubMed
    1. Hozumi J, et al., Relationship between Neuropathic Pain and Obesity. Pain Res Manag, 2016. 2016: p. 2487924. - PMC - PubMed
    1. Tan AM, et al., Maladaptive dendritic spine remodeling contributes to diabetic neuropathic pain. J Neurosci, 2012. 32(20): p. 6795–807. - PMC - PubMed
    1. Flor H, Nikolajsen L, and Staehelin Jensen T, Phantom limb pain: a case of maladaptive CNS plasticity? Nat Rev Neurosci, 2006. 7(11): p. 873–81. - PubMed
    1. Thompson-Peer KL, et al., In vivo dendrite regeneration after injury is different from dendrite development. Genes Dev, 2016. 30(15): p. 1776–89. - PMC - PubMed

Publication types

Substances