. 2021 Aug 13;7(33):eabd6734.
doi: 10.1126/sciadv.abd6734. Print 2021 Aug.

Efferocytosis fuels malignant pleural effusion through TIMP1

Affiliations

Efferocytosis fuels malignant pleural effusion through TIMP1

Lilan Zhao et al. Sci Adv. .

Abstract

Malignant pleural effusion (MPE) results from the capacity of several human cancers to metastasize to the pleural cavity. No effective treatments are currently available, reflecting our insufficient understanding of the basic mechanisms leading to MPE progression. Here, we found that efferocytosis through the receptor tyrosine kinases AXL and MERTK led to the production of interleukin-10 (IL-10) by four distinct pleural cavity macrophage (Mφ) subpopulations characterized by different metabolic states and cell chemotaxis properties. In turn, IL-10 acts on dendritic cells (DCs) inducing the production of tissue inhibitor of metalloproteinases 1 (TIMP1). Genetic ablation of Axl and Mertk in Mφs or IL-10 receptor in DCs or Timp1 substantially reduced MPE progression. Our results delineate an inflammatory cascade-from the clearance of apoptotic cells by Mφs, to production of IL-10, to induction of TIMP1 in DCs-that facilitates MPE progression. This inflammatory cascade offers a series of therapeutic targets for MPE.


Figures

Fig. 1
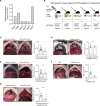
Fig. 1. Phagocytosis of apoptotic cells by Mφs promotes MPE.
(A) Schematic overview of the MPE model. MPE was induced via intrapleural injection of LLC cells in wild-type (WT) mice. (B) Percentage of apoptotic cells in peripheral blood (PB) (n = 5) and MPE (n = 5) was assessed by flow cytometry via annexin V/propidium iodide (PI) staining. Pooled data (left) and representative dot plot (right) showing the frequency of early (bottom right quadrant) or late (top right quadrant) apoptotic cells. (C) Frequency of CD45+ and CD45 cells within annexin V+ apoptotic cells. (D) Expression of MERTK receptor on CD11b+F4/80+ (Mφs) and CD3+ (T cells) immune cells in MPE (n = 5). Left: Dot plots showing the delta mean fluorescence intensities (ΔMFI) of MERTK receptor on Mφs and T cells relative to that of FMO (fluorescence minus one) controls from murine MPE. Right: Flow cytometric histogram graphs showing a representative example from CD11b+F4/80+ (Mφs) expressing MERTK receptor (black open histogram) compared to FMO control (filled gray histogram). (E) Representative images (left) of MPEs (dashed lines) from Csf1rCreAxlf/fMertkf/f (n = 21) and Csf1rCre+Axlf/fMertkf/f (n = 19) mice through the diaphragm and respective MPE quantification (right). (F) IL-10 concentration in MPEs isolated from Csf1rCreAxlf/fMertkf/f (n = 19) and Csf1rCre+Axlf/fMertkf/f (n = 18) mice was analyzed by enzyme-linked immunosorbent assay (ELISA). (B and D) Data of one experiment. (C) Data of two experiments. (E and F) Data of three experiments. Each symbol represents a measurement from a single mouse. Data are means ± SEM. *P < 0.05 and **P < 0.01. Statistical analysis was performed using Wilcoxon signed-rank test (B) or Mann-Whitney U test (E and F). Photo credit: L. Zhao (University Medical Center Hamburg-Eppendorf).
Fig. 2
Fig. 2. Mφs producing IL-10 promote MPE.
(A) MPE was induced in Il10eGFP reporter mice. (B) Left: Gating strategy for the representative FACS plot of IL-10eGFP expression. Right: Percentages of CD45+ IL-10eGFP+ and CD45 IL-10eGFP+ within alive cells from MPE (n = 9). (C) viSNE of IL-10eGFP–producing CD45+ immune cells. Clustering is based on MFI of IL-10eGFP, CD3, FOXP3, CD11b, LY6G, LY6C, F4/80, and MERTK. Black circles indicate the IL-10eGFP–rich region. (D) Source of IL-10eGFP in CD45+ immune cells (left) and CD11b+ myeloid cells from MPE (right). (E) IL-10eGFP expression of CD45+ CD11b+ F4/80+ MERTKhigh (n = 7) and CD45+ CD11b+ F4/80+ MERTKlow (n = 7) cells in MPE. IL-10eGFP histogram (left) and quantitative MFI graphs (right). (F) MPE was induced in LysMCre+-Il10f/f mice and Foxp3Cre+-Il10f/f mice. (G) Representative images of MPEs (left) and respective MPE quantification (right) in LysMCre+-Il10wt/wt (n = 31) and LysMCre+-Il10f/f (n = 20) mice. (H) Correlation between IL-10 concentration and MPE volume in LysMCre+-Il10wt/wt mice (n = 12). Top-right text (r and r2) represents Pearson’s correlation and its coefficient of determination. (I) Representative images of MPEs (left) and respective MPE quantification (right) in Foxp3Cre+-Il10wt/wt (n = 8) and Foxp3Cre+-Il10f/f (n = 14) mice. (J) Intracellular IL-10 staining of CD45+ CD11b+ F4/80+ cells in MPEs isolated from Csf1rCreAxlf/fMertkf/f (n = 5) and Csf1rCre+Axlf/fMertkf/f (n = 5) mice. IL-10 histogram (left) and graph reporting MFI (right). Data of one (B, D, E, H, and J), two (I), or three (G) experiments, respectively, are shown. Each symbol represents a measurement from a single mouse. Data are means ± SEM. ns, nonsignificant. *P < 0.05, **P < 0.01, and ***P < 0.001. Statistical analysis was performed using Mann-Whitney U test (B, G, I, and J) or paired t test (E). Photo credit: L. Zhao (University Medical Center Hamburg-Eppendorf).
Fig. 3
Fig. 3. Identification of MPE-associated myeloid cell populations.
(A) t-SNE representation of aligned gene expression data in single cells (n = 1991) extracted from murine MPE. Cell identities were assigned on the basis of the expression of canonical markers. (B) Heatmap showing the statistically up-regulated genes (ordered by decreasing P value) in each cluster defined in (A) and selected enriched genes used for biological identification of each cluster (scale, log2 fold change). (C) Il10 mRNA expression level and percentage in each cluster. (D) Mertk mRNA expression level and percentage in each cluster. (E) Top: t-SNE representation of four Mφ clusters isolated from murine MPE. Bottom: t-SNE plot of Mertk gene expression (red dot, detected Mertk gene expression; yellow dot, undetected Mertk gene expression).
Fig. 4
Fig. 4. Functional enrichment analysis of Mφs in MPE.
(A to D) Top 10 terms identified by GO enrichment analyses for Mφ_1, Mφ_2, Mφ_3, and Mφ_4 populations. Adjusted P value for each annotation is represented by color scale. Gene ratio is represented by dot size. Enriched terms were identified as significant at an adjusted P ≤ 0.01 and a false discovery rate of ≤0.05. (E) UpSet plot showing the overlap of differentially expressed genes identified in different monocyte/Mφ clusters (Mφ_1, Mφ_2, Mφ_3, and Mφ_4 populations). (F) Top 24 distinct differentially expressed genes identified in (E). Red labeling indicates characteristic cluster genes. (G) Phagocytic capacity of Mφs isolated from pooled MPE of 17 mice. Left: FACS plots showing the four subclusters of sorted MPE Mφs (CD11b+) that bind (4°C) or bind and uptake (37°C) CellTracker-labeled apoptotic thymocytes (aTs) upon 1 hour of coculture. Right: Phagocytic index reporting the difference between percentage of Mφs binding and taking up apoptotic cells (37°C) and percentage of Mφs binding apoptotic cells (4°C).
Fig. 5
Fig. 5. The target cells of IL-10 in MPE are the DCs.
(A) pSTAT3 expression in CD31+, CD45+, CD45+CD3+, CD45+CD4+, CD45+CD8+, and CD45+CD3 cells cultured in the presence of either IL-6 (100 ng/ml) or IL-10 (100 ng/ml), as shown by the histogram of relative expression of pSTAT3 MFI (IL-10 versus IL-6). (B) Graphical representation of cell-specific mouse models of Il10ra deletion or impairment. (C to G) CD11cCre+Il10rawt/wt (n = 19) and CD11cCre+Il10raf/f (n = 17) mice (C), LysMCre+Il10rawt/wt (n = 7) and LysMCre+Il10raf/f (n = 10) (D), Cdh5Cre+Il10rawt/wt (n = 17) and Cdh5Cre+Il10raf/f (n = 11) (E), WT (n = 7) and DN Il10Rα (n = 7) (F), and Foxp3Cre+Il10rawt/wt (n = 11) and Foxp3Cre+Il10raf/f (n = 11) (G) mice were intrapleurally injected with LLC cancer cells. Representative images of MPEs (dashed lines) (left) through the diaphragm and respective MPE quantification (right). Each symbol represents a measurement from a single mouse. Data are means ± SEM. Results were representative of three independent experiments. *P < 0.05 and **P < 0.01. Statistical analysis was performed using Mann-Whitney U test (C to G). Photo credit: L. Zhao (University Medical Center Hamburg-Eppendorf).
Fig. 6
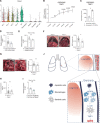
Fig. 6. DC-derived Timp1 promotes MPE.
(A) Violin plots of log-transformed Timp1 gene expression in the indicated cell populations. (B) TIMP1 expression in human monocyte-derived DC (moDC) upon IL-10 exposure for 0 min, 45 min, 2 hours, 4 hours, 8 hours, and 12 hours from GSE45466 dataset. P value or ns compared with 0 hours. (C) The expression levels (counts per million) of TIMP1 in human immature moDCs and immature IL-10 antigen-presenting cells (APCs) from GSE92852 dataset (P < 0.05). (D) qPCR of Timp1 expression in pleural DCs from CD11cCre+Il10raf/f (n = 8) and CD11cCre+Il10rawt/wt (n = 12) mice under MPE condition. (E) qPCR of Timp1 expression in pleural Mφs from LysMCre+Il10rawt/wt (n = 5) and LysMCre+Il10raf/f (n = 5) mice under MPE condition. (F and G) Timp1−/− (n = 19) and WT (n = 13) littermate control mice were intrapleurally injected with LLC cancer cells. (F) Representative images of MPEs (dashed lines) captured through the diaphragm and respective MPE quantification. (G) Representative images of pleural tumors (t), lungs (l), and hearts (h) and respective tumor weight. (H) IL-10 concentration in MPE of WT (n = 11) and Timp1−/− (n = 7) mice quantified via ELISA. (I) qPCR of Timp1 expression in pleural DCs from Csf1r-Cre Axlf/fMertkf/f (n = 7) and Csf1r-Cre+ Axlf/fMertkf/f (n = 7) mice under MPE condition. (J) Graphical abstract: Mφs produce IL-10 upon phagocytosis via MERTK and promote MPE by inducing the secretion of TIMP1 from DC cells. (D) Data of two experiments. (E, H, and I) Data of one experiment. (F and G) Data of three experiments. Each symbol represents a measurement from a single mouse. Data are means ± SEM. *P < 0.05 and **P < 0.01. Statistical analysis was performed using Mann-Whitney U test (C to I). Photo credit: L. Zhao (University Medical Center Hamburg-Eppendorf).

References

    1. Zamboni M. M., da Silva C. T. Jr., Baretta R., Cunha E. T., Cardoso G. P., Important prognostic factors for survival in patients with malignant pleural effusion. BMC Pulm. Med. 15, 29 (2015). - PMC - PubMed
    1. Psallidas I., Kalomenidis I., Porcel J. M., Robinson B. W., Stathopoulos G. T., Malignant pleural effusion: From bench to bedside. Eur. Respir. Rev. 25, 189–198 (2016). - PMC - PubMed
    1. Murthy P., Ekeke C. N., Russell K. L., Butler S. C., Wang Y., Luketich J. D., Soloff A. C., Dhupar R., Lotze M. T., Making cold malignant pleural effusions hot: Driving novel immunotherapies. Onco. Targets. Ther. 8, e1554969 (2019). - PMC - PubMed
    1. Kaczmarek M., Sikora J., Macrophages in malignant pleural effusions—Alternatively activated tumor associated macrophages. Contemp. Oncol. 16, 279–284 (2012). - PMC - PubMed
    1. Kaczmarek M., Nowicka A., Kozlowska M., Zurawski J., Batura-Gabryel H., Sikora J., Evaluation of the phenotype pattern of macrophages isolated from malignant and non-malignant pleural effusions. Tumour Biol. 32, 1123–1132 (2011). - PubMed