. 2021 Aug 13;6(62):eabi5586.
doi: 10.1126/sciimmunol.abi5586.

Clonally expanded, GPR15-expressing pathogenic effector TH2 cells are associated with eosinophilic esophagitis

Affiliations

Clonally expanded, GPR15-expressing pathogenic effector TH2 cells are associated with eosinophilic esophagitis

Duncan M Morgan et al. Sci Immunol. .

Abstract

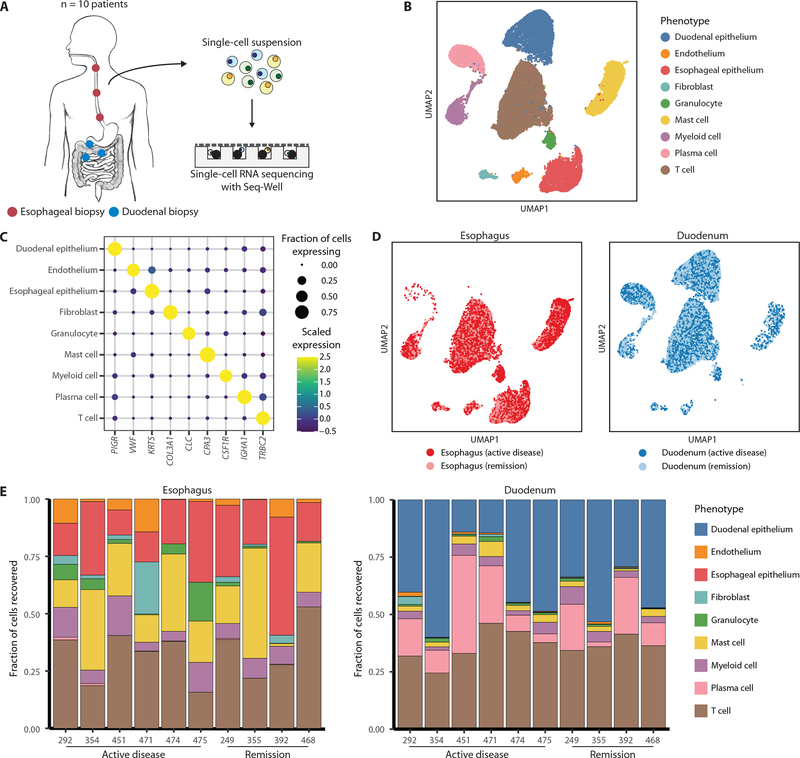
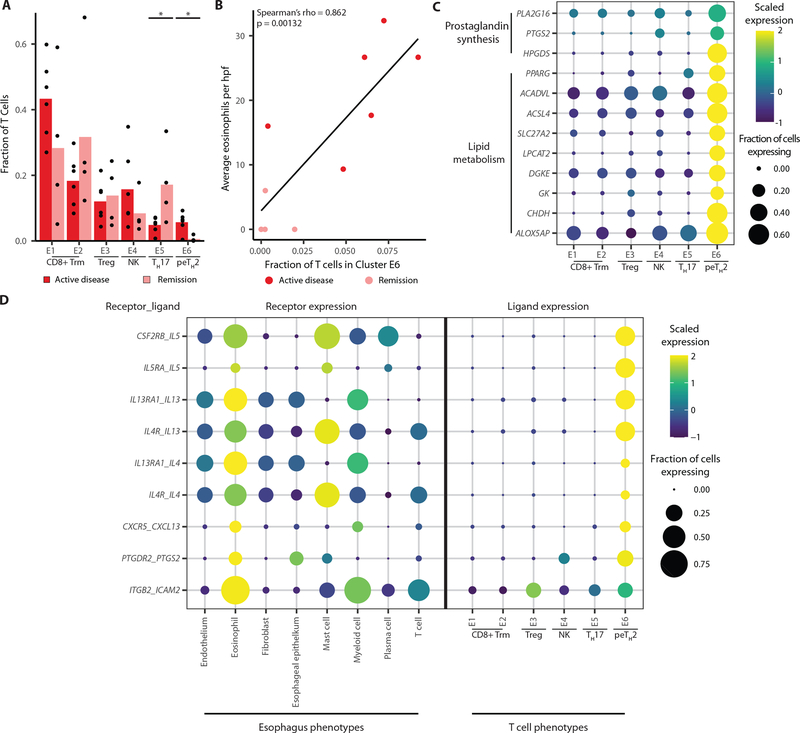
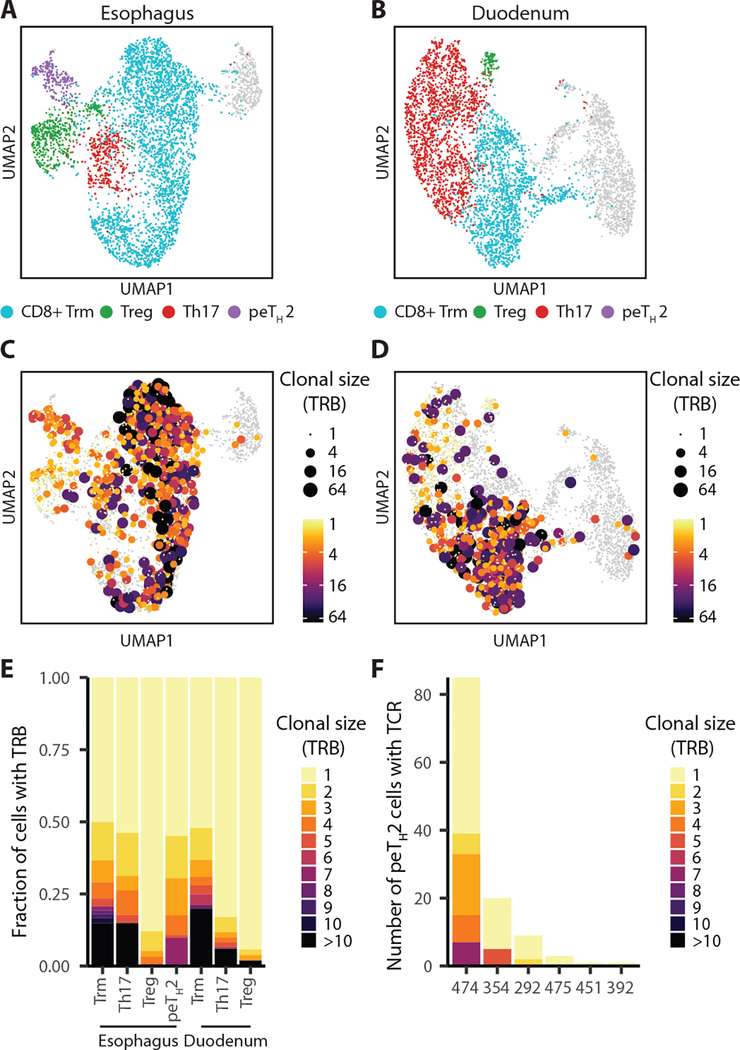
Eosinophilic esophagitis (EoE) is an allergic disorder characterized by the recruitment of eosinophils to the esophagus, resulting in chronic inflammation. We sought to understand the cellular populations present in tissue biopsies of patients with EoE and to determine how these populations are altered between active disease and remission. To this end, we analyzed cells obtained from esophageal biopsies, duodenal biopsies, and peripheral blood of patients with EoE diagnosed with active disease or remission with single-cell RNA and T cell receptor (TCR) sequencing. Pathogenic effector TH2 (peTH2) cells present in the esophageal biopsies of patients with active disease expressed distinct gene signatures associated with the synthesis of eicosanoids. The esophageal tissue-resident peTH2 population also exhibited clonal expansion, suggesting antigen-specific activation. Peripheral CRTH2+CD161- and CRTH2+CD161+ memory CD4+ T cells were enriched for either a conventional TH2 phenotype or a peTH2 phenotype, respectively. These cells also exhibited substantial clonal expansion and convergence of TCR sequences, suggesting that they are expanded in response to a defined set of antigens. The esophagus-homing receptor GPR15 was up-regulated by peripheral peTH2 clonotypes that were also detected in the esophagus. Finally, GPR15+ peTH2 cells were enriched among milk-reactive CD4+ T cells in patients with milk-triggered disease, suggesting that these cells are an expanded, food antigen-specific population with enhanced esophagus homing potential.


Conflict of interest statement

Competing interests: W.G.S., J.C.L., D.M.M., and B.R. are inventors on a pending patent application at Massachusetts General Hospital that covers the results presented in this manuscript. W.G.S. serves on the S.A.B of Aimmune Therapeutics, Allergy Therapeutics, FARE and is a consultant for ALK, Merck, Nestle, Novartis, Regeneron, and Sanofi. J.C.L. is an advisor and co-founder of Honeycomb Biotechnologies. J.C.L.’s interests are reviewed and managed under MIT’s policies for potential conflicts of interests.

Figures

Figure 1.
Figure 1.. Single-cell RNA sequencing of esophageal and duodenal biopsies of EoE patients.
(A) Schematic of biopsy processing pipeline. Biopsies from ten EoE patients (six with active disease, four in remission) were enzymatically dissociated into single-cell suspensions and processed for single-cell RNA sequencing using Seq-Well. (B) UMAP projection of 28,816 cells obtained from the esophageal and duodenal biopsies of ten EoE patients, colored by cell phenotype. (C) Dot plots of select marker genes for each cell phenotype, displaying average expression and frequency of expression for each gene. (D) UMAP projections of cells obtained from esophageal and duodenal biopsies, colored by tissue and patient diagnosis. (E) Bar plots depicting relative frequencies of cell phenotypes from the esophageal and duodenal biopsies of each patient.
Figure 2.
Figure 2.. Eosinophils are enriched and activated in the esophagus during active disease.
(A) UMAP projection of granulocyte cluster colored by tissue and disease status (n = 679 cells). (B) UMAP projection of granulocyte cluster, colored by type of granulocyte. (C) Dot plots of select surface markers and inflammatory effectors expressed by eosinophils and neutrophils, displaying average expression and frequency of expression for each gene. (D) Fraction of cells in single-cell data that were classified as eosinophils from esophageal or duodenal biopsies of patients in disease or remission. P-values were computed using a two-sided Wilcoxon rank-sum test (*P < 0.05). (E) Correlation between number of eosinophils per high power field in esophagus tissue determined with histological staining and fraction of eosinophils in esophagus single-cell data. Spearman’s correlation coefficient and the associated p-value are shown. (F) Pathways upregulated in eosinophils present in the esophageal tissue of patients with active disease relative to eosinophils in the duodenum. P-values are calculated with a two-sided Wilcoxon rank-sum test and are adjusted with Bonferroni correction. (G) Transcription factor module scores produced by SCENIC for modules regulated by subunits of NF-κB.
Figure 3.
Figure 3.. T cell phenotypes present in the esophagus and duodenum.
(A) UMAP projection of T cells recovered from esophagus biopsies, colored by phenotypic cluster (n = 4,423 cells). (B) UMAP projection of T cells recovered from duodenum biopsies, colored by phenotypic cluster (n = 4,781 cells). (C) Dot plot of select genes in tissue-resident T cell clusters, displaying scaled expression and frequency of expression for each gene. (D) Dot plot of select homing markers in esophagus and duodenum T cell clusters. (E) Dot plot of CCL25 and C100orf99, the ligands for CCR9 and GPR15, in tissue-resident cell phenotypes. (F) Immunohistochemical staining for GPR15 and GPR15L in the esophageal biopsies of EoE patients. Scale bar: 200 μm. Results representative of n=3 patients. (G) GPR15 expression on memory CD4+ T cells isolated from esophageal biopsies of EoE patients, as measured by flow cytometry. Results representative of n=3 experiments. (H) Fraction of memory CD4+ T cells expressing from esophageal biopsies expressing GPR15+.
Figure 4.
Figure 4.. Properties of peTH2 cells in the esophagus of patients with EoE.
(A) Relative size of each esophagus T cell cluster by patient and diagnosis. P-value was computed using a two-sided Wilcoxon rank-sum test (*P < 0.05). (B) Correlation between fraction of T cells in cluster E6 and number of eosinophils per high-power field (hpf). Spearman’s correlation coefficient and the associated p-value are shown. (C) Dot plot showing the expression of genes associated with prostaglandin synthesis or lipid metabolism in each esophagus T cell cluster. (D) Ligand-receptor pathway analysis presenting the expression of receptors and ligands in pathways determined to be selectively upregulated between eosinophils and peTH2 cells. All pathways shown are determined to be statistically significant (Methods).
Figure 5.
Figure 5.. Clonotypic relationships of T cells in the esophagus and duodenum.
(A) UMAP projection of phenotypes present among esophageal T cells and (B) duodenal T cells. (C) Clonal size of esophageal T cells and (D) duodenal T cells mapped onto corresponding UMAP projections. Clonal size is defined as the number of cells from a given patient that share a given TRB sequence. (E) Stacked bar plot of clonal size of each phenotype. (F) Bar plot of clonal size of peTH2 cells in each patient.
Figure 6.
Figure 6.. Comparisons between peripheral and esophagus-resident peTH2 phenotypes.
(A) Representative staining of CRTH2 and CD161 from peripheral blood of EoE patients in disease or remission. (B) Percentage of CRTH2+CD161+ and CRTH2+CD161- among memory CD4+CD45RA- T cells, as determined by flow cytometry. P-values are calculated using a one-sided Wilcoxon rank-sum test (*P < 0.05). (C) UMAP projection of sorted CRTH2-CD161-, CRTH2+CD161-, and CRTH2+CD161+ cells, colored by sort fraction (n = 30,635 cells; 8 patients). (D) UMAP projection of sorted cells colored by phenotypic cluster. (E) Distribution of phenotypic clusters within each sort fraction. (F) Dot plot of peTH2-associated genes in T cells from peripheral blood CD4+ T cells and cluster E6 from esophageal biopsies.
Figure 7.
Figure 7.. TCR repertoire of peripheral convTH2 and peTH2 cells.
(A) Clonal size, calculated using TCRβ, overlaid on UMAP plot. (B) Distribution of clonal size among non-TH2, convTH2, and peTH2 phenotypes. (C) Distribution of non-TH2, convTH2, and peTH2 phenotypes within expanded clonotypes. Up to the seven most expanded clonotypes recovered from each patient are displayed, provided they consist of greater than 3 cells. Heatmap is colored according to fraction of cells in that clonotype with a given phenotype. (D) Shannon diversity of non-TH2, convTH2, and peTH2 cells. Samples with fewer than 10 TCRβ sequences recovered are excluded. P-values are calculated using a two-sided Wilcoxon rank-sum test (**P < 0.01). (E) Distribution of nearest-neighbor Hamming distance between CDR3 sequences in each phenotype. P-values are calculated using a two-sided chi-squared proportion test (***P < 0.001, ****P < 0.0001). (F) Fraction of TCRβ sequences in each phenotype that are related to another TCRβ sequence from the same patient by GLIPH2. Samples with fewer than 10 TCRβ sequences recovered are excluded. P-values are calculated by a one-sided Wilcoxon rank-sum test (*P < 0.05). (G) peTH2 clonotypes shared between the peripheral blood and the esophagus. Heatmap presents the distribution of phenotypes present in peripheral blood for each clonotype. Sequences highlighted in bold were shared between the esophagus and peripheral blood; other sequences are paired with these sequences in either location. (H) Genes upregulated by clonotypes detected in esophagus tissue relative to all other peripheral peTH2 cells. P-values are calculated using a two-sided Wilcoxon rank-sum test and are adjusted with Bonferroni correction. (I) Representative staining of CD154+ and CD154- memory CD4+ cells from patients with milk-triggered disease. (J) Frequency of CRTH2+CD161+ cells on CD154+ and CD154- cells after culture with milk antigen. P-values were calculated using a paired two-sided Wilcoxon rank-sum test (**P < 0.01) (K) Frequency of GPR15 expression on memory T cell subsets after culture with milk antigen. P-values were calculated using a paired two-sided Wilcoxon rank-sum test (*P < 0.05, **P < 0.01).

Comment in

Similar articles

Cited by

References

    1. Furuta GT, Katzka DA, Eosinophilic esophagitis. N. Engl. J. Med. 373, 1640–1648 (2015). - PMC - PubMed
    1. Davis BP, Rothenberg ME, Mechanisms of disease of eosinophilic esophagitis. Annu. Rev. Pathol. Mech. Dis. 11, 365–93 (2016). - PMC - PubMed
    1. Gonsalves N, Yang GY, Doerfler B, Ritz S, Ditto AM, Hirano I, Elimination diet effectively treats eosinophilic esophagitis in adults; Food reintroduction identifies causative factors. Gastroenterology. 142, 1451–1459.e1 (2012). - PubMed
    1. Davis BP, Rothenberg ME, Mechanisms of Disease of Eosinophilic Esophagitis. Annu. Rev. Pathol. 11, 365–93 (2016). - PMC - PubMed
    1. Hill DA, Spergel JM, The immunologic mechanisms of eosinophilic esophagitis. Curr. Allergy Asthma Rep. 16, 1–15 (2016). - PMC - PubMed

Publication types

MeSH terms