. 2021 Sep 1;207(5):1478-1492.
doi: 10.4049/jimmunol.2100172. Epub 2021 Aug 13.

Continuous Culture of Mouse Primary B Lymphocytes by Forced Expression of Bach2

Affiliations

Continuous Culture of Mouse Primary B Lymphocytes by Forced Expression of Bach2

Joel Finney et al. J Immunol. .

Abstract

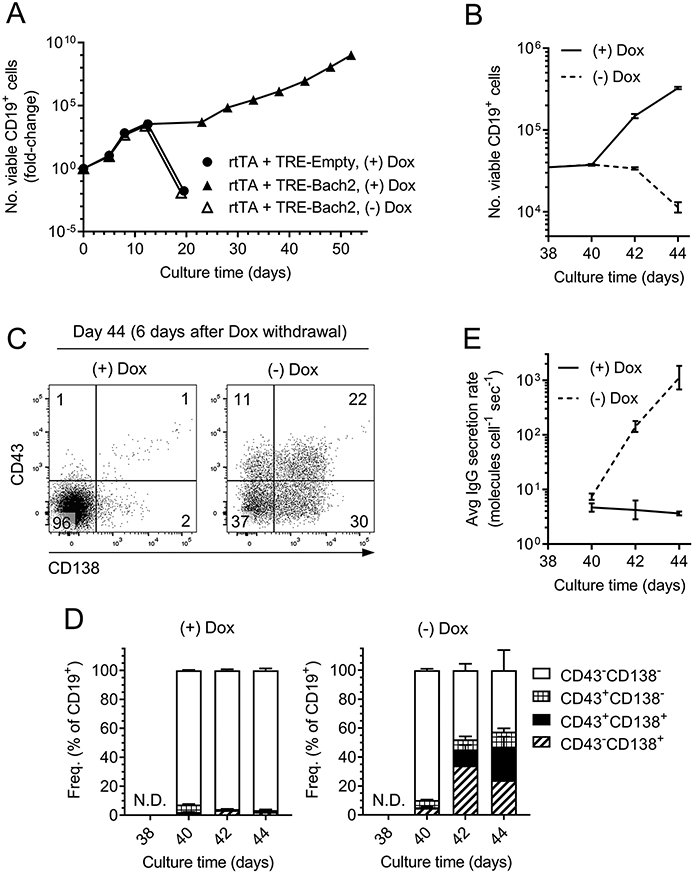
Stable, long-term culture of primary B lymphocytes has many potential scientific and medical applications, but remains an elusive feat. A major obstacle to long-term culture is that in vitro mitogens quickly drive B cells to differentiate into short-lived plasma cells (PCs). PC differentiation is governed by opposing teams of transcription factors: Pax5, Bach2, and Bcl6 suppress PC commitment, whereas IFN regulatory factor 4 and Blimp1 promote it. To determine whether transcriptional programming could prolong B cell culture by blocking PC commitment, we generated mouse primary B cells harboring gain- or loss-of-function in the key transcription factors, continuously stimulated these cells with CD154 and IL-21, and determined growth potential and phenotypes in vitro. We found that transgenic expression of Bach2 prohibits PC commitment and endows B cells with extraordinary growth potential in response to external proliferation and survival cues. Long-term Bach2-transgenic B cell lines have genetically stable BCRs [i.e., do not acquire V(D)J mutations], express high levels of MHC class II and molecules for costimulation of T cells, and transduce intracellular signals when incubated with BCR ligands. Silencing the Bach2 transgene in an established transgenic cell line causes the cells to secrete large quantities of Ig. This system has potential applications in mAb production, BCR signaling studies, Ag presentation to T cells, and ex vivo clonal expansion for adoptive cell transfer. Additionally, our results provide insight into molecular control over activated B cell fate and suggest that forced Bach2 expression in vivo may augment germinal center B cell or memory B cell differentiation at the expense of PC commitment.


Figures

Fig. 1.
Fig. 1.. Kinetics of wildtype B-cell clonal expansion, CSR, and PC differentiation in 40LB culture.
B6 splenic B cells co-cultured with 40LB feeder cells and IL-4 and IL-21 were periodically analyzed by flow cytometry, while culture supernatants were analyzed by ELISA. A, Growth kinetics of cultured B cells. B, Expression of key transcription factors (TFs) in cultured B cells and control B cells. Ex vivo B6 splenocytes were the positive control for Pax5 and Bach2 staining, ex vivo B6 Peyer’s patch GC B cells were the positive control for Bcl6 staining, and cultured J558L plasmacytoma cells were the positive control for IRF4 and Blimp1 staining. C and D, Dynamics of transcription factor expression in cultured B cells, normalized to control cells (as shown in B). E, Frequency of B cells expressing surface IgG1. F, Aggregate data for IgG1-CSR (gated as in E) at all time points. G, Frequencies of B cells expressing the PC markers CD43 or CD138 at various time points during 40LB culture. H, Aggregate data for expression of CD43 and CD138 (gated as in G) at all time points. I, The average rate of IgG and IgM secretion by 40LB-cultured B cells at various time points. GeoMFI, geometric mean fluorescence intensity. LOD, limit of detection. Flow cytometry analyses were pre-gated on viable H2-Kd−CD19+ cells (B-H). Error bars depict geometric mean ± 95% CI (A, I) or arithmetic mean ± 95% CI (C, D, F, H) of three replicates. Data are representative of one (B, C, D, I) or ≥3 independent experiments (A, E, F, G, H) with similar results.
Fig. 2.
Fig. 2.. IRF4-deficiency profoundly impairs both PC differentiation and B-cell clonal expansion.
Irf4+/+, Irf4+/−, and Irf4−/− splenic B cells were cultured and analyzed as in Fig. 1. A, Growth kinetics of cultured B cells. B, Flow cytometry plots showing expression of surface IgG1 vs. surface IgM (top) or CD43 vs. CD138 (middle) or B220 expression (bottom). C, Aggregate data for CSR (gated as in B) at culture day 7. D, Aggregate data for expression of PC markers (gated as in B) at culture days 4, 7, and 11. E, Aggregate data for expression of B220 (gated as in B) at culture day 7. F, The average rate of IgG secretion by 40LB-cultured B cells at various time points. GeoMFI, geometric mean fluorescence intensity. N.D., not detected. Flow cytometry analyses were pre-gated on viable H2-Kd−CD19+ cells (B-E). Error bars depict geometric mean ± 95% CI (A, F) or arithmetic mean ± 95% CI (C, D) of two replicates. Horizontal lines (E) depict geometric means. P values were determined by one- (E) or two-way (A, F) ANOVA, followed by Tukey’s test. *, P < 0.05; ****, P < 0.0001. Data are representative of three independent experiments with similar results.
Fig. 3.
Fig. 3.. Blimp1-deficiency fails to sustain B-cell clonal expansion, despite blocking PC differentiation.
Prdm1+/+, Prdm1+/−, and Prdm1−/− splenic B cells were cultured and analyzed as in Fig. 1. A, Growth kinetics of cultured B cells. B, Flow cytometry plots showing expression of surface IgG1 vs. surface IgM at culture days 2 and 5. C, Aggregate data for CSR (gated as in B). D, Flow cytometry plots showing expression of CD43 and CD138 at culture days 5 and 9. E, Aggregate data for expression of PC markers (gated as in D). F, The average rate of IgG secretion by 40LB-cultured B cells at culture days 5 and 9. N.D., not detected. Flow cytometry analyses were pre-gated on viable H2-Kd−CD19+ cells (B-E). Error bars depict geometric mean ± 95% CI (A), arithmetic mean ± 95% CI (C), arithmetic mean ± S.E.M. (E) of 2-4 replicates. Horizontal lines (F) depict geometric means. P values were determined by 2-way ANOVA, followed by Tukey’s test. ****, P < 0.0001. Data are representative of two independent experiments with similar results.
Fig. 4.
Fig. 4.. Forced expression of Bcl6 or Bach2 prevents PC differentiation and enables long-term B-cell culture.
Splenic B1-8 HC KI B cells were transduced with retrovirus expressing Pax5-, Bcl6-, Bach2-IRES-hCD8a or empty IRES-hCD8a and then cultured on 40LB cells with exogenous IL-21. B cells were periodically enumerated, analyzed by flow cytometry, and transferred to fresh feeder cells for continued culture. A, Growth kinetics of cultured B cells. B, Flow cytometry plots showing expression of CD43 and CD138 on B cells at culture day 11. C, Kinetics of CD43 expression (gated as in B) among transduced (hCD8α+) B cells. D, Kinetics of CD138 expression (gated as in B) among transduced (hCD8α+) B cells. E, The average rate of IgG secretion by 40LB-cultured B cells at various time points. F, Growth kinetics for Bach2-transgenic B cell clone B1-8i.4 before (solid circles) and after (hollow circles) cryopreservation and thawing. Flow cytometry analyses were pre-gated on viable H2-Kd−CD19+ cells (B-D). Error bars depict geometric mean ± 95% CI (A) or arithmetic mean ± 95% CI (C, D) of two replicates. Data concerning Pax5 and Bcl6 transgenes represent one experiment; data concerning empty and Bach2 transgenes are representative of ≥6 independent experiments with similar results.
Fig. 5.
Fig. 5.. 40LB-cultured Bach2-transgenic B cell lines have an activated B-cell phenotype.
Splenic B cells were stimulated for 2, 3, or 4 days with anti-CD40 and IL-4 before transduction with Bach2-expressing retrovirus. After an additional 30 days of culture, the established cell lines were analyzed by flow cytometry and ELISA. Ten independent lines were established for each activation condition. Each cell line is named as X.Y, where X represents the length (in days) of activation prior to transduction, and Y identifies the independent cell line within that cohort. A, Flow cytometry histograms showing expression of cell-surface markers on representative Bach2-transgenic cell lines and freshly isolated Peyer’s patch CD19+CD38hiGL7 quiescent B cells or CD19+CD38loGL7+ GC B cells. B-D, Geometric MFI of CD19 (B), GL7 (C), or CD95 (D) expression on Bach2-transgenic cell lines. E, Frequency of CD38lo cells (gated according to the dashed vertical line in A) within each cell line. F-H, Geometric MFI of MHCII (F), CD80 (G), or CD86 (H) expression on the cell lines. I, Flow cytometry histograms showing expression of B220 and cell-surface IgG1 on representative Bach2-transgenic cell lines or splenic CD19 non-B or CD19+ B cells. J,K, Frequencies of B220hi (J) or surface IgG1+ (K) cells in each cell line, gated according to the dashed vertical lines in I. L,M, Flow cytometry scatter plots showing surface immunoglobulin expression on representative Bach2-transgenic cell lines. N,O, Frequencies of IgG2b+ (N) or IgE+ (O) cells within each cell line. P, ELISA results showing the quantity of each Ig isotype in the culture supernatants of Bach2-transgenic cell lines. The left panel shows Igκ-containing Igs; the right panel shows Igλ. Flow cytometry analyses were pre-gated on viable CD19+ cells unless otherwise noted. Each symbol in B-H, J, K, and N-P represents an individual cell line. Solid and dashed long, horizontal lines in B-D and F-H respectively represent the geoMFI values for GC B cells or quiescent B cells, as depicted in A. Short horizontal lines (B-H, J, K, N, O) denote the median values.
Fig. 6.
Fig. 6.. Cognate Ag binding by 2F5 KI and B1-8 HC KI cell lines.
Bach2-transgenic cell lines were established from 2F5 KI or Igλ+Igκ B1-8i HC KI B cells. These cell lines were incubated with NP-conjugated PE (A) or PE-labeled tetramers (B) of peptides containing the 2F5 epitope (ELDKWA) or a mutated epitope (ELAKWA). Ag binding was measured by flow cytometry. Analyses were pre-gated on CD19+H2-Kd− cells.
Fig. 7.
Fig. 7.. Bach2-transgenic B cell lines quantitatively transduce intracellular signals in response to BCR ligands.
A-D, 016.4 cells were stimulated with anti-IgG and the kinetics of calcium mobilization (A) or ERK1/2 phosphorylation (B-D) were determined. B shows the intensity of phospho-ERK1/2 staining after two minutes of stimulation. E, 2F5.1 and 016.4 cells were stimulated with anti-IgG and the kinetics of calcium mobilization were determined. F, Flow cytometry analysis of surface IgG1 and surface Igκ expression on 2F5.1 and 016.4 cells at the time the experiment depicted in E. G-H, B1-8.4 cells were stimulated with NP2-BSA (G) or NP10-BSA (H) and the kinetics of calcium mobilization were determined.
Fig. 8.
Fig. 8.. Deactivation of the Bach2 transgene in established cell lines results in rapid PC differentiation.
B6 splenic B cells were transduced with retrovirus encoding rtTA and a TRE-controlled Bach2 transgene. Transduced cells were cultured with 40LB feeder cells, and doxycycline (Dox) was added to some cultures to activate the Bach2 transgene. A, Growth kinetics of cultured B cells. B-E, The cell line expressing the doxycycline-inducible Bach2 transgene (solid triangles in A) was split at culture day 38 and cultured in parallel with (+) or without (−) Dox for 6 additional days. B, Growth kinetics. C, Flow cytometric analysis of PC marker expression. D, Kinetics of PC marker expression, gated as in C. E, Average rate of IgG secretion.

References

    1. Nojima T, Haniuda K, Moutai T, Matsudaira M, Mizokawa S, Shiratori I, Azuma T, and Kitamura D. 2011. In-vitro derived germinal centre B cells differentially generate memory B or plasma cells in vivo. Nat Commun 2: 465. - PubMed
    1. Quintans J, and Lefkovits I. 1974. Clonal expansion of lipopolysaccharide-stimulated B lymphocytes. J Immunol 113: 1373–1376. - PubMed
    1. Su KY, Watanabe A, Yeh CH, Kelsoe G, and Kuraoka M. 2016. Efficient Culture of Human Naive and Memory B Cells for Use as APCs. J Immunol 197: 4163–4176. - PMC - PubMed
    1. Weaver GC, Villar RF, Kanekiyo M, Nabel GJ, Mascola JR, and Lingwood D. 2016. In vitro reconstitution of B cell receptor-antigen interactions to evaluate potential vaccine candidates. Nat Protoc 11: 193–213. - PMC - PubMed
    1. Lindner JM, Cornacchione V, Sathe A, Be C, Srinivas H, Riquet E, Leber XC, Hein A, Wrobel MB, Scharenberg M, Pietzonka T, Wiesmann C, Abend J, and Traggiai E. 2019. Human Memory B Cells Harbor Diverse Cross-Neutralizing Antibodies against BK and JC Polyomaviruses. Immunity 50: 668–676 e665. - PubMed

Publication types

MeSH terms

Substances