

Th22 Cells Are a Major Contributor to the Mycobacterial CD4+ T Cell Response and Are Depleted During HIV Infection
- PMID: 34389623
- PMCID: PMC8387408
- DOI: 10.4049/jimmunol.1900984
Th22 Cells Are a Major Contributor to the Mycobacterial CD4+ T Cell Response and Are Depleted During HIV Infection
Abstract
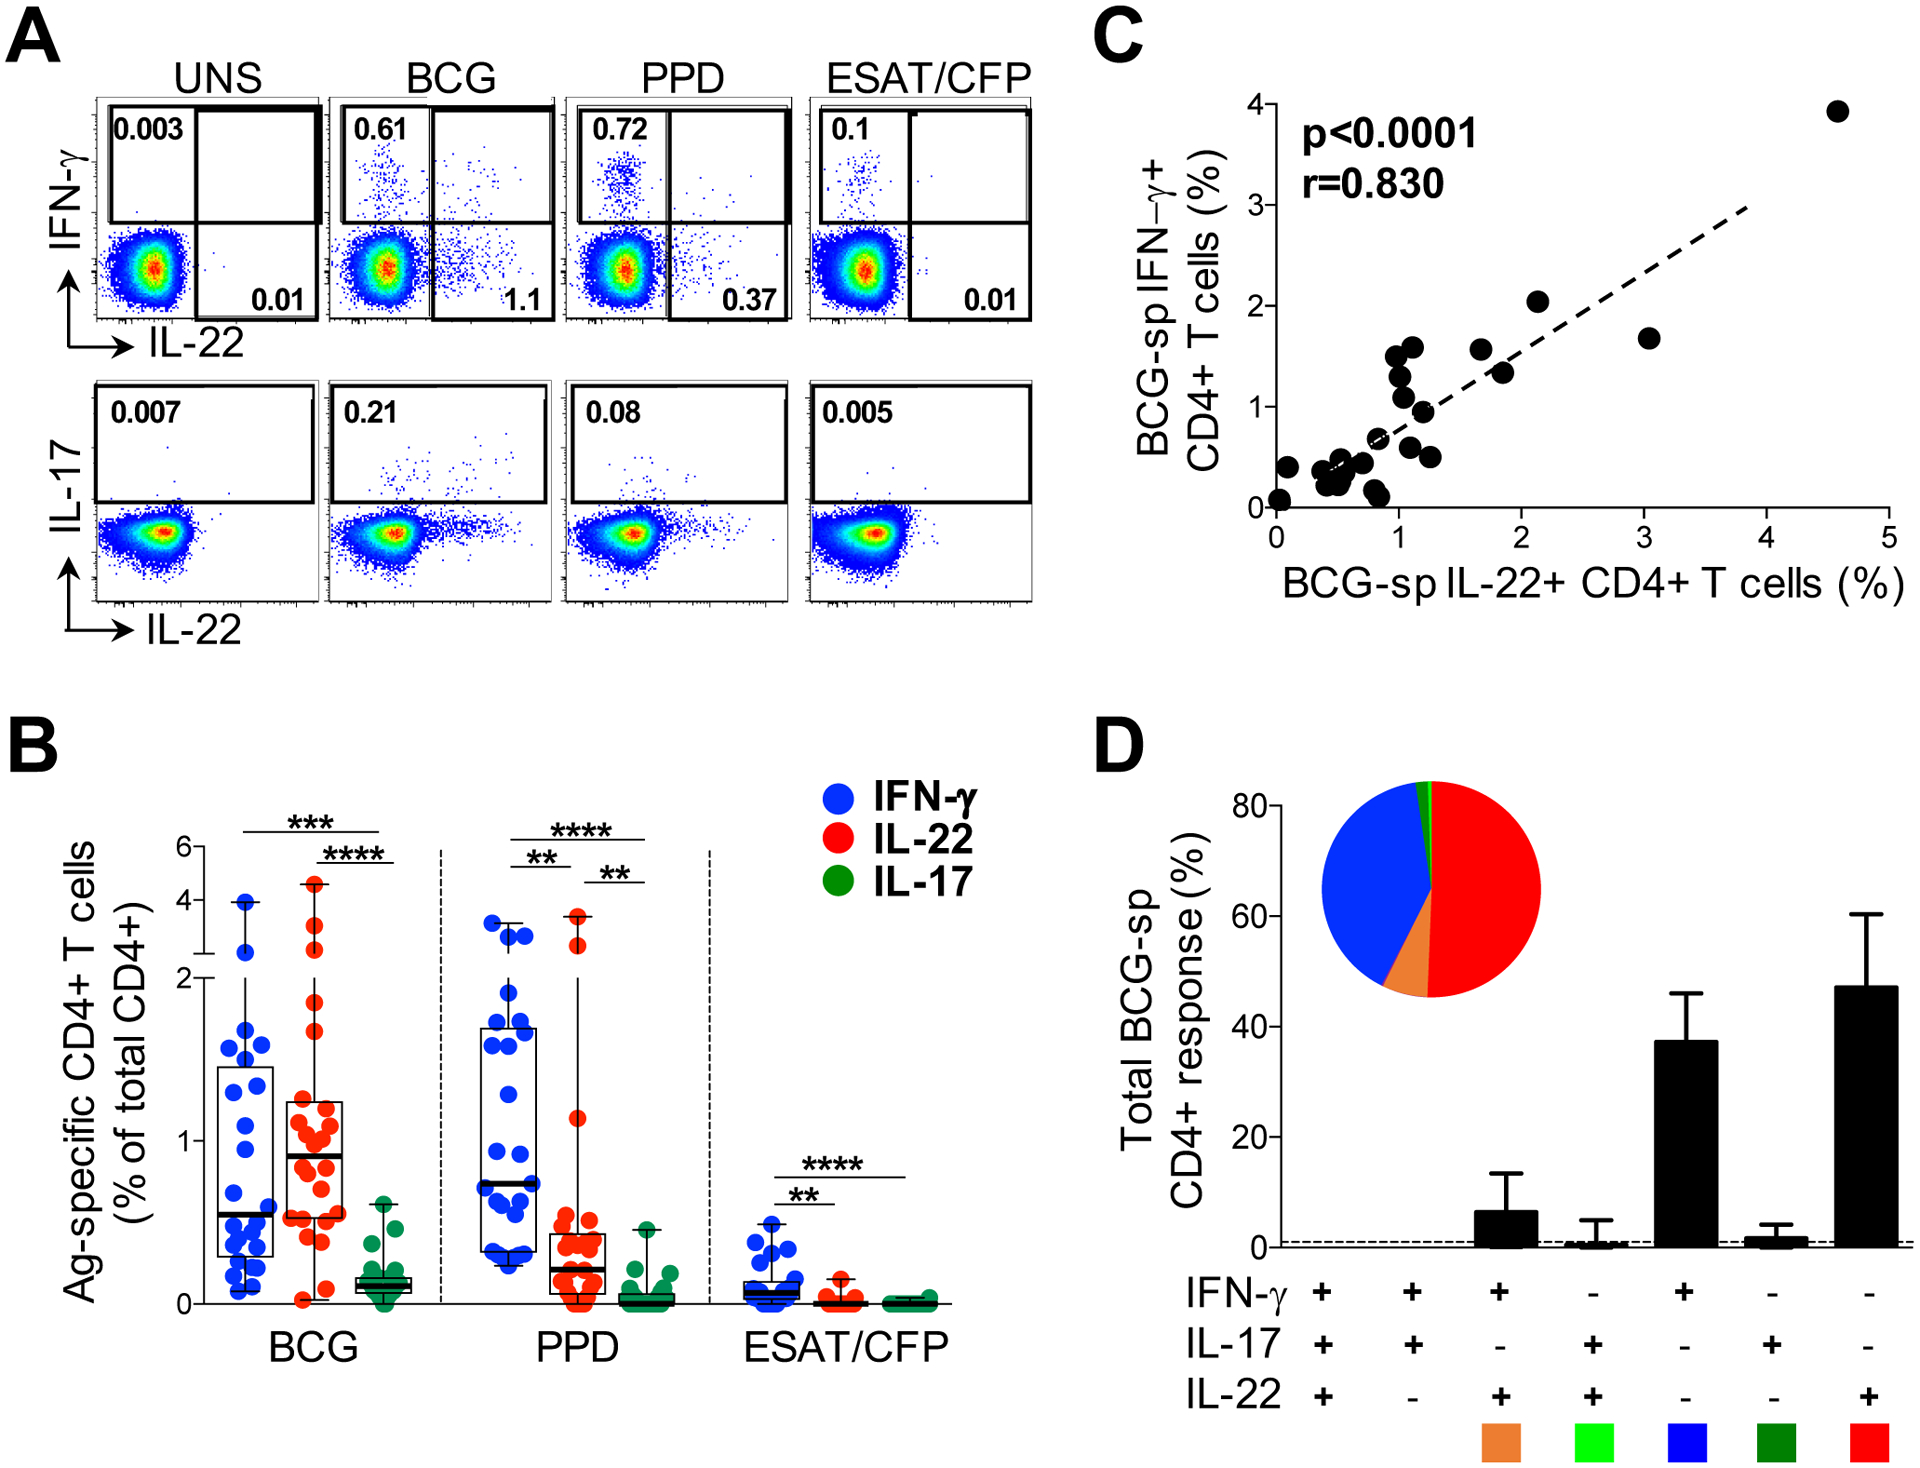
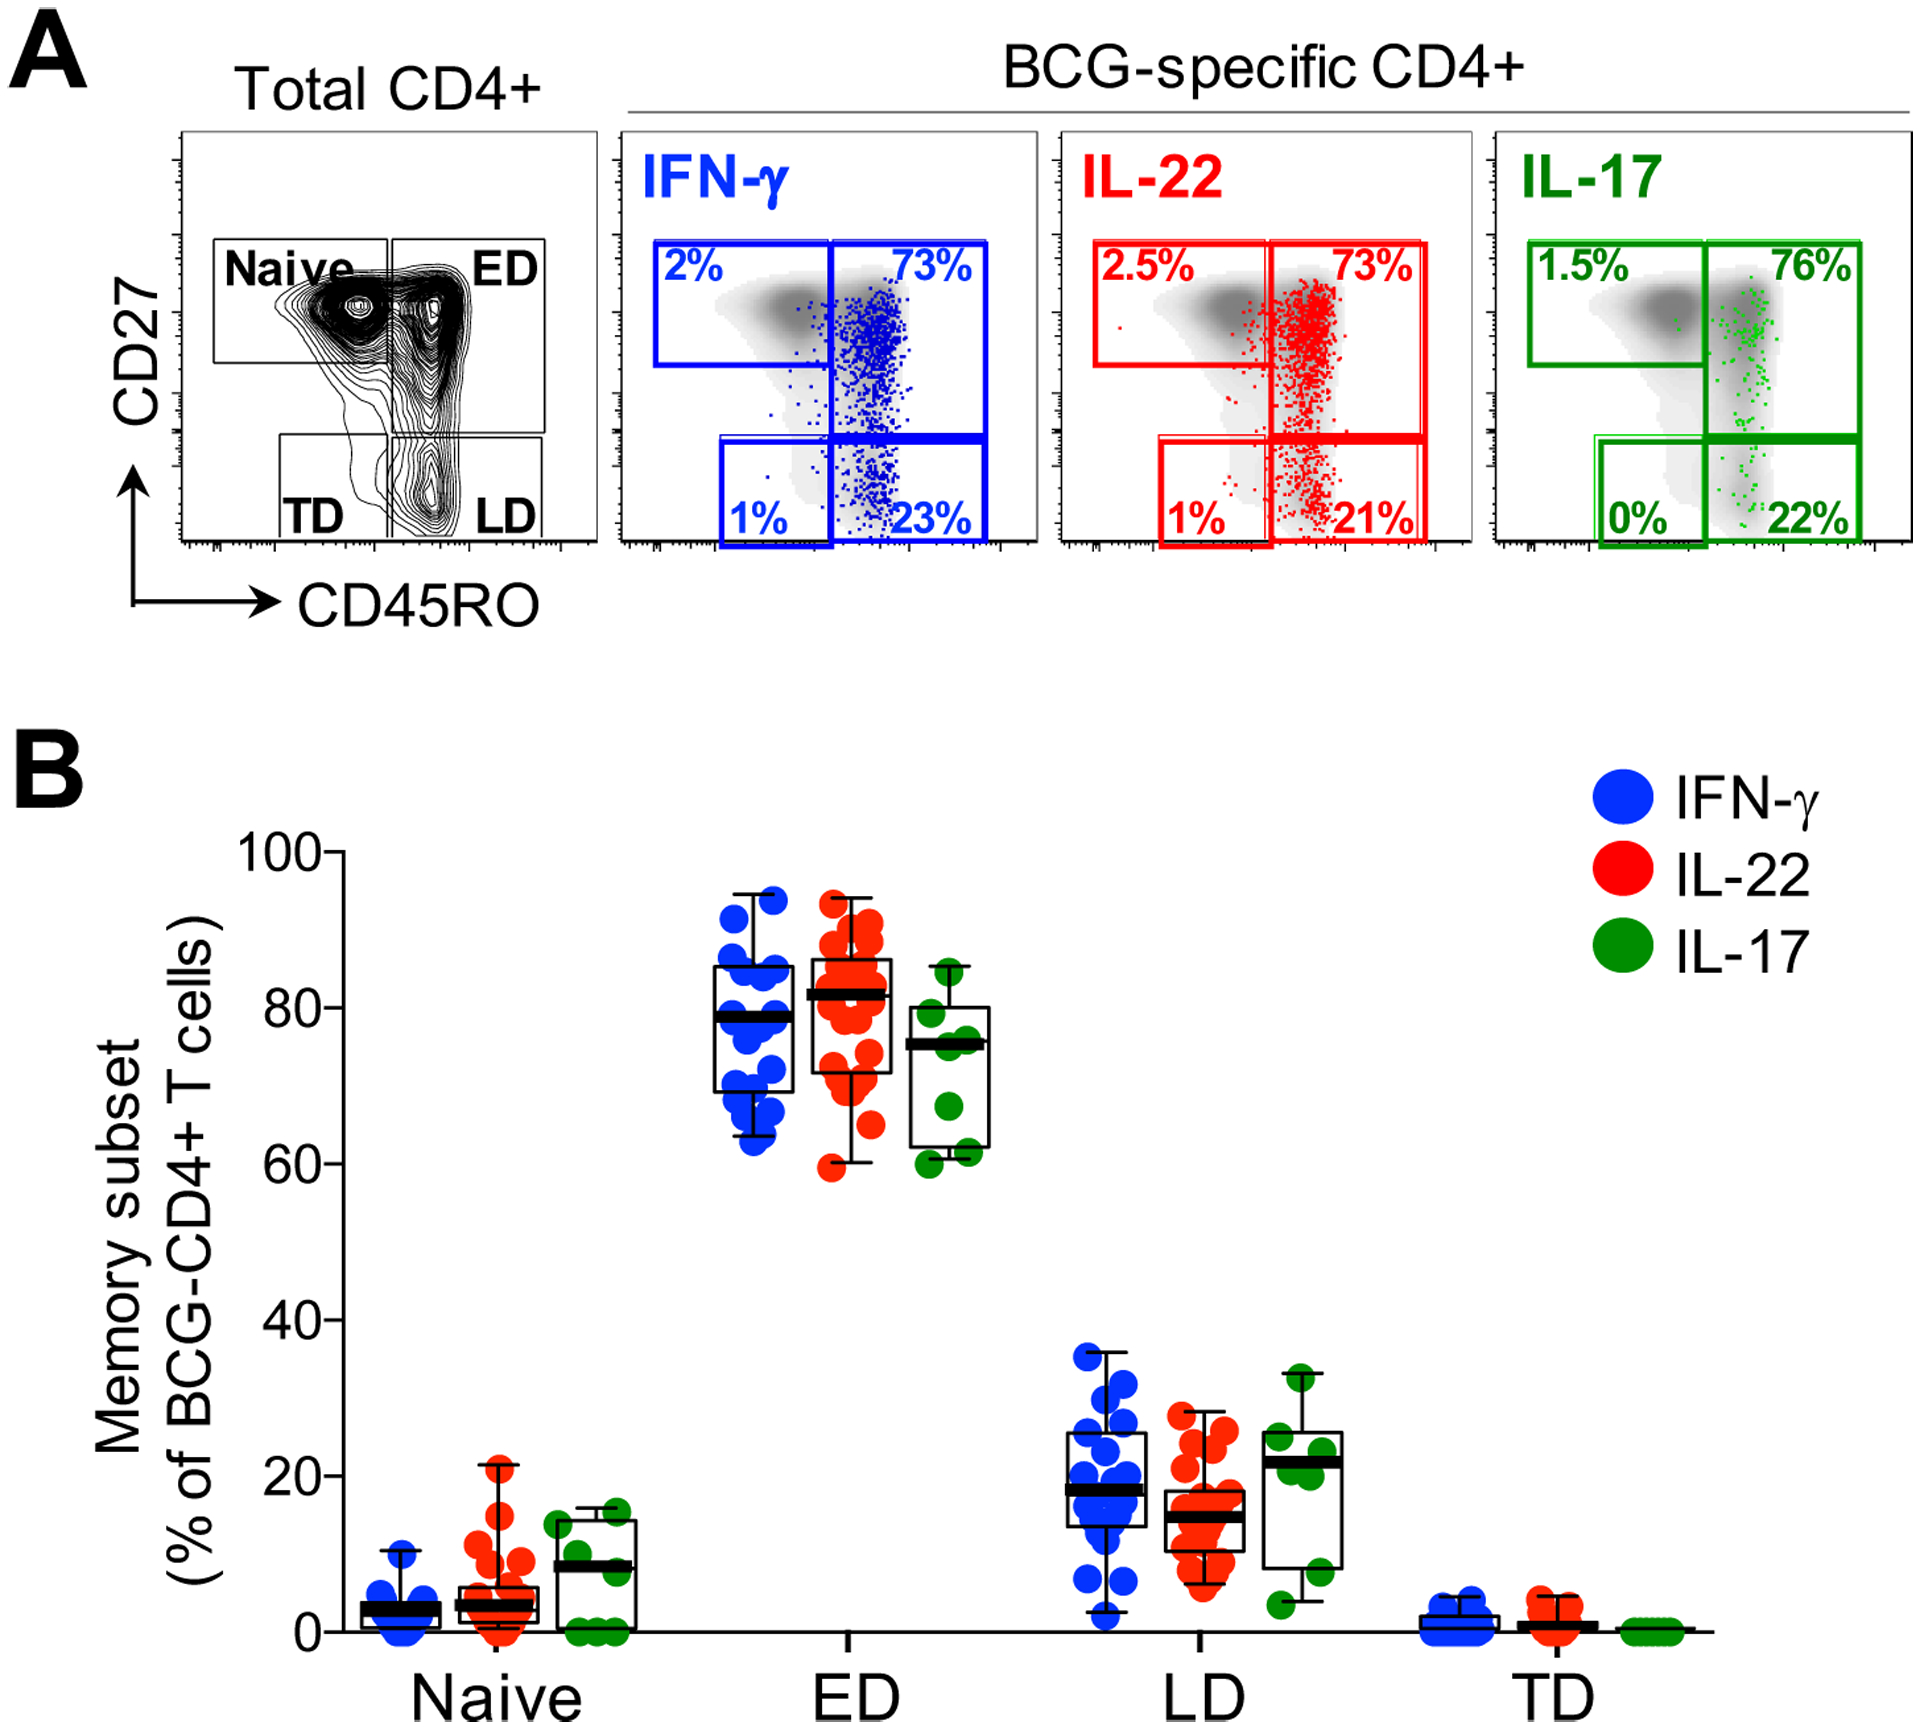
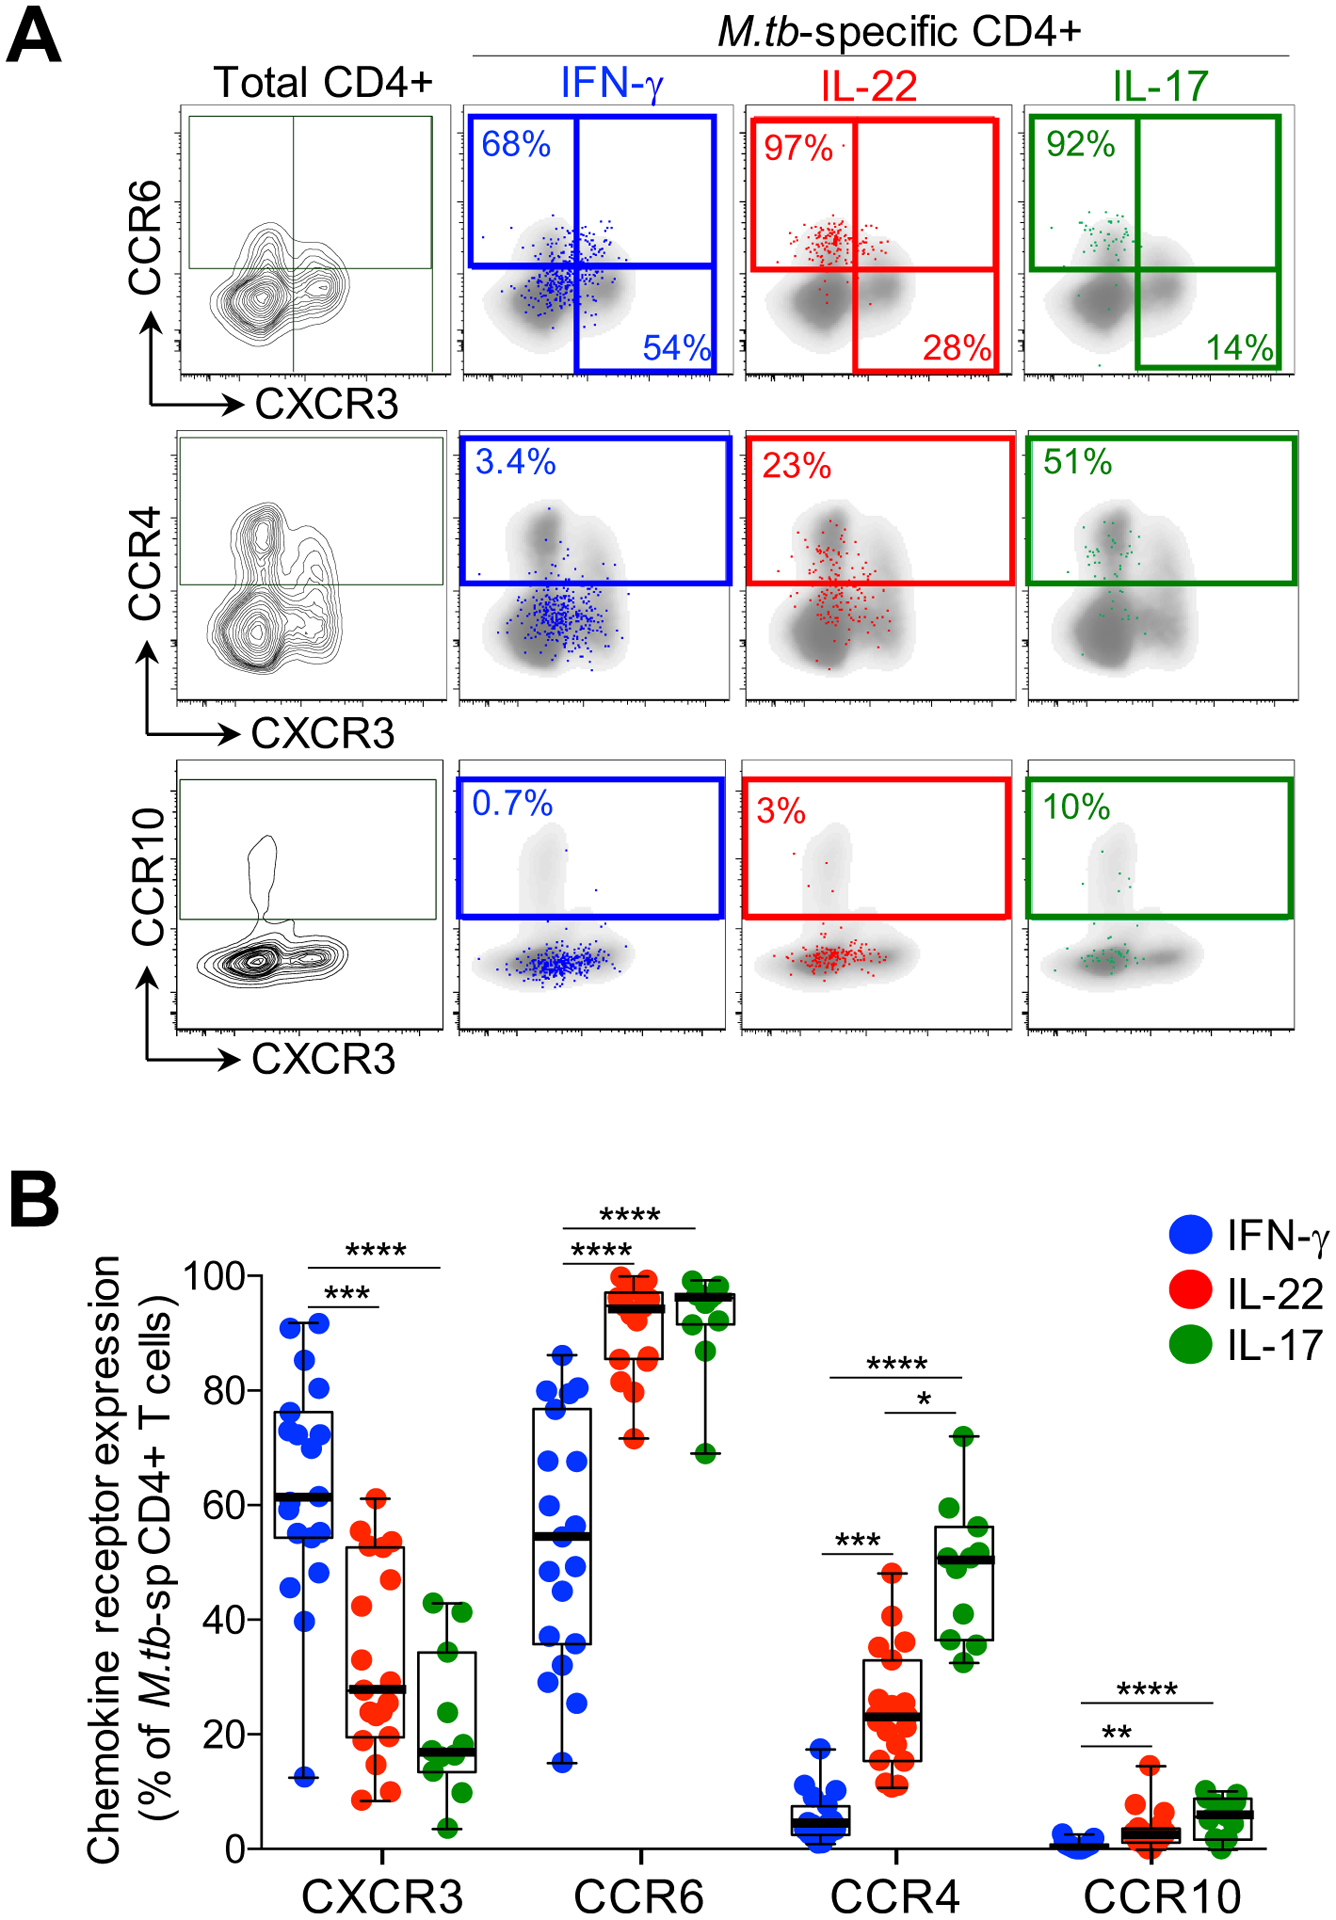
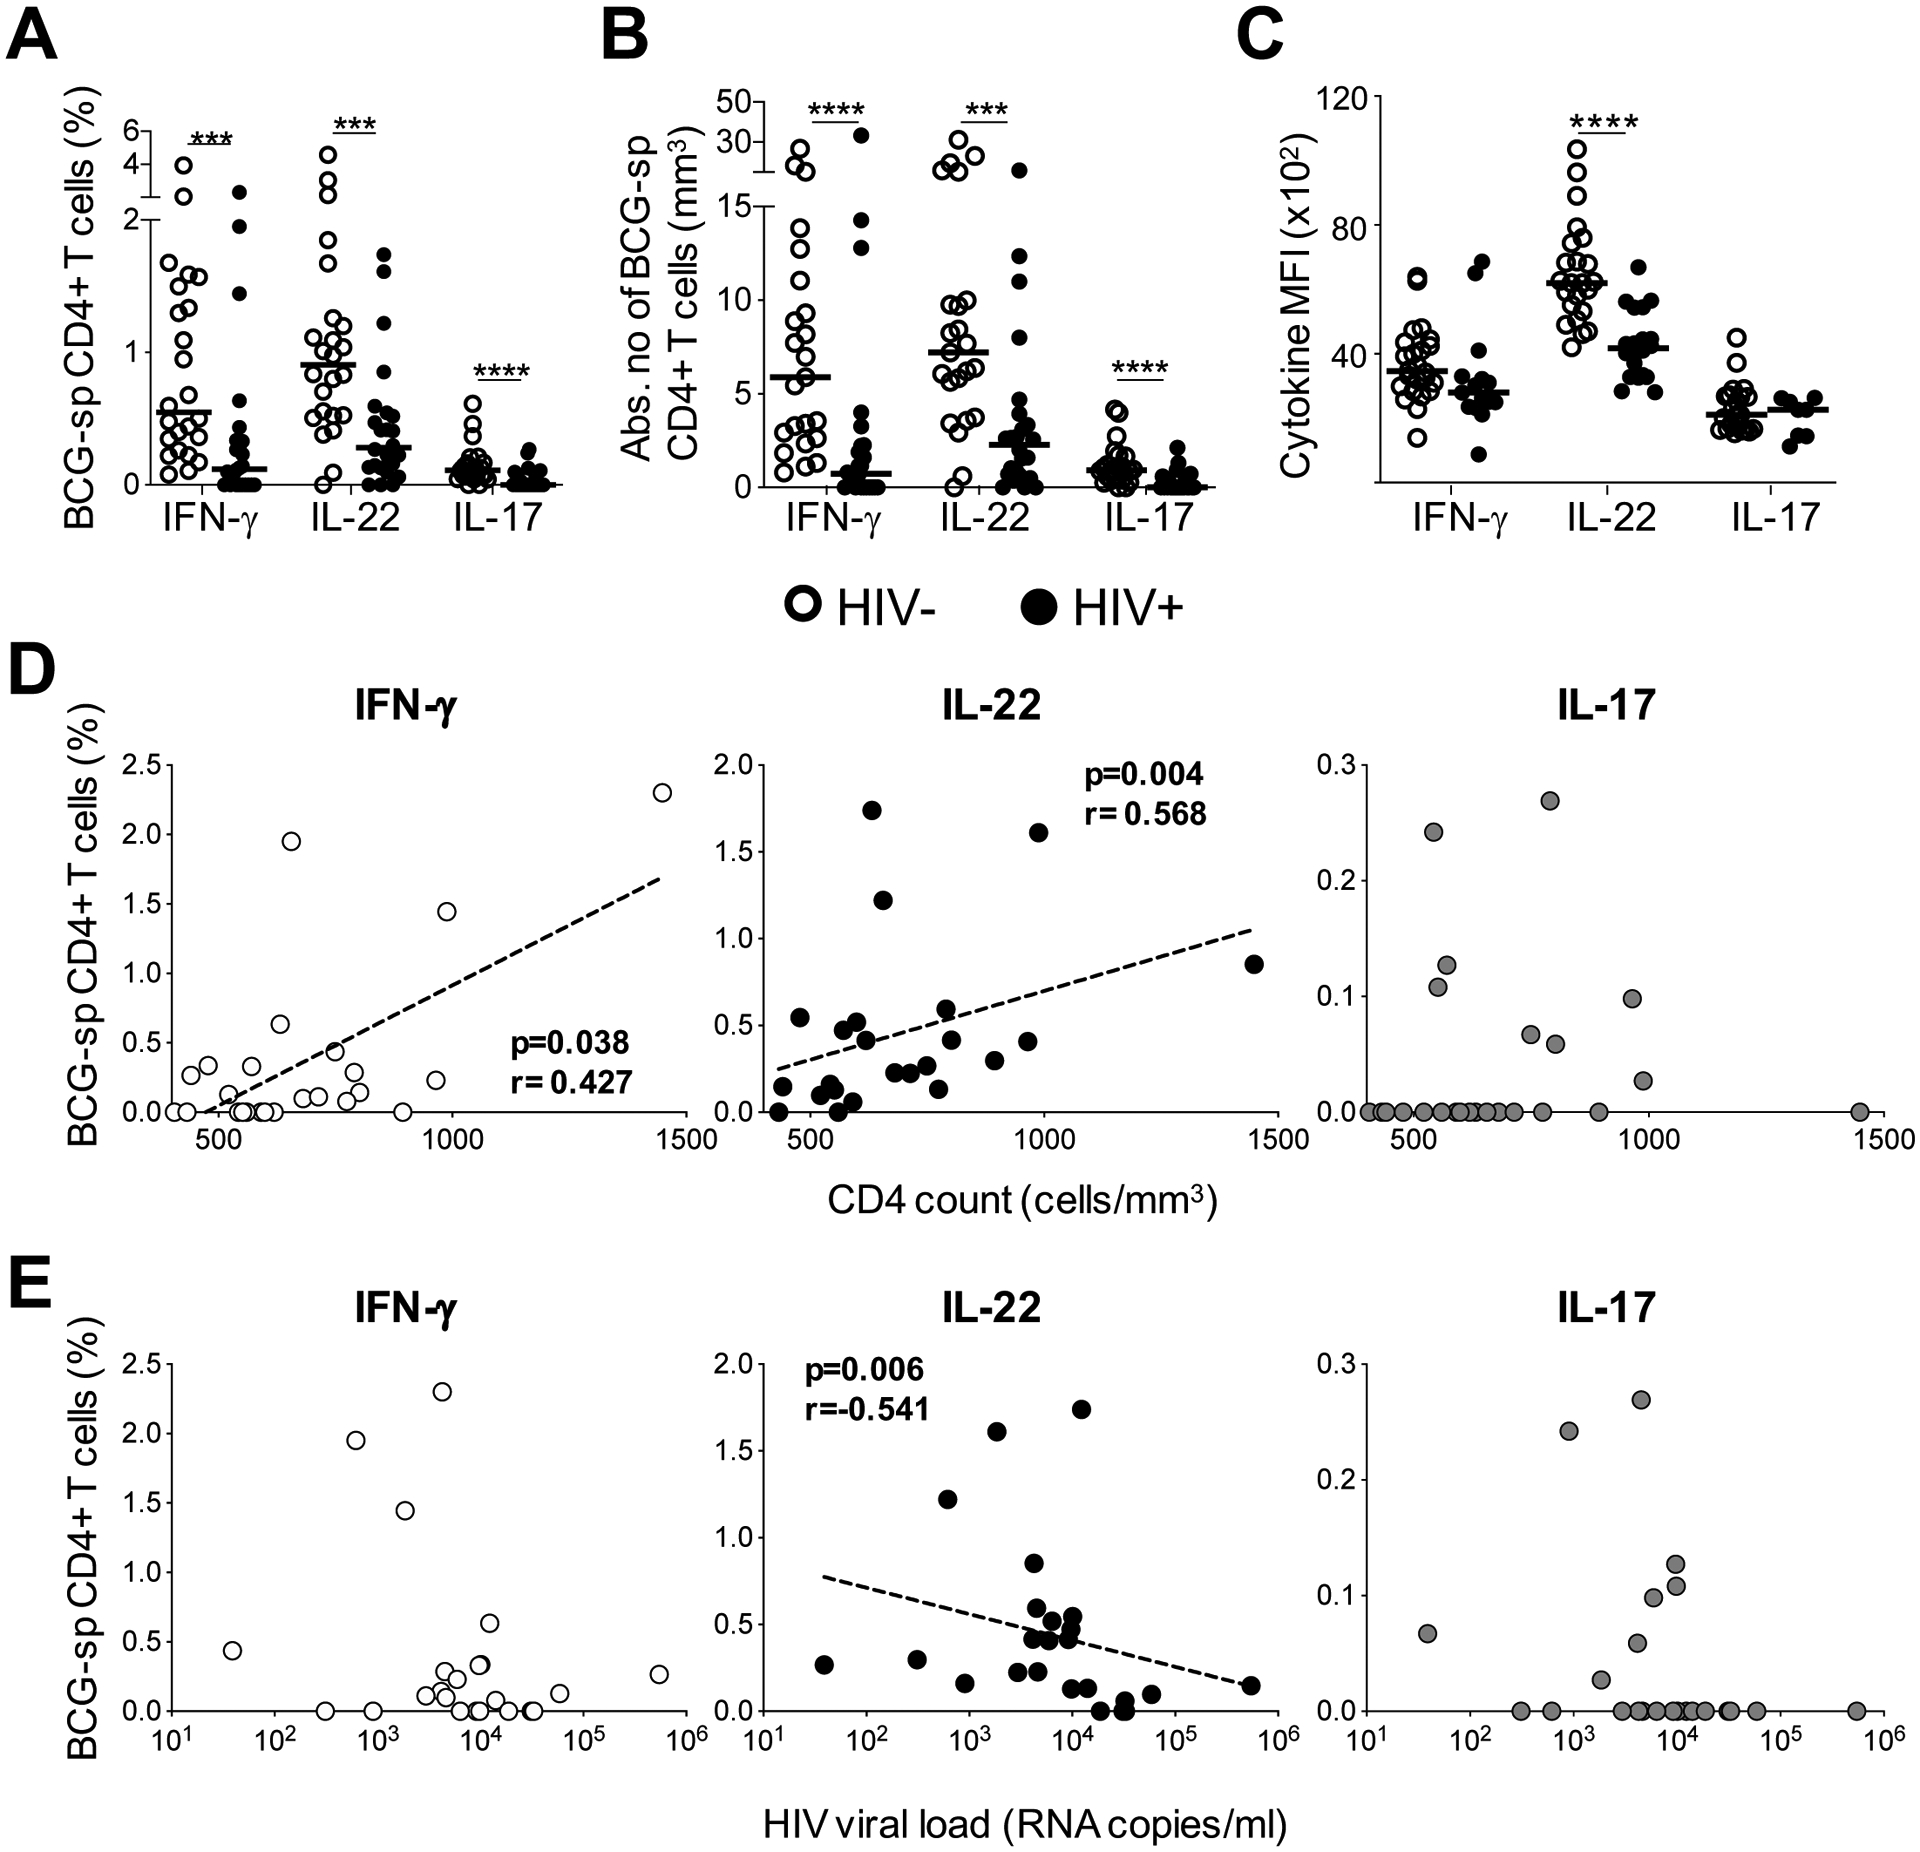
HIV-1 infection substantially increases the risk of developing tuberculosis (TB). Mechanisms such as defects in the Th1 response to Mycobacterium tuberculosis in HIV-infected persons have been widely reported. However, Th1-independent mechanisms also contribute to protection against TB. To identify a broader spectrum of defects in TB immunity during HIV infection, we examined IL-17A and IL-22 production in response to mycobacterial Ags in peripheral blood of persons with latent TB infection and HIV coinfection. Upon stimulating with mycobacterial Ags, we observed a distinct CD4+ Th lineage producing IL-22 in the absence of IL-17A and IFN-γ. Mycobacteria-specific Th22 cells were present at high frequencies in blood and contributed up to 50% to the CD4+ T cell response to mycobacteria, comparable in magnitude to the IFN-γ Th1 response (median 0.91% and 0.55%, respectively). Phenotypic characterization of Th22 cells revealed that their memory differentiation was similar to M. tuberculosis-specific Th1 cells (i.e., predominantly early differentiated CD45RO+CD27+ phenotype). Moreover, CCR6 and CXCR3 expression profiles of Th22 cells were similar to Th17 cells, whereas their CCR4 and CCR10 expression patterns displayed an intermediate phenotype between Th1 and Th17 cells. Strikingly, mycobacterial IL-22 responses were 3-fold lower in HIV-infected persons compared with uninfected persons, and the magnitude of responses correlated inversely with HIV viral load. These data provide important insights into mycobacteria-specific Th subsets in humans and suggest a potential role for IL-22 in protection against TB during HIV infection. Further studies are needed to fully elucidate the role of IL-22 in protective TB immunity.
Copyright © 2021 by The American Association of Immunologists, Inc.
Conflict of interest statement
Figures
Similar articles
-
Characterization of Mycobacterium tuberculosis-Specific Th22 Cells and the Effect of Tuberculosis Disease and HIV Coinfection.J Immunol. 2022 Aug 1;209(3):446-455. doi: 10.4049/jimmunol.2200140. Epub 2022 Jul 1. J Immunol. 2022. PMID: 35777848 Free PMC article.
-
Enhanced IFN-γ, but not IL-2, response to Mycobacterium tuberculosis antigens in HIV/latent TB co-infected patients on long-term HAART.BMC Immunol. 2019 Oct 11;20(1):35. doi: 10.1186/s12865-019-0317-9. BMC Immunol. 2019. PMID: 31601184 Free PMC article.
-
HIV Skews the Lineage-Defining Transcriptional Profile of Mycobacterium tuberculosis-Specific CD4+ T Cells.J Immunol. 2016 Apr 1;196(7):3006-18. doi: 10.4049/jimmunol.1502094. Epub 2016 Feb 29. J Immunol. 2016. PMID: 26927799 Free PMC article.
-
HIV-TB co-infection: mechanisms that drive reactivation of Mycobacterium tuberculosis in HIV infection.Oral Dis. 2016 Apr;22 Suppl 1:53-60. doi: 10.1111/odi.12390. Oral Dis. 2016. PMID: 27109273 Review.
-
Th22 response induced by Mycobacterium tuberculosis strains is closely related to severity of pulmonary lesions and bacillary load in patients with multi-drug-resistant tuberculosis.Clin Exp Immunol. 2021 Feb;203(2):267-280. doi: 10.1111/cei.13544. Epub 2020 Nov 18. Clin Exp Immunol. 2021. PMID: 33128773 Free PMC article. Review.
Cited by
-
CD70-induced differentiation of proinflammatory Th1/17/22/GM lymphocytes associated with disease progression and immune reconstitution during HIV infection.Emerg Microbes Infect. 2023 Dec;12(2):2271068. doi: 10.1080/22221751.2023.2271068. Epub 2023 Oct 26. Emerg Microbes Infect. 2023. PMID: 37824079 Free PMC article.
-
Multidimensional analyses reveal modulation of adaptive and innate immune subsets by tuberculosis vaccines.Commun Biol. 2020 Oct 9;3(1):563. doi: 10.1038/s42003-020-01288-3. Commun Biol. 2020. PMID: 33037320 Free PMC article. Clinical Trial.
-
Regulation of chlamydial spreading from the small intestine to the large intestine by IL-22-producing CD4+ T cells.Infect Immun. 2024 Jan 16;92(1):e0042123. doi: 10.1128/iai.00421-23. Epub 2023 Dec 4. Infect Immun. 2024. PMID: 38047677 Free PMC article.
-
Decreased frequency of Th22 cells and IL-22 cytokine in kidney transplant patients with active cytomegalovirus infection.BMC Immunol. 2023 Jul 4;24(1):18. doi: 10.1186/s12865-023-00555-2. BMC Immunol. 2023. PMID: 37403036 Free PMC article.
-
Unmasking the hidden impact of viruses on tuberculosis risk.Trends Immunol. 2024 Sep;45(9):649-661. doi: 10.1016/j.it.2024.07.008. Epub 2024 Aug 23. Trends Immunol. 2024. PMID: 39181733 Free PMC article. Review.
References
-
- World Health Organization. 2020. Global Tuberculosis Report.
-
- El-Sadr WM, Perlman DC, Denning E, Matts JP, and Cohn DL. 2001. A review of efficacy studies of 6-month short-course therapy for tuberculosis among patients infected with Human Immunodeficiency Virus: differences in study outcomes. Clin. Infect. Dis 32: 623–632. - PubMed
-
- Esmail H, Riou C, du Bruyn E, Lai RP-J, Harley YXR, Meintjes G, Wilkinson KA, and Wilkinson RJ. 2018. The Immune Response to Mycobacterium tuberculosis in HIV-1-Coinfected Persons. Annu. Rev. Immunol 36: 1–36. - PubMed
Publication types
MeSH terms
Substances
Grants and funding
LinkOut - more resources
Full Text Sources
Medical
Research Materials
