. 2021 Sep 1;207(5):1344-1356.
doi: 10.4049/jimmunol.2100465. Epub 2021 Aug 13.

Protracted yet Coordinated Differentiation of Long-Lived SARS-CoV-2-Specific CD8+ T Cells during Convalescence

Affiliations

Protracted yet Coordinated Differentiation of Long-Lived SARS-CoV-2-Specific CD8+ T Cells during Convalescence

Tongcui Ma et al. J Immunol. .

Abstract

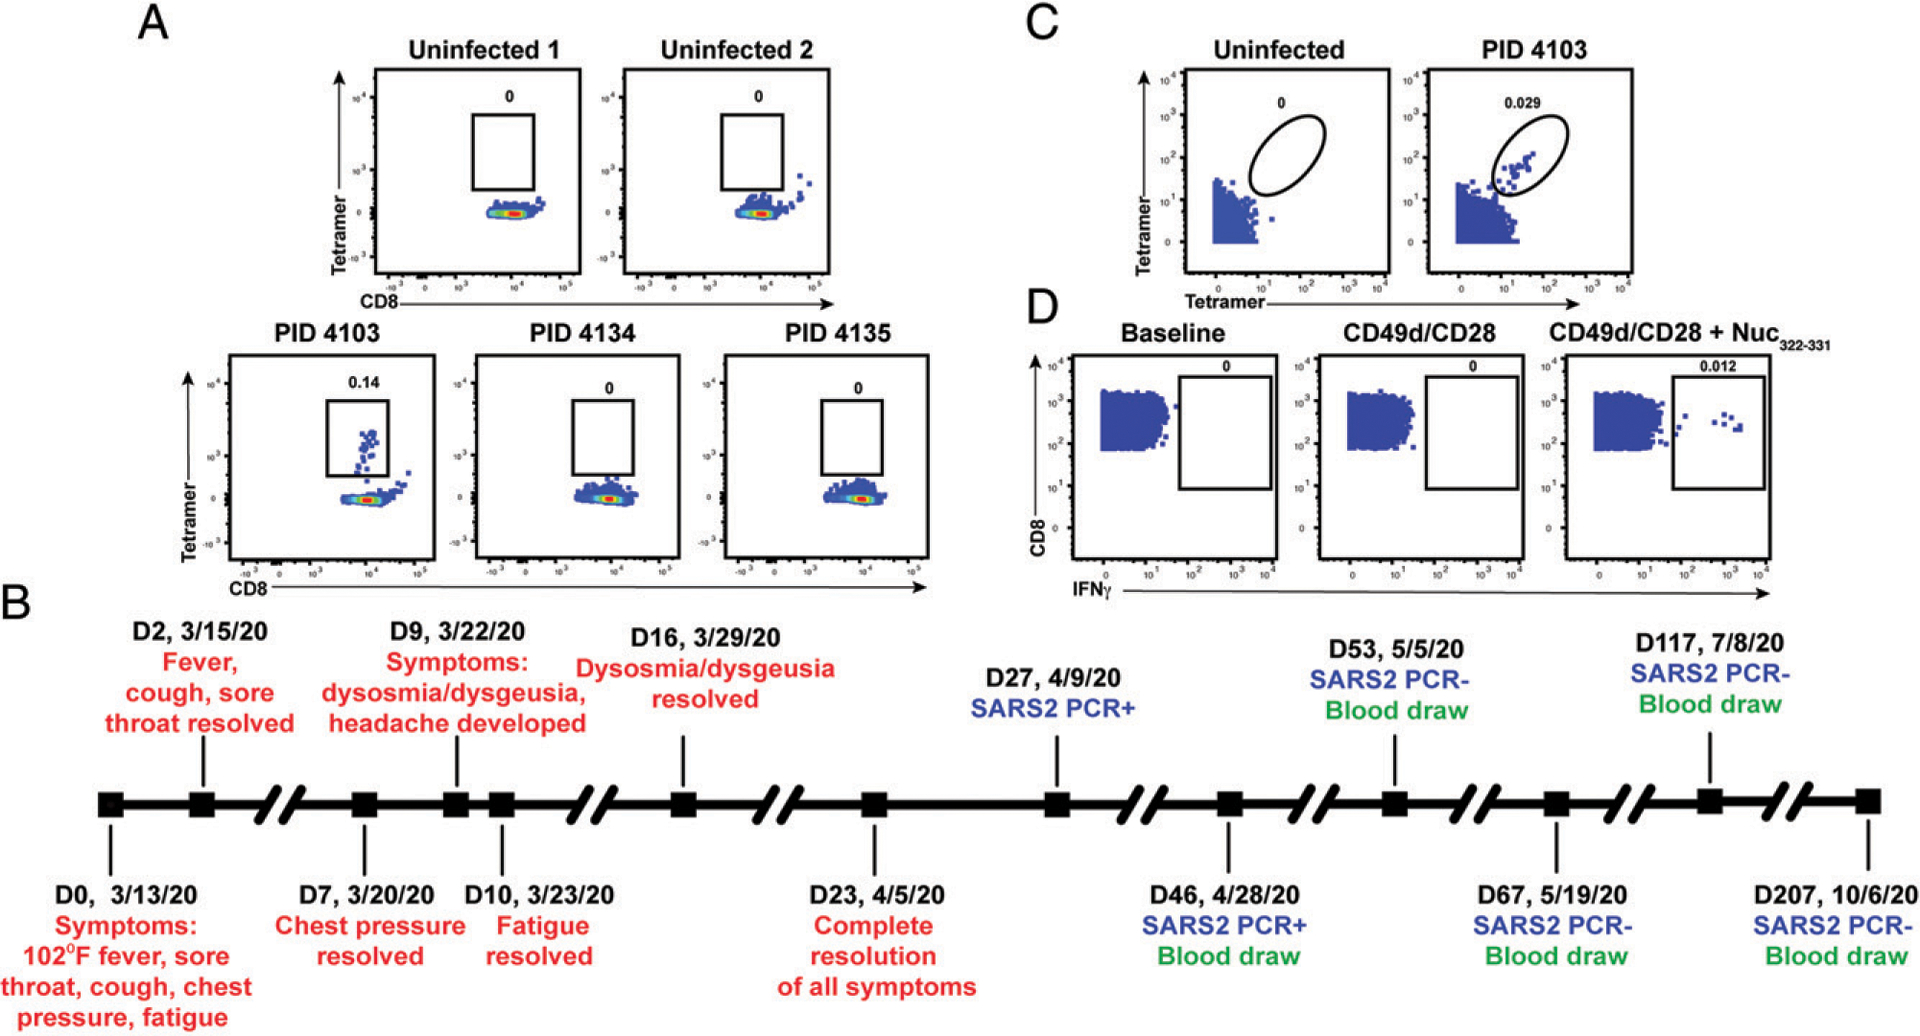
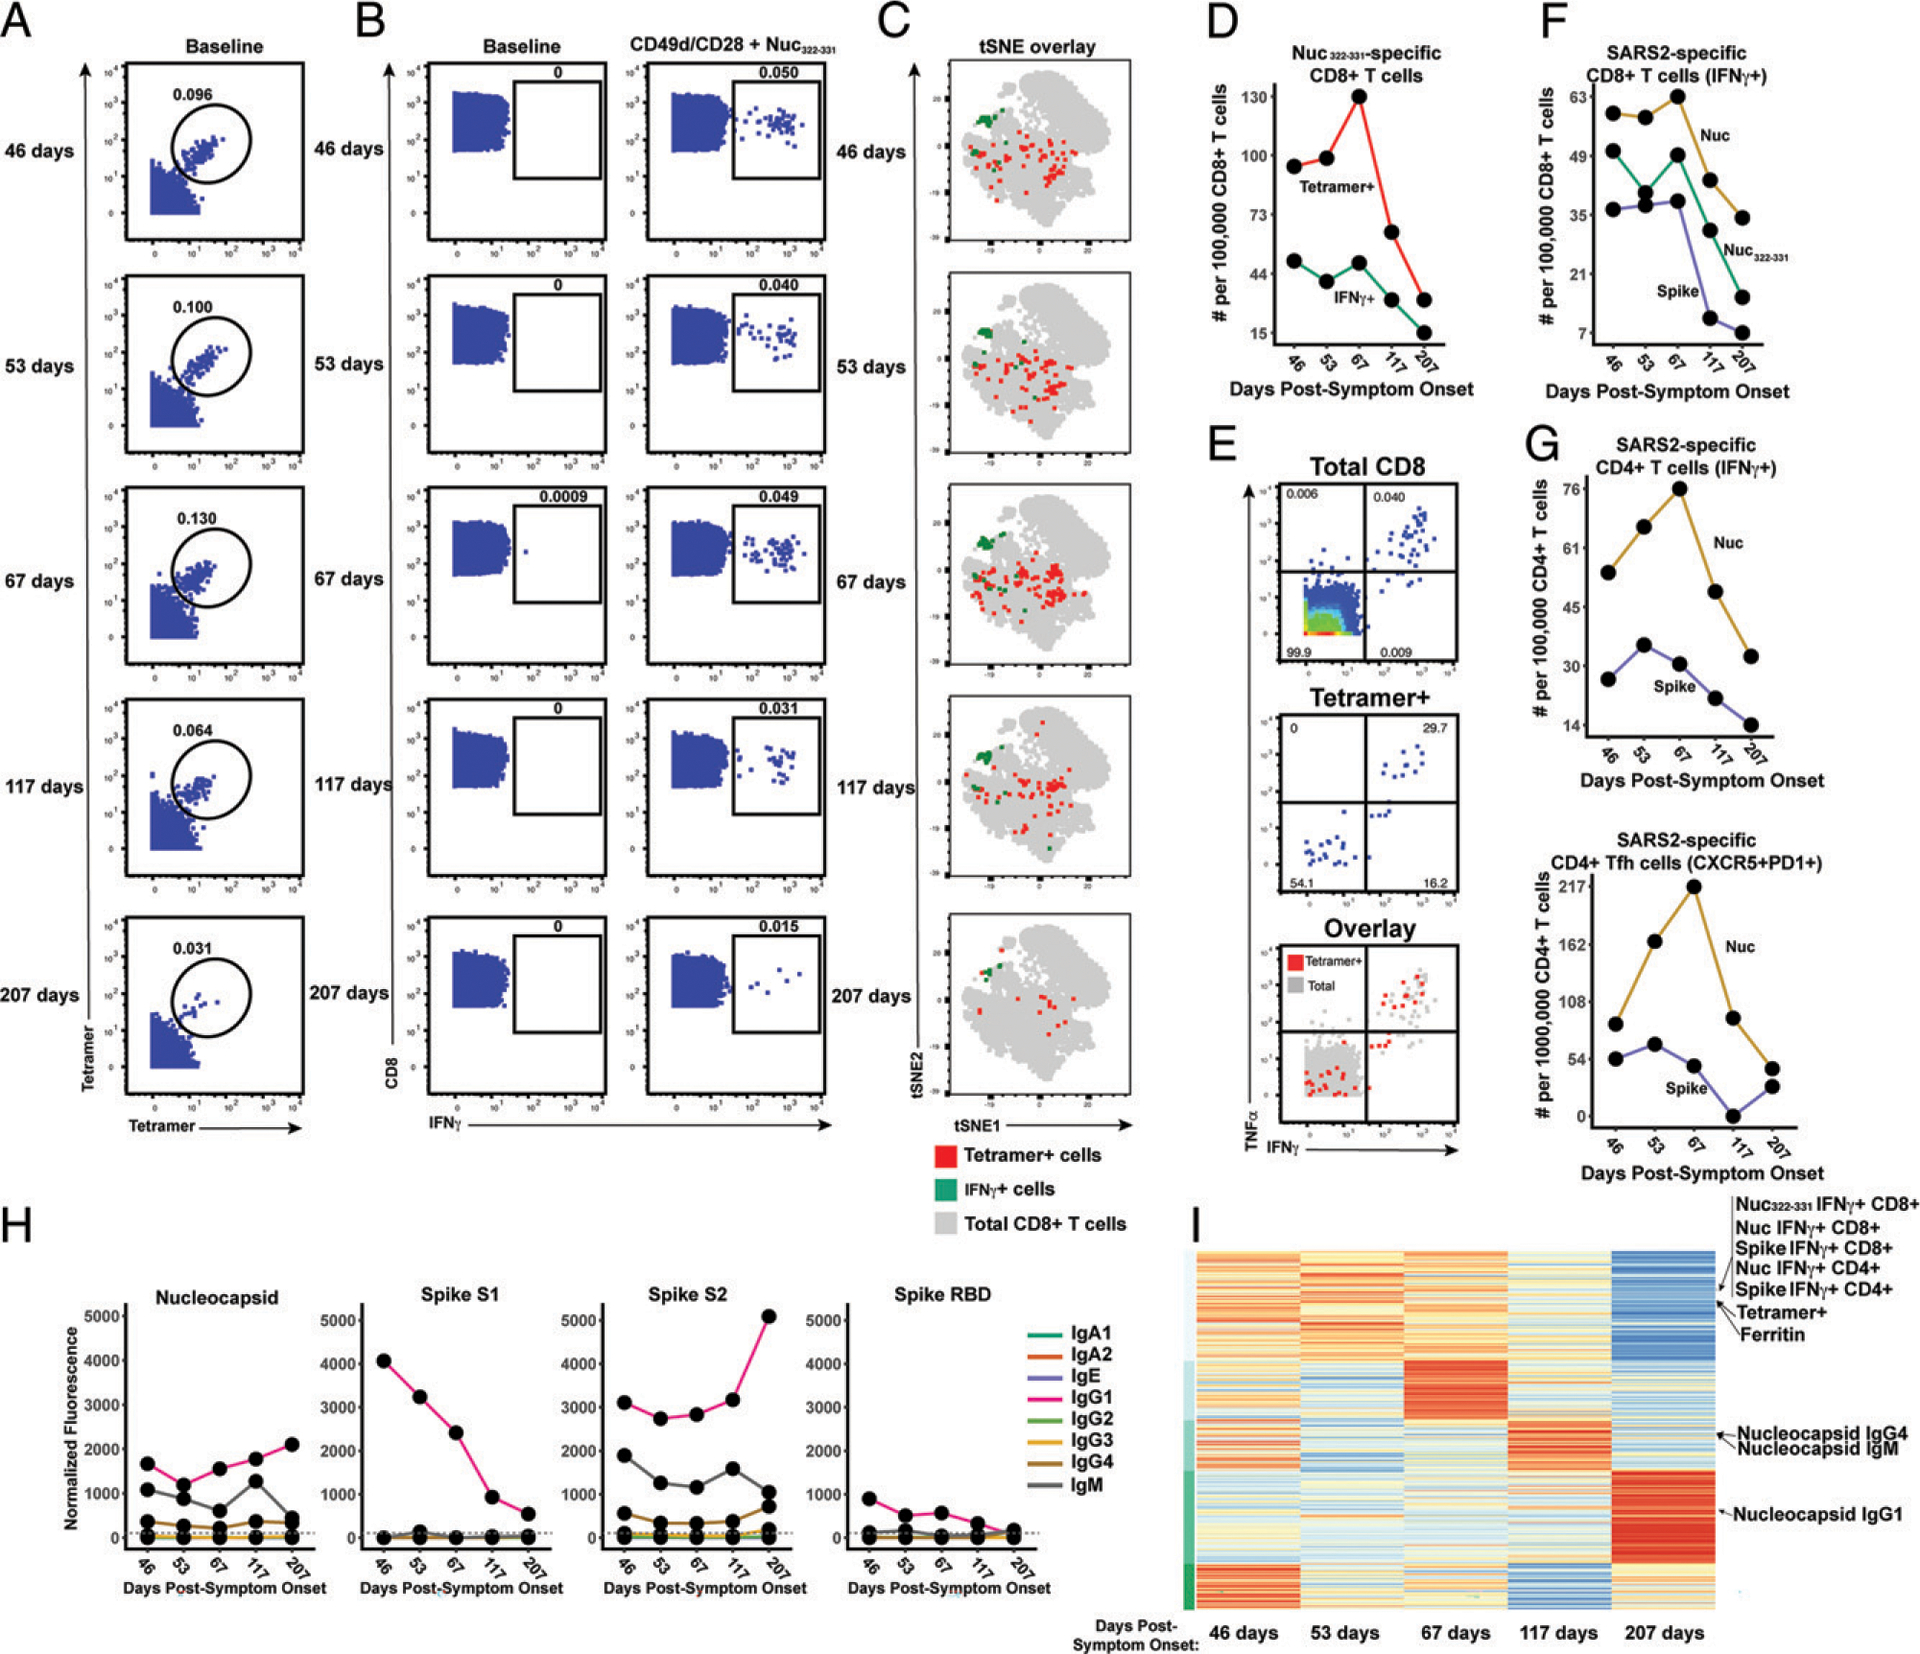
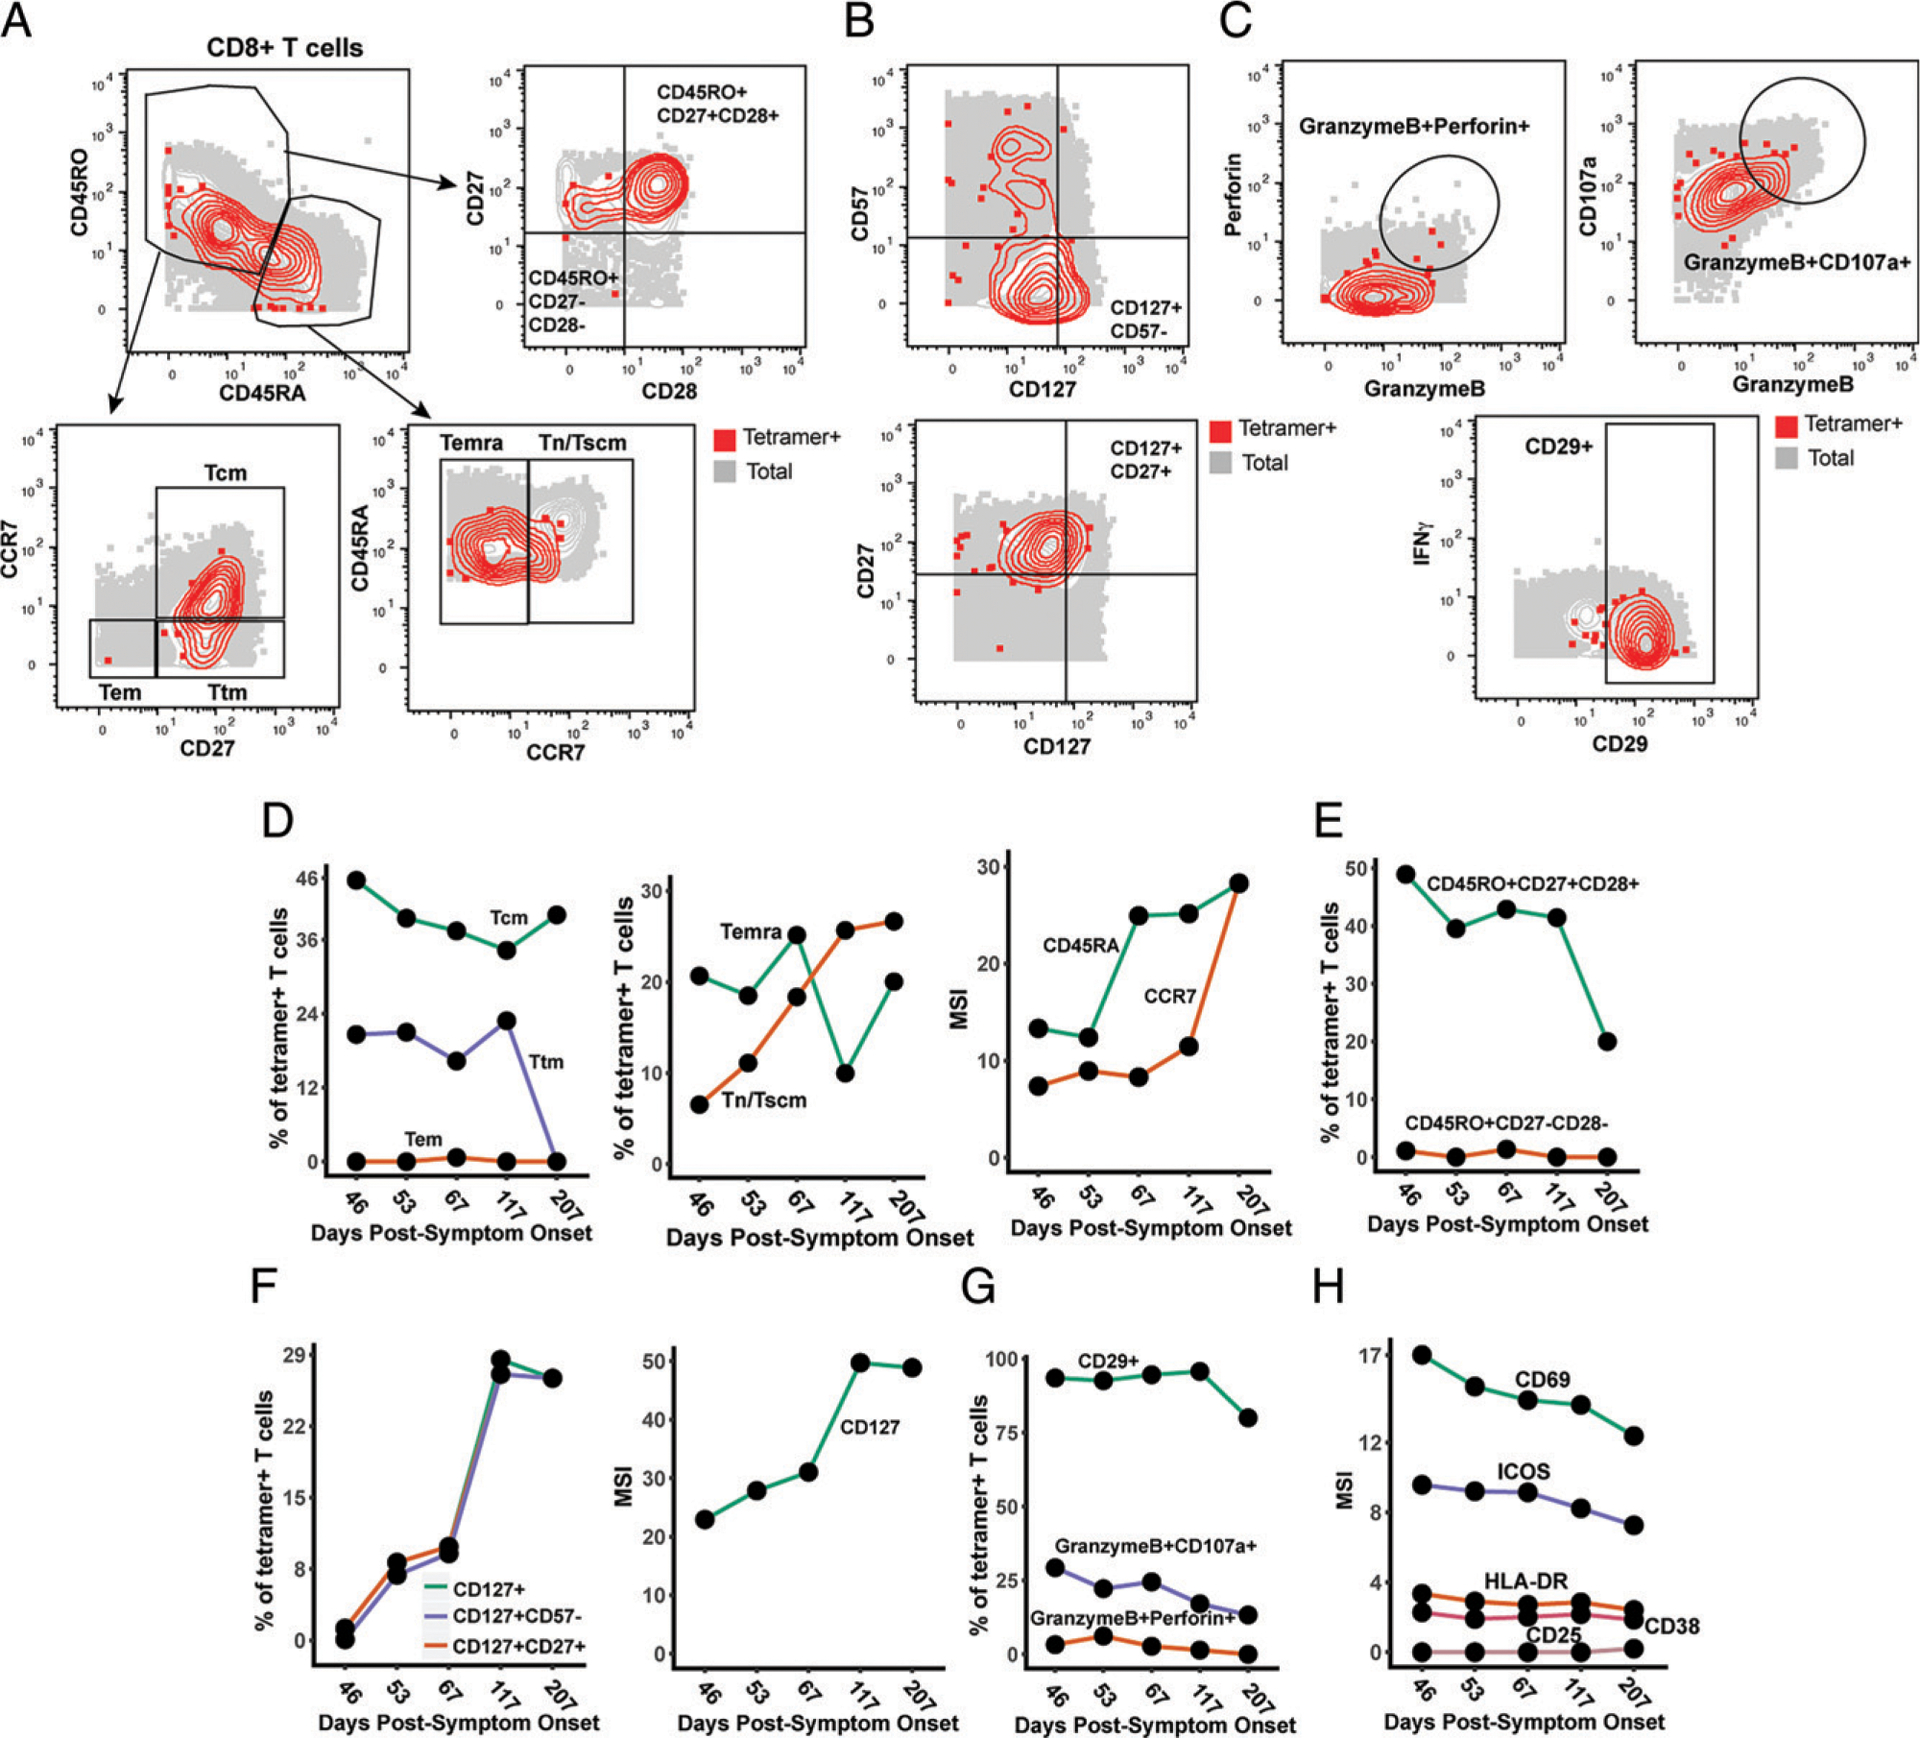
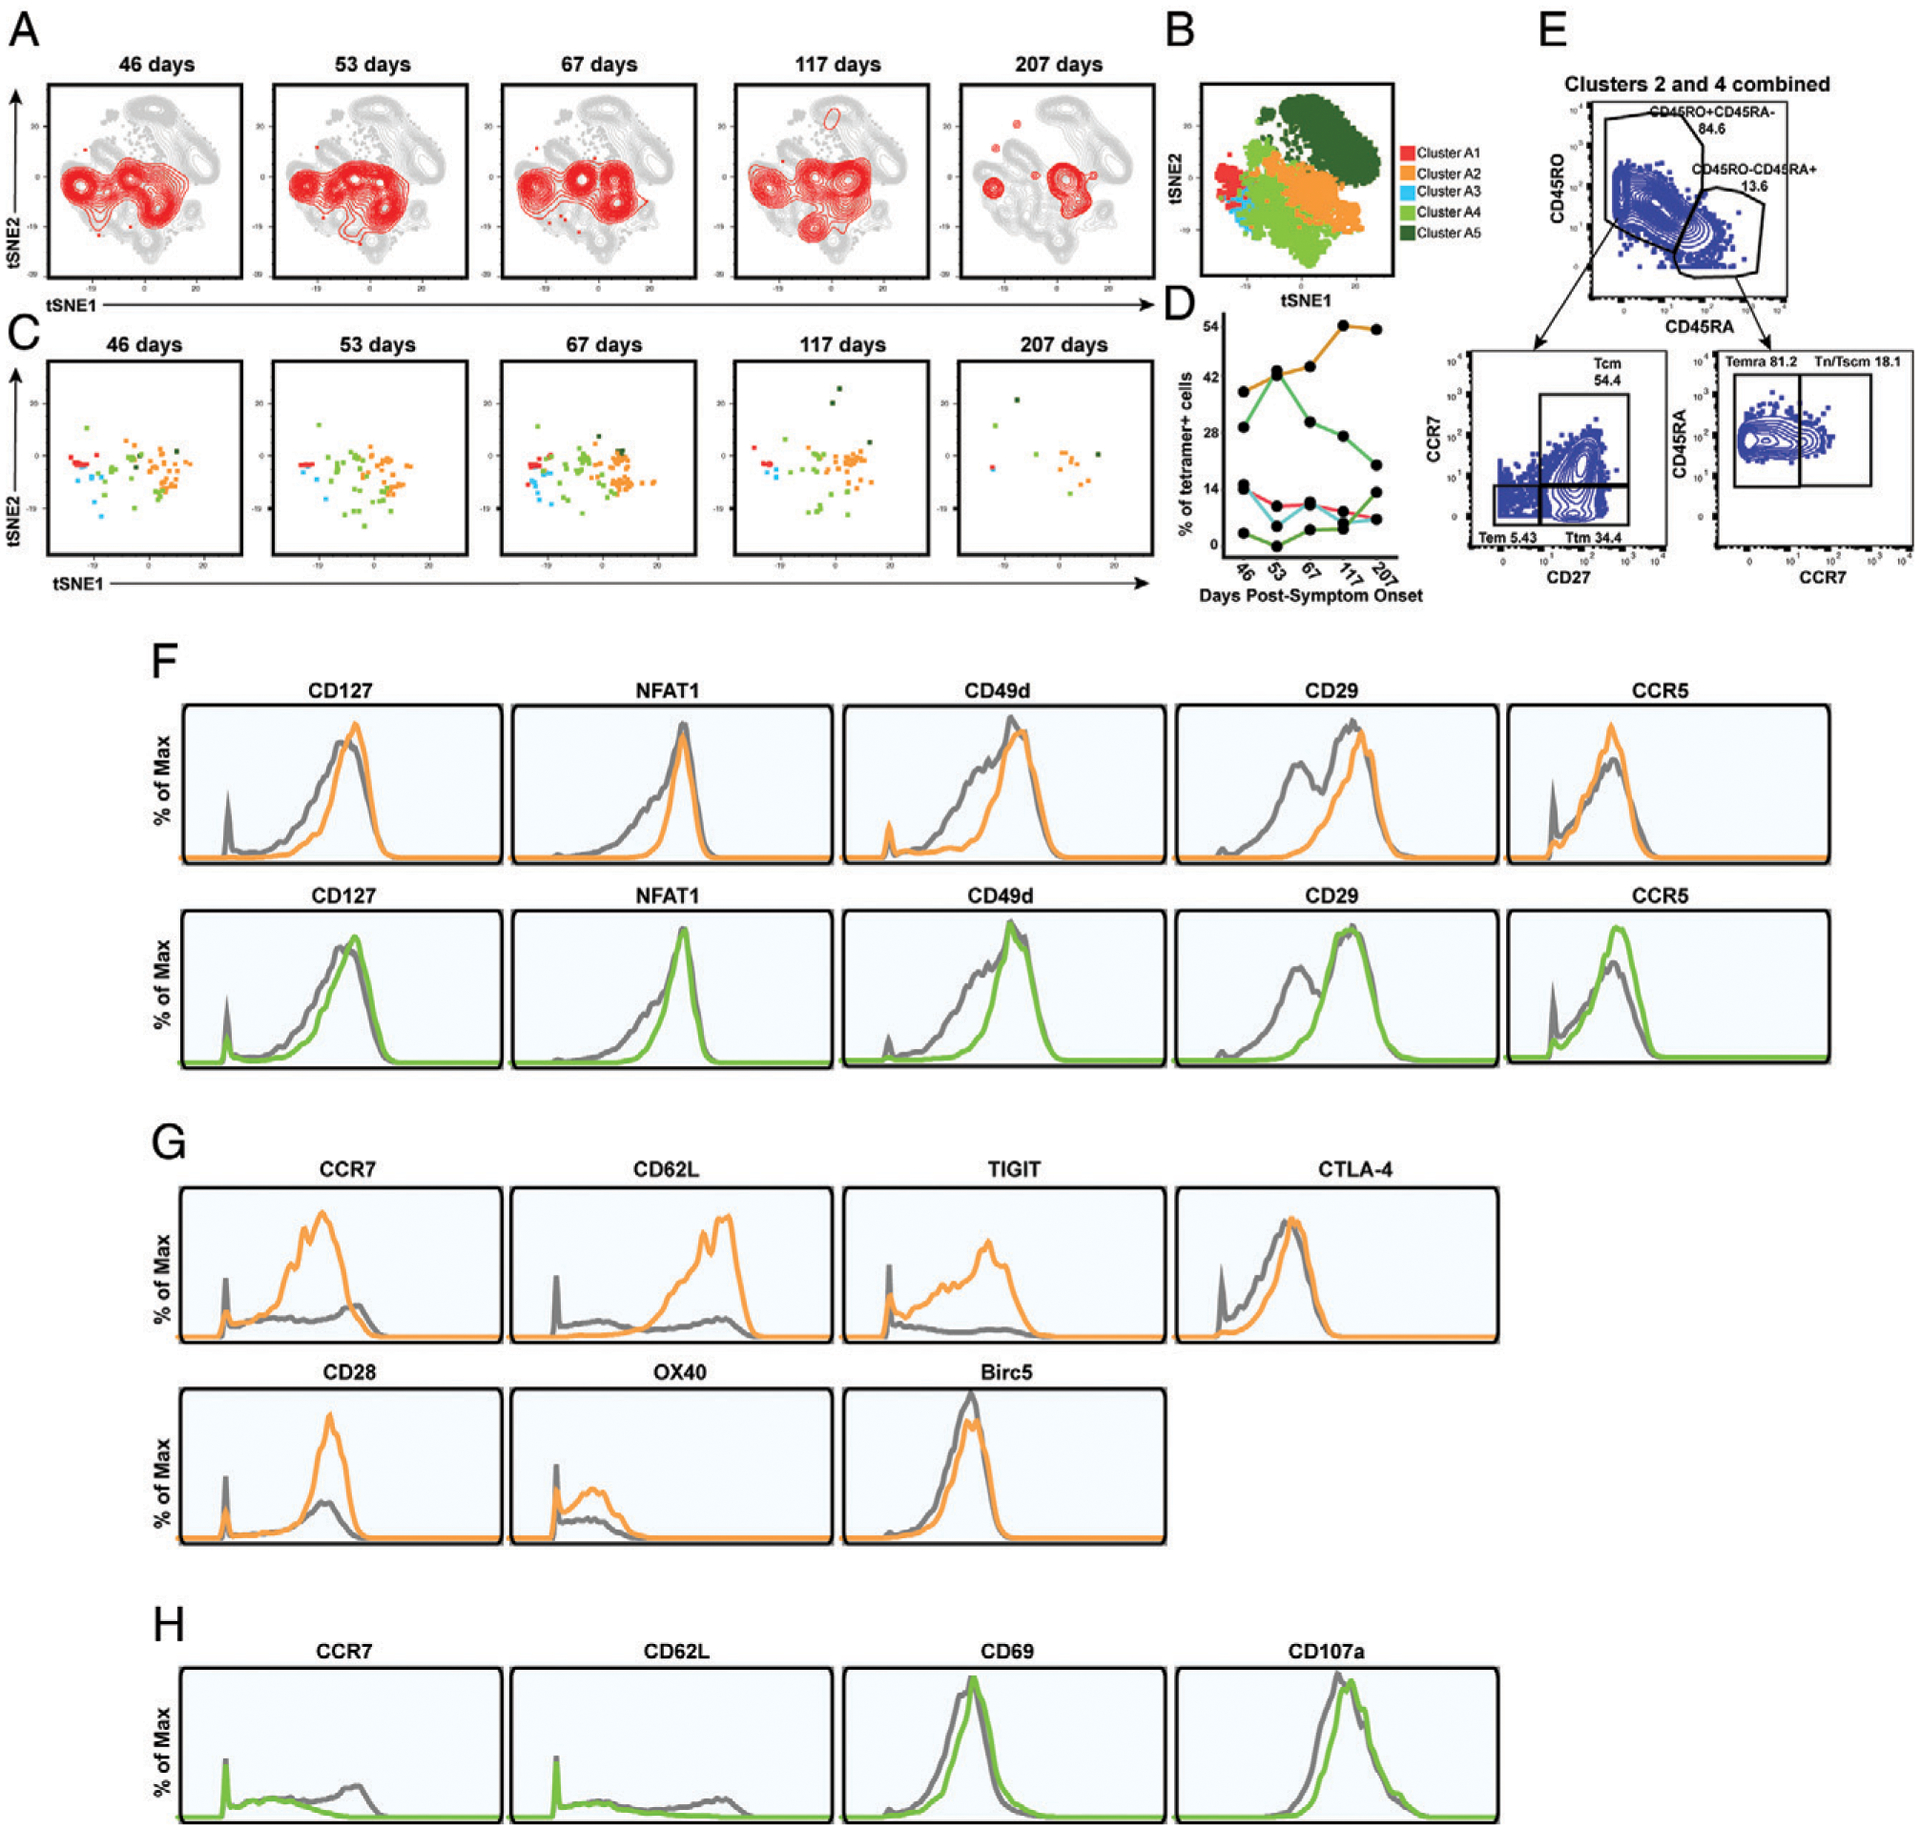
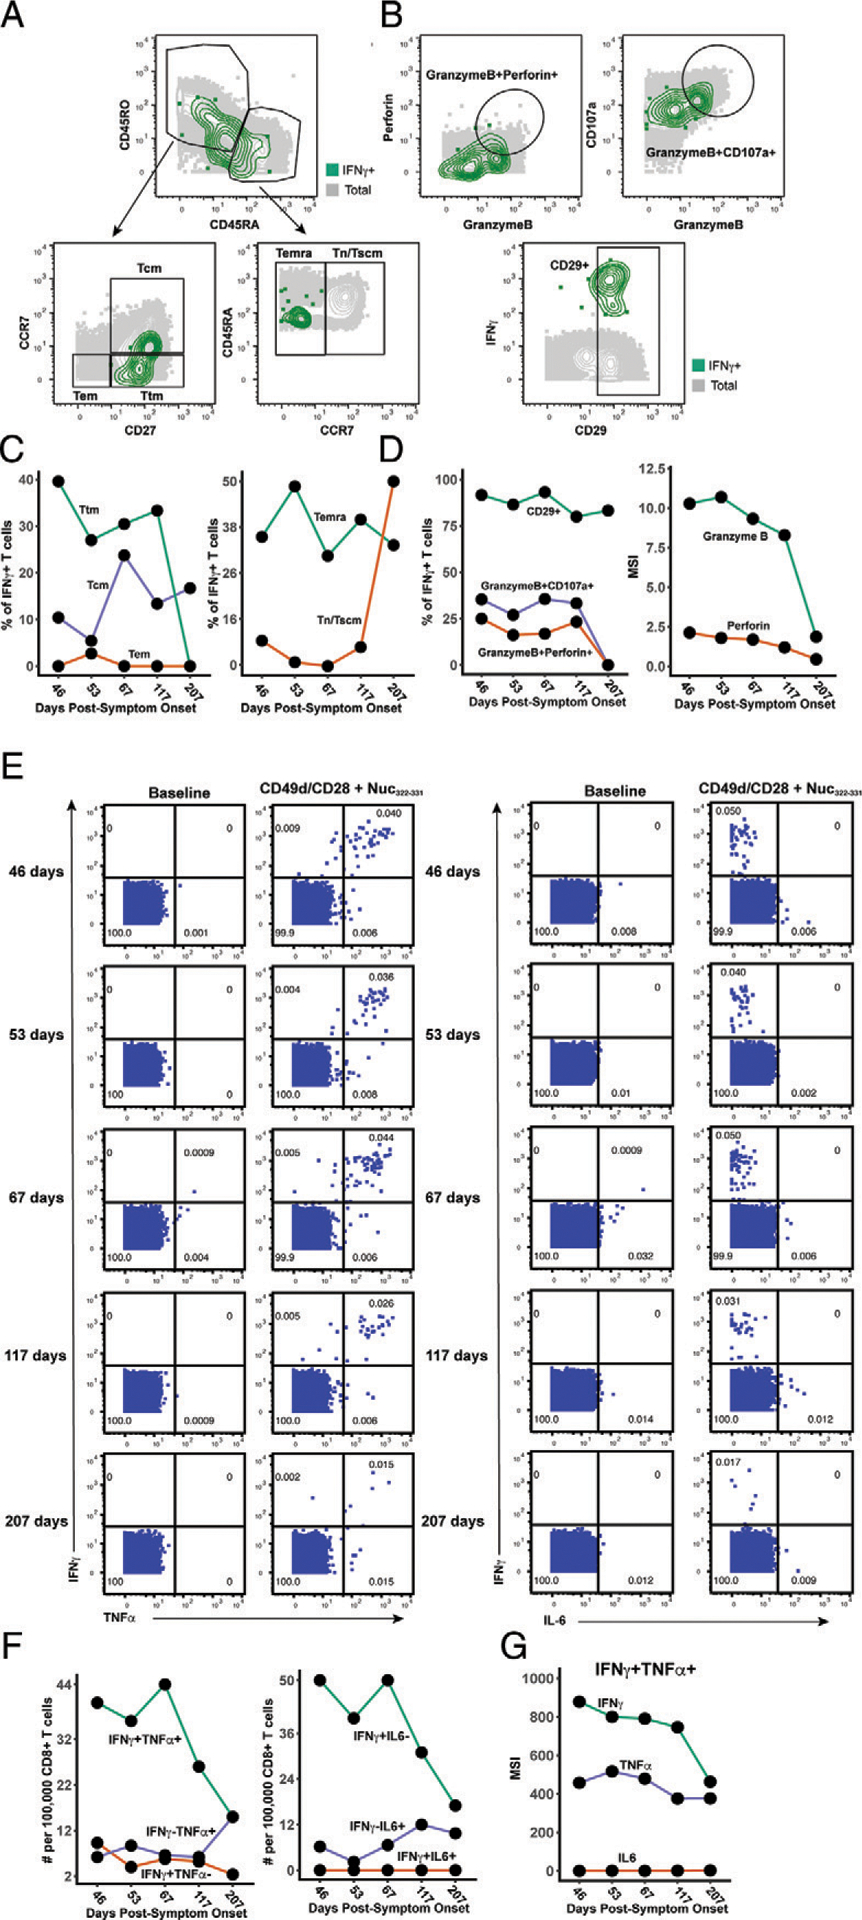
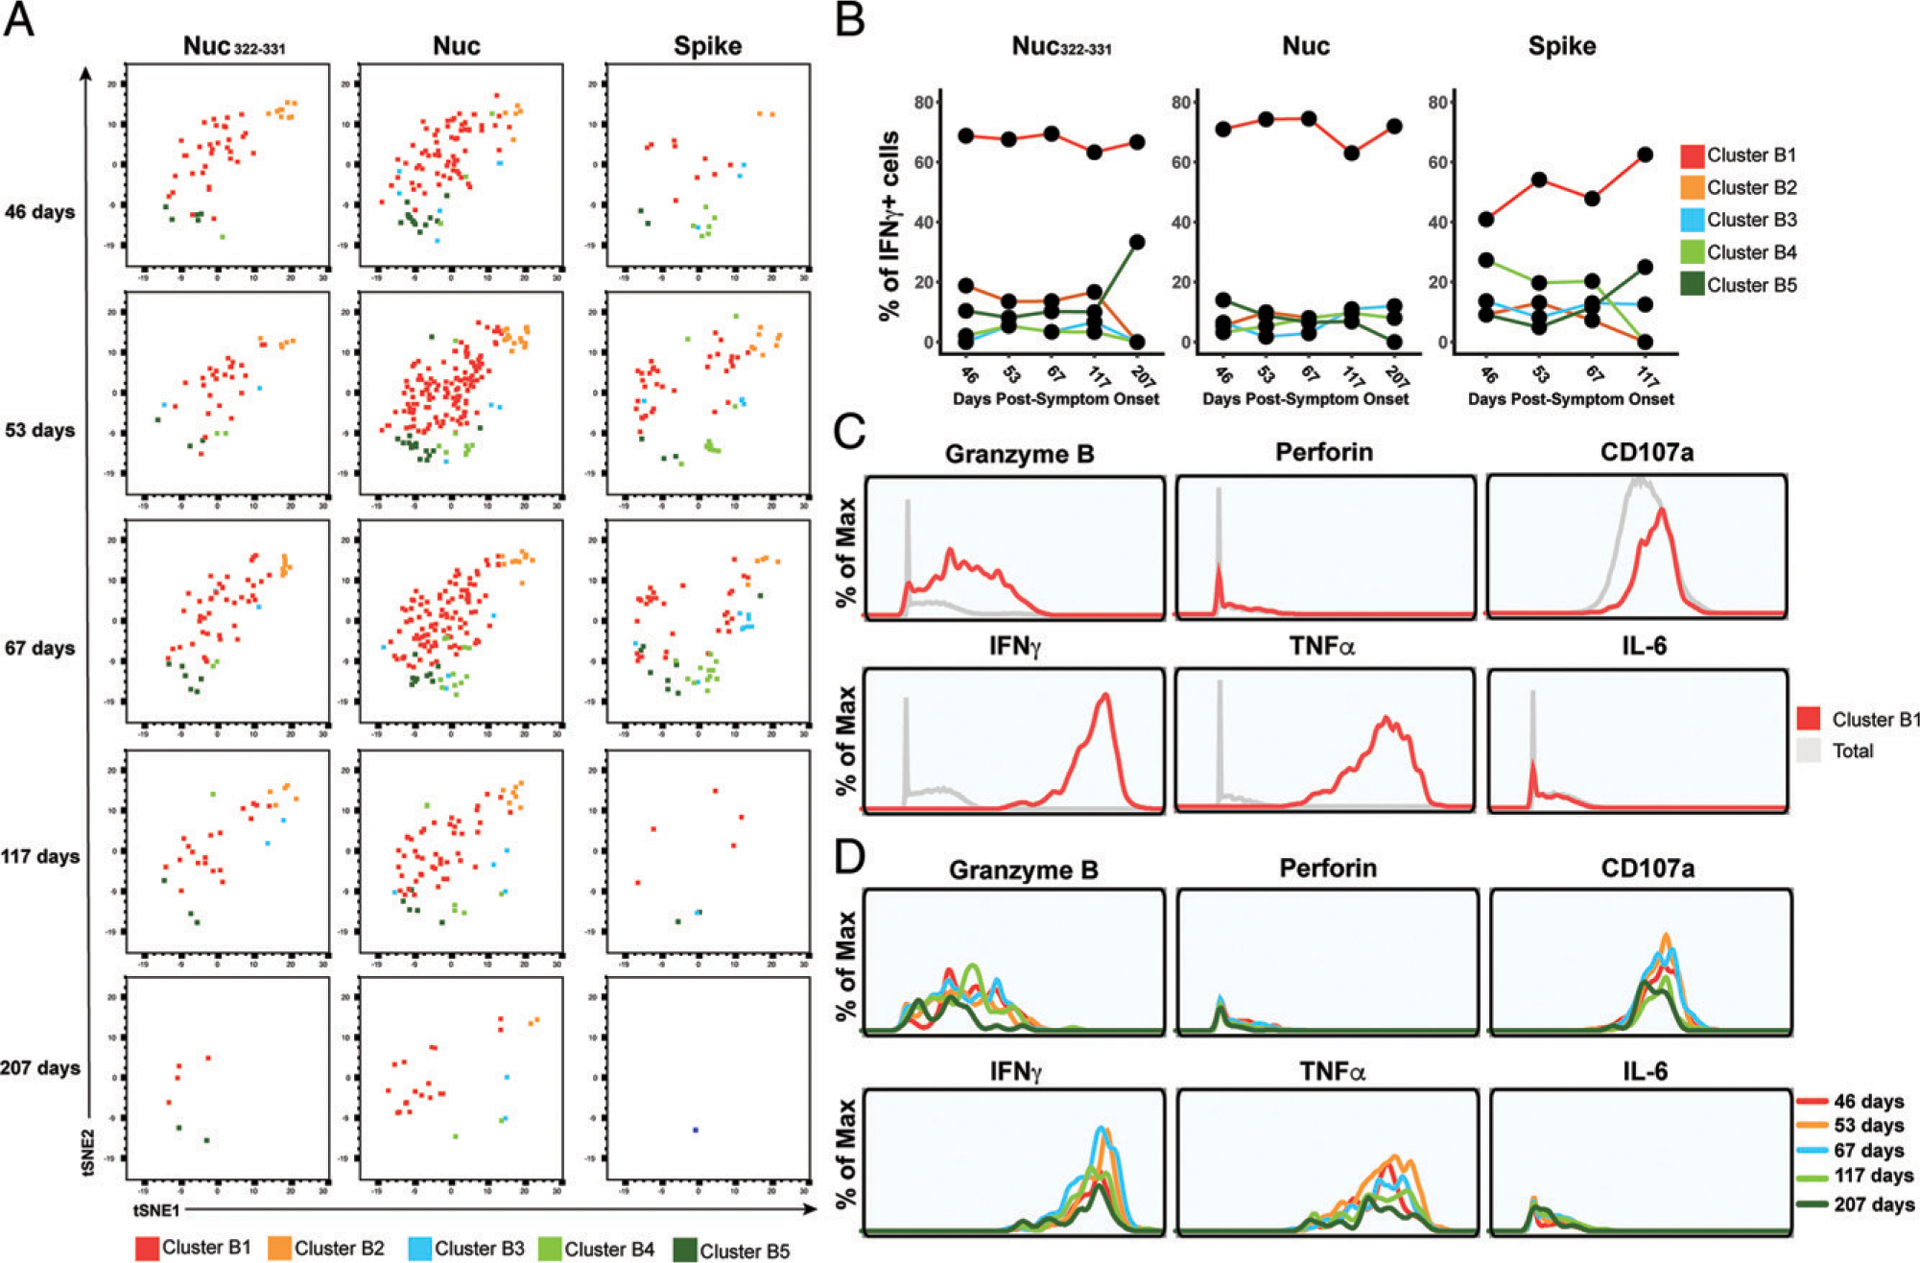
CD8+ T cells can potentiate long-lived immunity against COVID-19. We screened longitudinally-sampled convalescent human donors against SARS-CoV-2 tetramers and identified a participant with an immunodominant response against residues 322 to 311 of nucleocapsid (Nuc322-331), a peptide conserved in all variants of concern reported to date. We conducted 38-parameter cytometry by time of flight on tetramer-identified Nuc322-331-specific CD8+ T cells and on CD4+ and CD8+ T cells recognizing the entire nucleocapsid and spike proteins, and took 32 serological measurements. We discovered a coordination of the Nuc322-331-specific CD8+ T response with both the CD4+ T cell and Ab pillars of adaptive immunity. Over the approximately six month period of convalescence monitored, we observed a slow and progressive decrease in the activation state and polyfunctionality of Nuc322-331-specific CD8+ T cells, accompanied by an increase in their lymph node-homing and homeostatic proliferation potential. These results suggest that following a typical case of mild COVID-19, SARS-CoV-2-specific CD8+ T cells not only persist but continuously differentiate in a coordinated fashion well into convalescence into a state characteristic of long-lived, self-renewing memory.


Conflict of interest statement

Disclosures

The authors have no financial conflicts of interest.

Figures

FIGURE 1.
FIGURE 1.
Identification and description of case study PID4103 with immunodominant CD8+ T cell response against Nuc322–331. (A) A distinct population of Nuc322–331–specific CD8+ T cells is detected by FACS tetramer staining in convalescent donor PID4103. Top, PBMCs from uninfected individuals were analyzed by FACS for binding to the HLA-B*40:01/Nuc322–331 tetramer. Results are representative of six independent uninfected donors. Bottom, PBMCs from convalescent COVID-19 individuals from the CHIRP cohort were analyzed by FACS for binding to the HLA-B*40:01/Nuc322–331 tetramer. Participant PID4103 but not participants PID4134 and PID4135 harbors cells binding to the tetramer. Numbers correspond to the percentage of cells within the gates. Results are gated on live, singlet CD3+CD8+ cells. (B) Timeline of clinical course of PID4103’s SARS-CoV-2 infection and sampling. Red indicates the dates of specific symptom initiation and resolution, blue indicates the dates and results of SARS-CoV-2 PCR tests, and green indicates the dates of blood draws. (C) A distinct population of Nuc322–331–specific CD8+ T cells is detected by CyTOF in PID4103 through dual-tetramer staining. PBMCs from one uninfected individual and from PID4103 were stained with two sets of HLA-B*40:01/Nuc322–331 tetramers conjugated to different metal lanthanides, facilitating specific detection of Nuc322–331–specific CD8+ T cells. Numbers correspond to the percentage of cells within the gates. Results are gated on live, singlet CD3+CD8+ cells. (D) Nuc322–331–specific CD8+ T cells can be stimulated by the Nuc322–331 peptide. PBMCs from PID4103 were phenotyped by CyTOF at baseline or following 4 h of costimulation with αCD49d/CD28 Ab in the absence or presence of the Nuc322–331 peptide. Stimulations were conducted in the presence of brefeldin A to enable the detection of IFN-γ. Numbers correspond to the percentage of cells within the gates. Results are gated on live, singlet CD3+CD8+ cells. The PID4103 specimens in (A) were obtained from the day 53 study visit, whereas those from (C) and (D) were obtained from the day 207 study visit.
FIGURE 2.
FIGURE 2.
Longitudinal assessment of Nuc322–331–specific CD8+ T cell responses in PID4103 reveals coordination with other components of Ag-specific adaptive immunity. (A) Identification of Nuc322–331–specific CD8+ T cells by CyTOF. Baseline specimens that never underwent any stimulation were stained with HLA-B*40:01/Nuc322–331 tetramers detectable on two different CyTOF channels. The timeline refers to days since symptom onset. Numbers correspond to the percentage of cells within the gate. Results are gated on live, singlet CD3+CD8+ cells. (B) CD8+ T cells specifically producing IFN-γ in response to Nuc322–331 stimulation were detected at all five timepoints. Numbers correspond to the percentage of cells within the gate. Results are gated on live, singlet CD3+CD8+ cells. (C) Tetramer+ and IFN-γ+ cells responding to Nuc322–331 treatment reside in unique regions of the tSNE, suggesting phenotypic changes elicited by cognate peptide recognition. tSNE plots of total CD8+ T cells (gray), tetramer+ (red) from the baseline samples, and IFN-γ+ (green) cells from the peptide-stimulated samples over the course of convalescence of PID4103. Datasets correspond to those extracted from the data presented in (A) and (B). (D) The tetramer+ response is higher in magnitude than the IFN-γ+ response but exhibits similar kinetics, peaking 67 d postsymptom onset. Datasets correspond to those extracted from the data presented in (A) and (B). (E) Approximately half of tetramer+ cells in Nuc322–331–stimulated samples do not secrete IFN-γ or TNF-α. PBMCs from PID4103 were stimulated with Nuc322–331, stained with HLA-B*40:01/Nuc322–331 tetramers, and analyzed by CyTOF. A total of 54.1% of tetramer+ cells expressed neither IFN-γ nor TNF-α, suggesting that approximately half of tetramer+ cells are not identified using the cytokine secretion assay. (F) The responses of CD8+ T cell to Nuc322–331, the entire nucleocapsid protein (Nuc), and the entire spike protein are coordinated. Note that the IFN-γ+ response to Nuc322–331 is greater than the response to the entire spike proteins and less than the response to the entire nucleocapsid protein. (G) The total and Tfh CD4+ T cell responses against nucleocapsid peaks 67 d postsymptom onset, whereas the response to spike peaks slightly earlier. Total (left) or Tfh (CD4+CD45RO+CD45RAPD1+CXCR5+) (right) CD4+ T cells responding to overlapping peptides spanning the entire nucleocapsid or spike proteins were assessed. (H) Titers of different Ab types against nucleocapsid, and the S1, S2, and RBD domains of spike monitored at the five timepoints and expressed as normalized fluorescence values (see Materials and Methods). The dotted line indicates the limit of detection. (I) Unsupervised k-means clustering of cells, Abs, and other biomarkers based on their abundance in PID4103’s blood across five time points. For each biomarker, abundance is normalized across time points and colored from red (highest) to blue (lowest). The CD4+ and CD8+ T cell against Nuc322–331, nucleocapsid, and spike clustered together. Interestingly, ferritin levels clustered close to them. In contrast, Ab responses against nucleocapsid were delayed and occurred after the peaks of the T cell responses. The green bars on the left correspond to clustering as determined by k-means.
FIGURE 3.
FIGURE 3.
Nuc322–331–specific CD8+ T cells in PID4103 slowly differentiate over the course of convalescence to a less activated state more capable of expanding and migrating to lymph nodes. (A) Gating strategy to identify CD8+ Tcm, Tem, Ttm, Temra, and Tn/Tscm at early and late differentiation stages. The Nuc322–331–specific CD8+ T cells (tetramer+) cells are shown as red contours, whereas total CD8+ T cells are shown in gray. The following gates were used: Tcm (CD45RO+CD45RACD27+CCR7+), Ttm (CD45RO+CD45RACD27+CCR7), Tem (CD45RO+CD45RACD27CCR7), Temra (CD45ROCD45RA+CCR7), Tn/Tscm (CD45ROCD45RA+CCR7+), early differentiation (CD45RO+CD45RACD27+CD28+), and late differentiation (CD45RO+CD45RACD27CD28). (B) Gating strategy to identify different populations of CD127+ cells among total (gray) and Nuc322–331–specific (red) CD8+ T cells. Shown also are gates for less differentiated (CD57) and Tcm-like (CD27+) CD127+ T cells. (C) Gating strategy to identify cytolytic Nuc322–331–specific CD8+ T cells. Top, Gates defining CD8+ T cells coexpressing granzyme B and perforin, or granzyme and CD107a. Bottom, Gate defining cells expressing high levels of CD29, a marker for cytolytic CD8+ T cells. (D) The proportions of tetramer+ cells belonging to the Tcm, Tem, Ttm, Temra, and Tn/Tscm subsets as defined in (A) are shown in the first two plots. Note the high contribution of Tcm at all timepoints and the progressive increase of the Tn/Tscm subset over time. The panel on the right displays the median expression levels of CD45RA and CCR7 [markers used to define the Tn/Tscm subset (A)] within the tetramer+ population. (E) Early differentiated CD8+ T cells steeply decline in abundance only at the final timepoint, 207 d postsymptom onset. Shown are the proportions of tetramer+ cells belonging to the early (CD45RO+CD27+CD28+) and late (CD45RO+CD27CD28)-differentiated subsets over the course of convalescence. (F) Progressive increase in CD127+ Nuc322–331–specific CD8+ T cells over an ~6 mo period of convalescence. Left, Proportions of tetramer+ cells that were CD127+, CD127+CD57, and CD127+CD27+. The overlapping frequencies of the three populations of cells suggest that most of the CD127+ cells are CD57 and CD27+. Right, Median expression levels of CD127 within the tetramer+ population. (G) Cytolytic Nuc322–331–specific CD8+ T cells slowly decrease over the course of convalescence. The proportions of tetramer+ cells that were CD29+, granzymeB+CD107a+, and granzymeB+perforin+ are shown. (H) The activation state of Nuc322–331–specific CD8+ T cells generally decreases slowly over the course of convalescence. The median expression levels of the indicated activation markers on tetramer+ cells are shown. A gradual decrease was apparent among CD69, ICOS, HLADR, and CD38 but not CD25, whose expression was low at all time points.
FIGURE 4.
FIGURE 4.
Clusters of Nuc322–331–specific CD8+ T cells from PID4103 exhibit different expansion and contraction. (A) The overall phenotypes of Nuc322–331–specific CD8+ T cells change over the course of convalescence. tSNE plots of total (gray) and tetramer+ (red) CD8+ T cells as a function of time since symptom onset. (B) FlowSOM clusters of CD8+ T cells. Total CD8+ T cells (including the tetramer+ cells) were clustered by FlowSOM to identify five clusters. The location of each cluster is mapped onto the tSNE space depicted in (A). (C) Distribution over time of Nuc322–331–specific CD8+ T cells among the five clusters identified in (B). (D) Proportion of Nuc322–331–specific CD8+ T cells in each cluster as a function of time since symptom onset. The dominant clusters, A2 and A4, increase and decrease over time, respectively. (E) Clusters A2 and A4 include multiple cellular subsets. Gating strategy showing the identification of the Tcm, Tem, Ttm, Temra, and Tn/Tscm subsets, all of which were well-represented among the two dominant clusters. (F) Phenotypic features shared by clusters A2 and A4. Relative to total CD8+ T cells, clusters A2 and A4 expressed high levels of CD127, the transcription factor NFAT1, and the lung-homing receptors CD49d, CD29, and CCR5. Total CD8+ T cells are depicted in gray, cluster A2 cells are depicted in orange, and cluster A4 cells are depicted in green. (G) Phenotypic features exhibited by cluster A2 and not A4. Cluster A2, whose contribution among tetramer+ cells increased over the course of convalescence, expressed high levels of the lymph node–homing receptors CCR7 and CD62L, the checkpoint molecules TIGIT and CTLA4, the costimulatory molecules CD28 and Ox40, and the prosurvival factor BIRC5. Total CD8+ T cells are depicted in gray, and cluster A2 cells are depicted in orange. (H) Phenotypic features exhibited by cluster A4 and not A2. Cluster A4, whose contribution among tetramer+ cells decreased over the course of convalescence, expressed low levels of the lymph node–homing receptors CCR7 and CD62L, high levels of the activation marker CD69, and high levels of the degranulation marker CD107a.
FIGURE 5.
FIGURE 5.
Polyfunctional Nuc322–331–specific CD8+ T cells are detected months into PID4103’s convalescence. (A) Gating strategy to identify the Tcm, Tem, Ttm, Temra, and Tn/Tscm subsets of Nuc322–331–specific CD8+ T cells, identified as those responding to peptide stimulation by producing IFN-γ. The Nuc322–331–specific CD8+ T cells (IFN-γ+) cells are shown as green contours, and total CD8+ T cells are shown in gray. Subset definitions are identical to those used in Figure 3A. (B) Gating strategy to identify cytolytic Nuc322–331–specific CD8+ T cells among those inducing IFN-γ upon cognate peptide stimulation. Top, Gates defining CD8+ T cells coexpressing granzyme B and perforin or granzyme and CD107a are indicated. Bottom, Gate defining cells expressing high levels of CD29, a marker for cytolytic CD8+ T cells. (C) Proportion of IFN-γ+ Nuc322–331–specific CD8+ T cells belonging to the Tcm, Tem, Ttm, Temra, and Tn/Tscm subsets as defined in (A). The lower contribution of Tcm at all time points is likely mediated by activation-induced CCR7 downregulation. Similar to the tetramer data (Fig. 3D), an increase in the contribution of the Tn/Tscm subset was observed over time. (D) Cytolytic Nuc322–331–specific CD8+ T cells slowly decrease over the course of convalescence. Left, Proportion of IFN-γ+ cells that were CD29+, granzymeB+CD107a+, and granzymeB+perforin+. Right, Median expression levels of the indicated cytolytic activity markers on the IFN-γ+ cells. (E) Most Nuc322–331–specific CD8+ T cells responding to peptide stimulation secrete multiple cytokines. Dot plots showing the expression of IFN-γ and TNF-α (left) or IFN-γ and IL-6 (right) on CD8+ T cells among baseline or peptide-stimulated samples. Numbers correspond to the percentage of cells within the gates. Results are gated on live, singlet CD3+CD8+ cells. Most responding Nuc322–331–specific CD8+ T cells were IFN-γ+TNF-α+IL-6. (F) The proportion of IFN-γ+TNF-α+IL-6CD8+ T cells responding to Nuc322–331 stimulation decreases over the course of convalescence. The cell populations are taken from the gates shown in (E). (G) The level of IFN-γ and TNF-α produced by Nuc322–331–specific CD8+ T cells decreases over the course of convalescence, as shown by median signal intensity of the IFN-γ+TNF-α+ cells.
FIGURE 6.
FIGURE 6.
PID4103’s CD8+ T cells responding to Nuc322–331 stimulation are more similar to those responding to nucleocapsid than to spike peptides. (A) Cluster distribution of CD8+ T cells responding to Nuc322–331 or to peptides spanning the entire nucleocapsid or spike proteins. IFN-γ+ CD8+ T cells from the Nuc322–331−, nucleocapsid-, or spike-stimulated specimens were split into five clusters (B1–B5) by FlowSOM. The responding cells are shown as dot plots and colored according to their cluster membership. Note the higher similarity of cells in the tSNE among the Nuc322–331–and Nuc-specific cells, relative to the spike-specific ones. (B) Cluster B1 is dominant among CD8+ T cells with all three specificities but more prominent among the Nuc322–331 and Nuc-specific cells. (C) Cluster B1 cells, to which most cells responding to Nuc322–331, Nuc, and Spike stimulation CD8+ T cells belong, are characterized by high expression levels of the cytolytic markers granzyme B and CD107a and the cytokines IFN-γ and TNF-α. (D) The subpopulations of cluster B1 cells expressing higher levels of effector cytokines and cytolytic molecules decrease over the course of convalescence. Shown are histogram plots depicting cluster B1 cells colored according to time point. Although all the cells shown belong to cluster B1, those from the later time points expressed lower levels of granzyme B, CD107a, IFN-γ, and TNF-α.

Update of

References

    1. Robbiani DF, Gaebler C, Muecksch F, Lorenzi JCC, Wang Z, Cho A, Agudelo M, Barnes CO, Gazumyan A, Finkin S, et al. 2020. Convergent antibody responses to SARS-CoV-2 in convalescent individuals. Nature 584: 437–442. - PMC - PubMed
    1. Gudbjartsson DF, Norddahl GL, Melsted P, Gunnarsdottir K, Holm H, Eythorsson E, Arnthorsson AO, Helgason D, Bjarnadottir K, Ingvarsson RF, et al. 2020. Humoral immune response to SARS-CoV-2 in Iceland. N. Engl. J. Med 383: 1724–1734. - PMC - PubMed
    1. Gaebler C, Wang Z, Lorenzi JCC, Muecksch F, Finkin S, Tokuyama M, Cho A, Jankovic M, Schaefer-Babajew D, Oliveira TY, et al. 2021. Evolution of antibody immunity to SARS-CoV-2. Nature 591: 639–644. - PMC - PubMed
    1. Dan JM, Mateus J, Kato Y, Hastie KM, Yu ED, Faliti CE, Grifoni A, Ramirez SI, Haupt S, Frazier A, et al. 2021. Immunological memory to SARS-CoV-2 assessed for up to 8 months after infection. Science 371: eabf4063. - PMC - PubMed
    1. Neidleman J, Luo X, Frouard J, Xie G, Gill G, Stein ES, McGregor M, Ma T, George AF, Kosters A, et al. 2020. SARS-CoV-2-specific T cells exhibit phenotypic features of helper function, lack of terminal differentiation, and high proliferation potential. Cell Rep. Med 1: 100081. - PMC - PubMed

Publication types