. 2022 Jan;12(1):172-185.
doi: 10.1158/2159-8290.CD-21-0245. Epub 2021 Aug 13.

Rates and Patterns of Clonal Oncogenic Mutations in the Normal Human Brain

Affiliations

Rates and Patterns of Clonal Oncogenic Mutations in the Normal Human Brain

Javier Ganz et al. Cancer Discov. 2022 Jan.

Abstract

Although oncogenic mutations have been found in nondiseased, proliferative nonneural tissues, their prevalence in the human brain is unknown. Targeted sequencing of genes implicated in brain tumors in 418 samples derived from 110 individuals of varying ages, without tumor diagnoses, detected oncogenic somatic single-nucleotide variants (sSNV) in 5.4% of the brains, including IDH1 R132H. These mutations were largely present in subcortical white matter and enriched in glial cells and, surprisingly, were less common in older individuals. A depletion of high-allele frequency sSNVs representing macroscopic clones with age was replicated by analysis of bulk RNA sequencing data from 1,816 nondiseased brain samples ranging from fetal to old age. We also describe large clonal copy number variants and that sSNVs show mutational signatures resembling those found in gliomas, suggesting that mutational processes of the normal brain drive early glial oncogenesis. This study helps understand the origin and early evolution of brain tumors. SIGNIFICANCE: In the nondiseased brain, clonal oncogenic mutations are enriched in white matter and are less common in older individuals. We revealed early steps in acquiring oncogenic variants, which are essential to understanding brain tumor origins and building new mutational baselines for diagnostics.This article is highlighted in the In This Issue feature, p. 1.


Figures

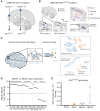
Figure 1. Experimental strategy. General scheme of our methodologic pipeline using targeted sequencing for variant discovery and in silico analyses of large independent cohorts spanning from fetal to older ages (BrainVar and GTEx databases). DNA obtained from 418 samples derived from normal brain and non–brain tissue were analyzed using MIPs, capturing genes associated with brain tumors, pan-cancer, and focal cortical dysplasia. Samples were deep-sequenced, and called variants were validated using Ion Torrent ultra-deep sequencing. Brain samples from BrainVar (n = 166) and GTEx (n = 1,640) databases were analyzed to discover oncogenic variants and to evaluate CNVs, mutational signatures, and aging correlations.
Figure 1.
Experimental strategy. General scheme of our methodologic pipeline using targeted sequencing for variant discovery and in silico analyses of large independent cohorts spanning from fetal to older ages (BrainVar and GTEx databases). DNA obtained from 418 samples derived from normal brain and non–brain tissue were analyzed using MIPs, capturing genes associated with brain tumors, pan-cancer, and focal cortical dysplasia. Samples were deep-sequenced, and called variants were validated using Ion Torrent ultra-deep sequencing. Brain samples from BrainVar (n = 166) and GTEx (n = 1,640) databases were analyzed to discover oncogenic variants and to evaluate CNVs, mutational signatures, and aging correlations.
Figure 2. Nondiseased brains harbor low allele frequency cancer reported mutations. A, Correlation between MIPs and Ion Torrent VAFs of 12 unique variants detected in the normal brain. B, List of validated brain-specific somatic variants showing general information such as variant allele frequency, pathogenicity prediction, and presence in cancer databases. In addition, we describe detected germline variants with functional impact for each individual. N/R, not reported; NSYND3, highest score in predicted pathogenicity; UNCERTAIN, uncertain pathogenicity of variants with clinical significance, CLINSIG. C, Distribution frequency of genes affected by the detected oncogenic variants found in the brain. D, Distribution frequency of the most affected driver genes found in LGG with pathogenicity relevance (Intogen database); black arrows indicate overlap with our discovered genes. E, Number of oncogenic mutations found in CXW (circles, two-tailed Fisher exact test, P = 0.025) as a function of age (years). F, Comparison of the number of pathogenic mutations found in CX (n = 53), CXG (n = 92), and CXW (n = 94) and HC (n = 69); Fisher exact test, CXW versus CXG P = 0.028, HC versus CXG P = 0.182, CXW versus HC P = 0.4.
Figure 2.
Nondiseased brains harbor low allele frequency cancer reported mutations. A, Correlation between MIPs and Ion Torrent VAFs of 12 unique variants detected in the normal brain. B, List of validated brain-specific somatic variants showing general information such as variant allele frequency, pathogenicity prediction, and presence in cancer databases. In addition, we describe detected germline variants with functional impact for each individual. N/R, not reported; NSYND3, highest score in predicted pathogenicity; UNCERTAIN, uncertain pathogenicity of variants with clinical significance, CLINSIG. C, Distribution frequency of genes affected by the detected oncogenic variants found in the brain. D, Distribution frequency of the most affected driver genes found in LGG with pathogenicity relevance (Intogen database); black arrows indicate overlap with our discovered genes. E, Number of oncogenic mutations found in CXW (circles, two-tailed Fisher exact test, P = 0.025) as a function of age (years). F, Comparison of the number of pathogenic mutations found in CX (n = 53), CXG (n = 92), and CXW (n = 94) and HC (n = 69); Fisher exact test, CXW versus CXG P = 0.028, HC versus CXG P = 0.182, CXW versus HC P = 0.4.
Figure 3. Oncogenic mutations are enriched in the white matter and glial cells. A, Schematic illustrating the discovery of the IDH1R132H mutation in the normal PFC of a 17-year-old individual (UMB1465). The mutation was identified in two adjacent WM samples and not present elsewhere, including GM from the same section or GM/WM from the following brain section. White matter is mainly composed of neuronal axons, astrocytes, oligodendrocytes, and OPCs, whereas GM is a combination of neurons with glial cells. B, Illustration of the two focal and distant pathogenic mutations found within the same brain. C, Schematic of nuclear sorting protocol to isolate neuronal (NEUN+) and nonneuronal cells (NEUN−). Nuclei were evaluated using single-cell RNA-seq. t-distributed stochastic neighbor embedding plot of 3,700 NEUN+ nuclei, showing an exclusive presence of excitatory and inhibitory neurons but not glia (top). Evaluation of 1,800 NEUN− nuclei showing the presence of glial cells but not neurons (bottom). D, Fold-change gene expression of NEUN− versus NEUN+ nuclei subdivided by different brain cell types. E, Genotyping of the IDH1R132H mutation by digital droplet PCR (ddPCR). Graph shows the ratio of mutant/wild-type droplets analyzed in different sorted populations (each data point corresponds to 300 sorted nuclei), showing a nominal enrichment in the NEUN− glial fraction. Genomic DNA without the IDH1 R132H mutation was used as a control for the ddPCR reaction (CTRL).
Figure 3.
Oncogenic mutations are enriched in the white matter and glial cells. A, Schematic illustrating the discovery of the IDH1R132H mutation in the normal PFC of a 17-year-old individual (UMB1465). The mutation was identified in two adjacent WM samples and not present elsewhere, including GM from the same section or GM/WM from the following brain section. White matter is mainly composed of neuronal axons, astrocytes, oligodendrocytes, and OPCs, whereas GM is a combination of neurons with glial cells. B, Illustration of the two focal and distant pathogenic mutations found within the same brain. C, Schematic of nuclear sorting protocol to isolate neuronal (NEUN+) and nonneuronal cells (NEUN). Nuclei were evaluated using single-cell RNA-seq. t-distributed stochastic neighbor embedding plot of 3,700 NEUN+ nuclei, showing an exclusive presence of excitatory and inhibitory neurons but not glia (top). Evaluation of 1,800 NEUN nuclei showing the presence of glial cells but not neurons (bottom). D, Fold-change gene expression of NEUN versus NEUN+ nuclei subdivided by different brain cell types. E, Genotyping of the IDH1R132H mutation by digital droplet PCR (ddPCR). Graph shows the ratio of mutant/wild-type droplets analyzed in different sorted populations (each data point corresponds to 300 sorted nuclei), showing a nominal enrichment in the NEUN glial fraction. Genomic DNA without the IDH1 R132H mutation was used as a control for the ddPCR reaction (CTRL).
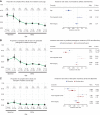
Figure 4. Somatic mutations detectable by RNA-seq do not accumulate with age in the normal brain. Evaluation of somatic mutations using RNA-MuTect in 1,640 GTEx and 166 BrainVar nondiseased brain samples. Suspected RNA editing bases A>G and T>C were removed to reduce false positives as well as variants with VAF >40%. Dot plots showing the proportion of samples with at least one mutation across age and forest plots of the aging incidence rate ratio for all mutations (A), predicted pathogenic and nonpathogenic mutations (B), and disruptive (nonsense, splice site) and nondisruptive mutations (3′ UTR, 5′ UTR, 5′ flank, or nonstop; C). Error bars are the Clopper–Pearson 95% confidence interval of the sample proportion. Forest plots also include standardized RNA integrity score and standardized total mappable read count, with horizontal lines indicating 95% confidence intervals. Incidence rate ratio was estimated using mixed-effects negative binomial model with donor ID as a random effect.
Figure 4.
Somatic mutations detectable by RNA-seq do not accumulate with age in the normal brain. Evaluation of somatic mutations using RNA-MuTect in 1,640 GTEx and 166 BrainVar nondiseased brain samples. Suspected RNA editing bases A>G and T>C were removed to reduce false positives as well as variants with VAF >40%. Dot plots showing the proportion of samples with at least one mutation across age and forest plots of the aging incidence rate ratio for all mutations (A), predicted pathogenic and nonpathogenic mutations (B), and disruptive (nonsense, splice site) and nondisruptive mutations (3′ UTR, 5′ UTR, 5′ flank, or nonstop; C). Error bars are the Clopper–Pearson 95% confidence interval of the sample proportion. Forest plots also include standardized RNA integrity score and standardized total mappable read count, with horizontal lines indicating 95% confidence intervals. Incidence rate ratio was estimated using mixed-effects negative binomial model with donor ID as a random effect.
Figure 5. CNVs are found in the normal brain. Visualization of detected sCNVs in the GTEx and BrainVar databases (A). Color codes indicate different age ranges, brain regions, and types of alteration (gain, loss, or LOH). Upper bar plot summarizes the counts of the different alteration types, and the bar plot on the right side also summarizes the alteration types but sorted by chromosome. Labels along the left y-axis refer to chromosome arms, and the percentages displayed in the right y-axis represent the frequency of events in each chromosome arm. B, Distribution of sCNV events across different ages from prenatal to elder. The number of individuals under each age range is described under the age label. C, Graphic representation of two representative sCNVs and the genes located in that region, one involving the whole chromosome 19 found at 19% clonality and the second involving the q-arm of chromosome 22 found at 24% clonality.
Figure 5.
CNVs are found in the normal brain. Visualization of detected sCNVs in the GTEx and BrainVar databases (A). Color codes indicate different age ranges, brain regions, and types of alteration (gain, loss, or LOH). Upper bar plot summarizes the counts of the different alteration types, and the bar plot on the right side also summarizes the alteration types but sorted by chromosome. Labels along the left y-axis refer to chromosome arms, and the percentages displayed in the right y-axis represent the frequency of events in each chromosome arm. B, Distribution of sCNV events across different ages from prenatal to elder. The number of individuals under each age range is described under the age label. C, Graphic representation of two representative sCNVs and the genes located in that region, one involving the whole chromosome 19 found at 19% clonality and the second involving the q-arm of chromosome 22 found at 24% clonality.
Figure 6. Mutations found in normal brain exhibit signatures present in brain tumors. Mutational signature analysis of normal brain and skin (VAF <15%). Number of mutations evaluated is described next to the tissue label, and graphs show bases substitution, signatures, and spectrum obtained for each tissue. Colored circles next to each signature represent that the signature was observed in cancer (green, brain cancer; purple, skin cancer).
Figure 6.
Mutations found in normal brain exhibit signatures present in brain tumors. Mutational signature analysis of normal brain and skin (VAF <15%). Number of mutations evaluated is described next to the tissue label, and graphs show bases substitution, signatures, and spectrum obtained for each tissue. Colored circles next to each signature represent that the signature was observed in cancer (green, brain cancer; purple, skin cancer).

References

    1. Tomasetti C, Vogelstein B, Parmigiani G. Half or more of the somatic mutations in cancers of self-renewing tissues originate prior to tumor initiation. Proc Natl Acad Sci U S A 2013;110:1999–2004. - PMC - PubMed
    1. Martincorena I, Roshan A, Gerstung M, Ellis P, Van Loo P, McLaren Set al. . Tumor evolution: high burden and pervasive positive selection of somatic mutations in normal human skin. Science 2015;348:880–6. - PMC - PubMed
    1. Genovese G, Kahler AK, Handsaker RE, Lindberg J, Rose SA, Bakhoum SFet al. . Clonal hematopoiesis and blood-cancer risk inferred from blood DNA sequence. N Engl J Med 2014;371:2477–87. - PMC - PubMed
    1. Jaiswal S, Fontanillas P, Flannick J, Manning A, Grauman PV, Mar BGet al. . Age-related clonal hematopoiesis associated with adverse outcomes. N Engl J Med 2014;371:2488–98. - PMC - PubMed
    1. Moore L, Leongamornlert D, Coorens THH, Sanders MA, Ellis P, Dentro SCet al. . The mutational landscape of normal human endometrial epithelium. Nature 2020;580:640–6. - PubMed

Publication types