. 2021 Aug 13;12(1):4911.
doi: 10.1038/s41467-021-24928-6.

A direct interareal feedback-to-feedforward circuit in primate visual cortex

Affiliations

A direct interareal feedback-to-feedforward circuit in primate visual cortex

Caitlin Siu et al. Nat Commun. .

Abstract

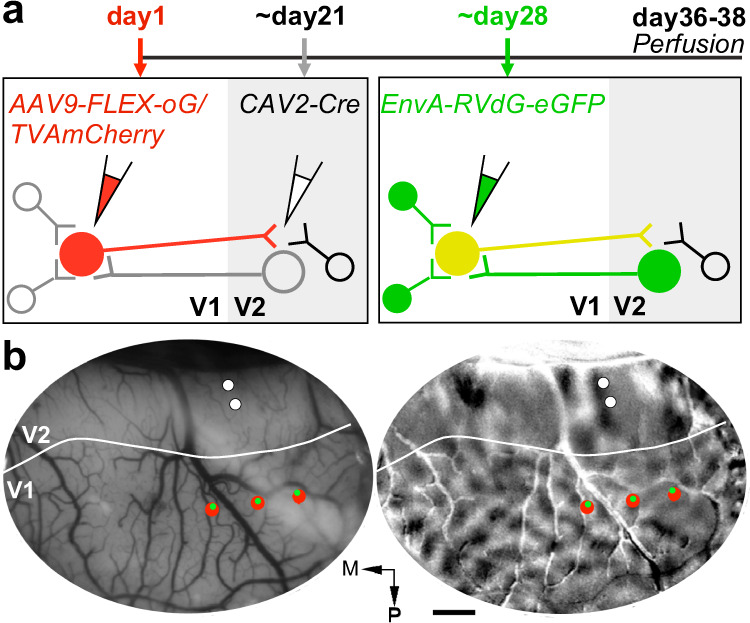
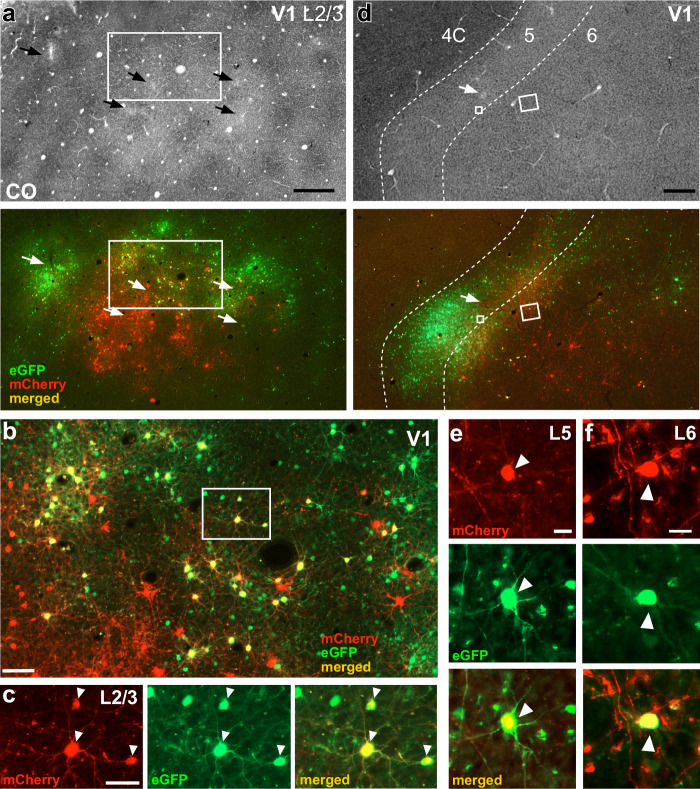
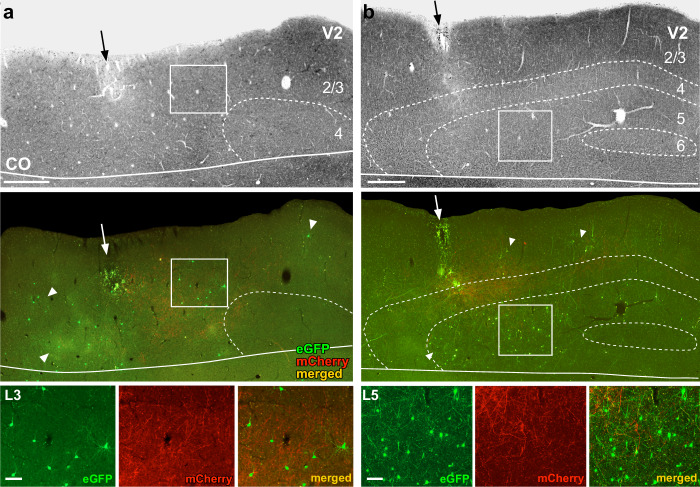
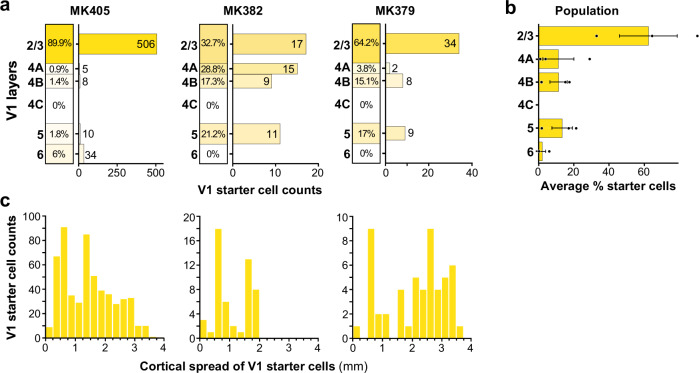
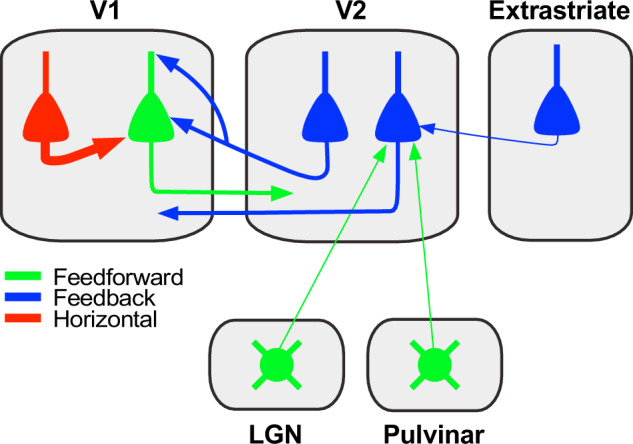
The mammalian sensory neocortex consists of hierarchically organized areas reciprocally connected via feedforward (FF) and feedback (FB) circuits. Several theories of hierarchical computation ascribe the bulk of the computational work of the cortex to looped FF-FB circuits between pairs of cortical areas. However, whether such corticocortical loops exist remains unclear. In higher mammals, individual FF-projection neurons send afferents almost exclusively to a single higher-level area. However, it is unclear whether FB-projection neurons show similar area-specificity, and whether they influence FF-projection neurons directly or indirectly. Using viral-mediated monosynaptic circuit tracing in macaque primary visual cortex (V1), we show that V1 neurons sending FF projections to area V2 receive monosynaptic FB inputs from V2, but not other V1-projecting areas. We also find monosynaptic FB-to-FB neuron contacts as a second motif of FB connectivity. Our results support the existence of FF-FB loops in primate cortex, and suggest that FB can rapidly and selectively influence the activity of incoming FF signals.


Conflict of interest statement

The authors declare no competing interests.

Figures

Fig. 1
Fig. 1. Monosynaptic input tracing in macaque visual cortex: experimental design.
a Viral injection timeline and experimental design. Left: V1→V2 neurons express mCherry (red cells), TVA, and oG, after double infection with AAV9-vectors (injected in V1) and CAV2-Cre (injected in V2). Right: After additional infection with EnvA-RVdG-eGFP (injected at the same V1 sites as AAV9), V1→V2 neurons previously infected with AAV9 additionally express eGFP, becoming double-labeled (yellow starter cells). After trans-synaptic RVdG-eGFP infection, V1 and V2 cells presynaptic to the V1 starter cells express eGFP (green cells). Cells that are not co-infected with both CAV2 and AAV9 remain unlabeled. b Injection plan. In vivo OI of V1 and V2 in one example case (MK405). Left: Image of the cortical surface vasculature encompassing V1 and V2. Solid white contour: V1–V2 border based on the orientation map. The surface vasculature is used as a reference to target viral injections to matching retinotopic positions in V1 and V2. To ensure retinotopic overlap of the V1 and V2 injections, multiple AAV (up to 3) injections (red dots), spaced about 1 mm mediolaterally, are made in V1, and up to 2 CAV2 injections (white dots), spaced about 300 µm anteroposteriorly, are made in V2. RVdG injections (green dots) are targeted to the same locations as the AAV injections, using as guidance images of the surface vasculature taken at the time of the AAV injections. Right: Orientation difference map of V1 and V2 obtained by subtracting responses to achromatic luminance gratings of two orthogonal orientations. Orientation and other functional maps are used to identify the V1/V2 border, so as to target injections to the appropriate areas. For example, in the orientation map, V2 can be distinguished from V1 due to its “stripy” pattern and larger orientation domains. M: Medial; P: posterior. Scale bar: 1 mm. Optical maps in (b) are representative of three independent cases.
Fig. 2
Fig. 2. V1 injection sites.
a Case MK405. Image of a single tangential section through V1 L2/3 stained for CO (Top) after being imaged for mCherry and GFP fluorescence (Bottom). The merged channel shows double-labeled (yellow) “starter” V1→V2 cells. Arrows point to the V1 injection sites in both sections. The region inside the white box is shown at higher magnification in panel (b). Scale bar: 500 µm. b Higher magnification of the V1 region inside the box in panel (a). Red cells: V1→V2 neurons co-infected with CAV2 and AAV9-TVAmCherry, but not with RVdG. Yellow cells: starter V1→V2 cells double-labeled due to triple infection with CAV2-Cre, AAV9-TVAmCherry, and RVdG-GFP. Of these double-labeled cells only those that were additionally infected by AAV9-oG act as “starter” cells. Green cells: cells sending monosynaptic input to the starter V1→V2 cells (but some local V1 green label is due to TVA “leak”—see Results and Supplementary Fig. 2). Scale bar: 100 µm. Cells in the boxed region are shown at higher magnification in panel (c). c Higher magnification of 3 double-labeled V1→V2 cells (arrowheads) shown under mCherry (Left) or GFP fluorescence (Middle), and merged (Right). Scale bar: 50 µm. d Image of a single tangential section through V1 L4C-6 stained for CO (Top) and imaged for fluorescent signals (Bottom) in the same case as in (ac). Yellow cells inside the small and large white boxes are shown at higher magnification in panels (e) and (f), respectively. Dashed contours delineate layer boundaries, and layers are indicated at the top. Scale bar: 500 µm. e, f V1→V2 starter cells (arrowheads) in L5 (e) and L6 (f), shown under mCherry (Top) or GFP (Middle) fluorescence, and merged (Bottom). Scale bars: 20 µm. Results in (af) are representative of injection sites made in three independent cases with similar results.
Fig. 3
Fig. 3. V2 injection sites and resulting GFP-label in V2. Case MK405.
a Image of a tangential section through V2 L1–4 stained for CO (Top) after being imaged for mCherry and GFP fluorescence (Middle). The middle panel shows the merged fluorescent channels. Arrows: V2 injection sites; white arrowheads point at some GFP-labeled input neurons. Red fibers are the terminals of V1→V2 neurons in L3–4. Solid white contour: V1/V2 border (V1 is below the border). The region inside the white box is shown at higher magnification in the bottom panel. Other conventions as in Fig. 2. Bottom: higher magnification of GFP-labeled V2 input cells in L3, shown under GFP or mCherry fluorescence, and merged, as indicated. Scale bar: 100 µm. b Same as in panel (a), but for a tangential section through V2 L1–6 showing denser GFP label in L5. Scale bars in (a, b): 500 µm (Top, Middle), 100 µm (Bottom). Supplementary Fig. 1 shows additional images illustrating the distribution of the GFP label across V2 layers. Results in (a, b) are representative of injection sites made in three independent cases with similar results.
Fig. 4
Fig. 4. Laminar and tangential distribution of double-labeled “starter” cells in V1.
a For each of the three cases, we show the percentage (left column) and the number (right bar graph) of V1→V2 double-labeled cells across V1 layers. b Average percent of double-labeled cells across V1 layers for the population (n = 668 cells in 3 independent animals). Error bars: s.e.m. c Distribution of double-labeled V1 cells across the tangential domain of V1, collapsed across layers, for each case. Zero represents the location of the most medial double-labeled cell and the bin with the largest number represents the most lateral location of double-labeled cells.
Fig. 5
Fig. 5. Laminar and tangential distribution of monosynaptic V2 FB inputs to V1→V2 cells.
a Percent and number of GFP-labeled cells across V2 layers for each of the three cases. b Population average percent ± s.e.m. of GFP-labeled cells across V2 layers (n = 2090 cells in three independent animals). c Distribution of GFP-labeled cells across the tangential domain of V2 pooled across layers. Other conventions as in Fig. 4. d Population average ratio of V2 input cells in each layer to the total number of V1→V2 starter cells (pooled across layers; n = 3 independent animals). Error bars: s.e.m.
Fig. 6
Fig. 6. Case MK379: FB inputs from the higher extrastriate cortex.
a Image of a sagittal section through the extrastriate cortex encompassing the anterior bank of the lunate sulcus (LS), the prelunate gyrus, and the banks of the superior temporal sulcus (STS), stained for myelin using the Gallyas method to reveal areal borders (solid black lines). P: posterior; V: ventral. b Higher magnification of the MT region inside the black box in (a) in an adjacent section imaged for GFP and mCherry fluorescence and merged. A single GFP-labeled pyramidal cell is visible in L5 (inside the white box) and shown at higher magnification in (e). c Same as in (a) but for a different section. d Higher magnification of the V3d/V3A region inside the white box in (c) viewed under fluorescence. A single GFP-labeled cell is visible in L6 of dorsal V3 (V3d) (inside the white box) and shown at higher magnification in (f). e, f GFP-labeled cells in MT L5 and V3d L6, respectively. Scale bars: 1 mm (ac), 250 µm (b, d), 20 µm (e, f). g Number of GFP-labeled cells in higher extrastriate areas.
Fig. 7
Fig. 7. Laminar and tangential distribution of long-range V1 inputs.
a Case MK405. Image of a single tangential section through V1 L2/3–4C stained for CO (Left) after being imaged for mCherry and GFP fluorescence (Right). The merged channel shows plenty of GFP-labeled V1 input cells (green) in L2/3, 4A–4C away from the injection sites (arrows). The locations of the injection sites were determined in more superficial sections where the CO discoloration was more visible than in the indicated section. The region inside the boxes is shown at higher magnification in (b, c). Other conventions are as in Fig. 2. Scale bar: 500 µm. b, c GFP-labeled V1 input cells in L2/3 (b) and L4B (c), shown under GFP (Left) or mCherry (Middle) fluorescence, and merged (Right). Scale bars: 50 µm. Results in (ac) are representative of the V1 GFP label in three independent TRIO experiments. d Percent and number of long-range V1 input cells across layers for each of the three cases. e Average percent ± s.e.m. of V1 input cells across V1 layers for the population. f Tangential spread of V1 input cells for each case (GFP-labeled cells within 400 µm of each V1 injection site were omitted from the counts). g Average percent of cortical inputs arising from V2 vs. V1 for the population (n = 20,369 cells in 3 independent animals). Error bars: s.e.m. Results in (ac) are representative of injection sites made in three independent cases with similar results.
Fig. 8
Fig. 8. Thalamic input cells.
a Case MK379. Image of a single parasagittal section through the LGN viewed under GFP fluorescence (Left), stained for fluorescent Nissl (Middle Left), immunostained for Calbindin-Alexa647 (Middle Right), and with all three channels merged (Right). The GFP-labeled cells inside the top and bottom white boxes are shown at higher magnification in (b, c), respectively. The parvocellular (P3–6) and magnocellular (M1–2) LGN layers are labeled. A: anterior; V: ventral. Scale bar: 250 µm. b, c GFP-labeled LGN input cells in the P3 (b) and M1 (c) layers are shown in the same three channels as the top panels and with all channels merged (Right). White arrowheads point to the location of GFP-labeled neurons, yellow arrowheads point to calbindin-positive cells. The GFP-labeled cells are not calbindin-positive. Scale bars: 50 µm. d Image of a sagittal section through the LGN and pulvinar, with all three fluorescent channels (GFP, calbindin, and Nissl) merged. The cells inside the white box are shown at higher magnification in (e). PL lateral pulvinar, PI inferior pulvinar, LV lateral ventricle. Scale bar: 1 mm. e A GFP-labeled input cell (white arrowhead) in the PL imaged under the same three channels as for the LGN cells and with all channels merged (Bottom Right). A yellow arrowhead in each panel points to the location of a calbindin-positive cell (red). The GFP-labeled cell is not calbindin-positive. Scale bar: 50 µm. f Number of GFP-labeled cells in the thalamic nuclei. g Number of GFP-labeled cells in the LGN layers.
Fig. 9
Fig. 9. Summary circuit model. Schematics of the FB circuit motifs were discovered in this study.
Triangles: pyramidal cell somata; circles: thalamic cell somata; arrows: axonal projections (thickness indicates projection magnitude). All axonal projections in this scheme are excitatory and terminate onto excitatory cells. Some V2 FB neurons (left V2 blue cell) make monosynaptic contacts with V1 neurons projecting to V2 (green pyramidal cell). The latter receive the majority of their long-range cortical inputs from other pyramidal neurons within V1 (red cell). Some V2 neurons in L5 (right V2 blue cell) sending FB to V1 receive monosynaptic inputs from FB neurons in higher extrastriate areas (blue cell in the extrastriate cortex), as well as sparse inputs from the LGN and lateral pulvinar (round green cells).

Similar articles

Cited by

References

    1. Van Essen DC, Maunsell JHR. Hierarchical organization and functional streams in the visual cortex. Trends Neurosci. 1983;6:370–375. doi: 10.1016/0166-2236(83)90167-4. - DOI
    1. Markov NT, Kennedy H. The importance of being hierarchical. Curr. Opin. Neurobiol. 2013;23:187–194. doi: 10.1016/j.conb.2012.12.008. - DOI - PubMed
    1. Ungerleider, L. G. & Mishkin, M. Two cortical visual systems. in Advances in the Analysis of Visual Behavior (eds Ingle, D. J., Mansfield, J. W., Goodale, M. A.). (MIT Press, 1982).
    1. Nassi JJ, Callaway EM. Parallel processing strategies of the primate visual system. Nat. Rev. Neurosci. 2009;10:360–372. doi: 10.1038/nrn2619. - DOI - PMC - PubMed
    1. Hubel DH, Wiesel TN. Receptive fields, binocular interaction and functional architecture in the cat’s visual cortex. J. Physiol. 1962;160:106–154. doi: 10.1113/jphysiol.1962.sp006837. - DOI - PMC - PubMed

Publication types