. 2021 Aug 13;12(1):4920.
doi: 10.1038/s41467-021-25173-7.

The pathogenesis of mesothelioma is driven by a dysregulated translatome

Affiliations

The pathogenesis of mesothelioma is driven by a dysregulated translatome

Stefano Grosso et al. Nat Commun. .

Abstract

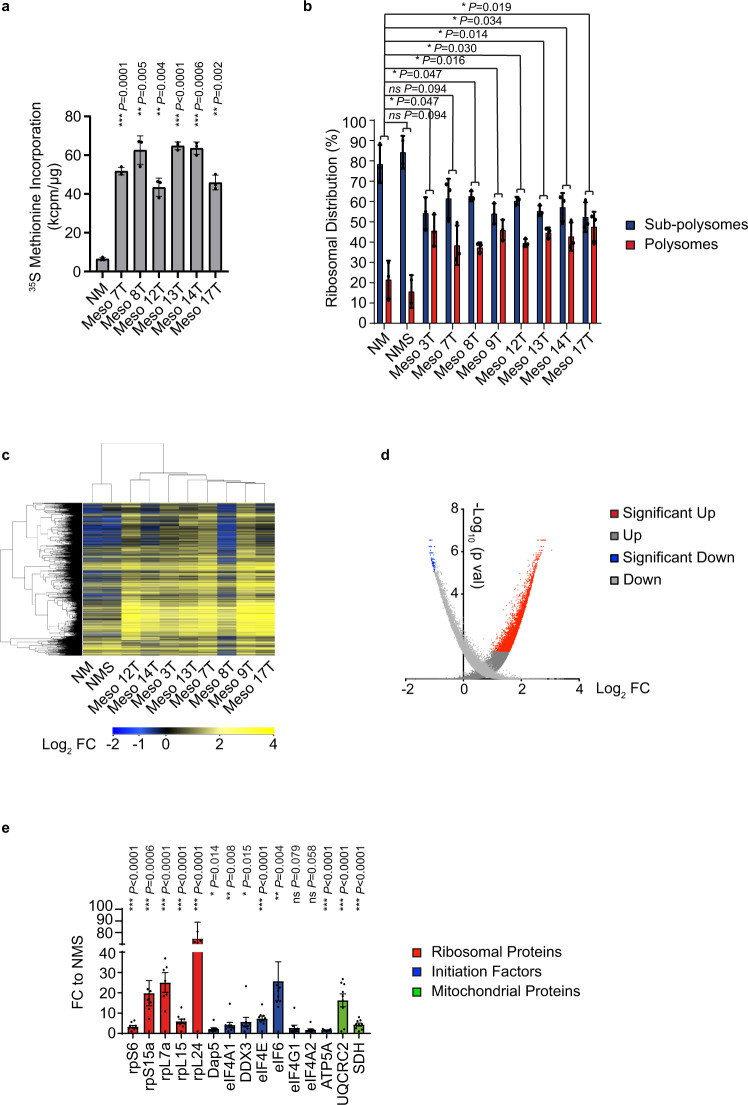
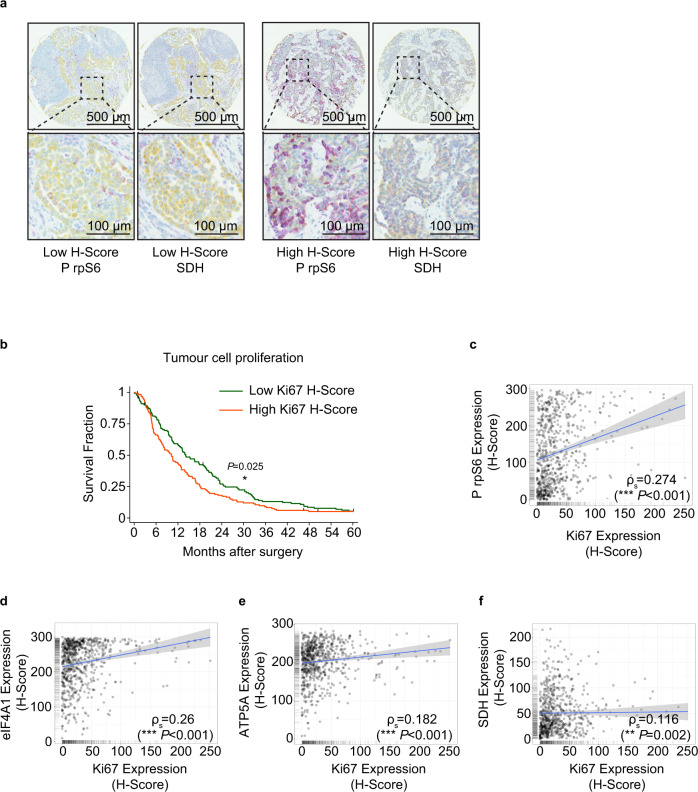
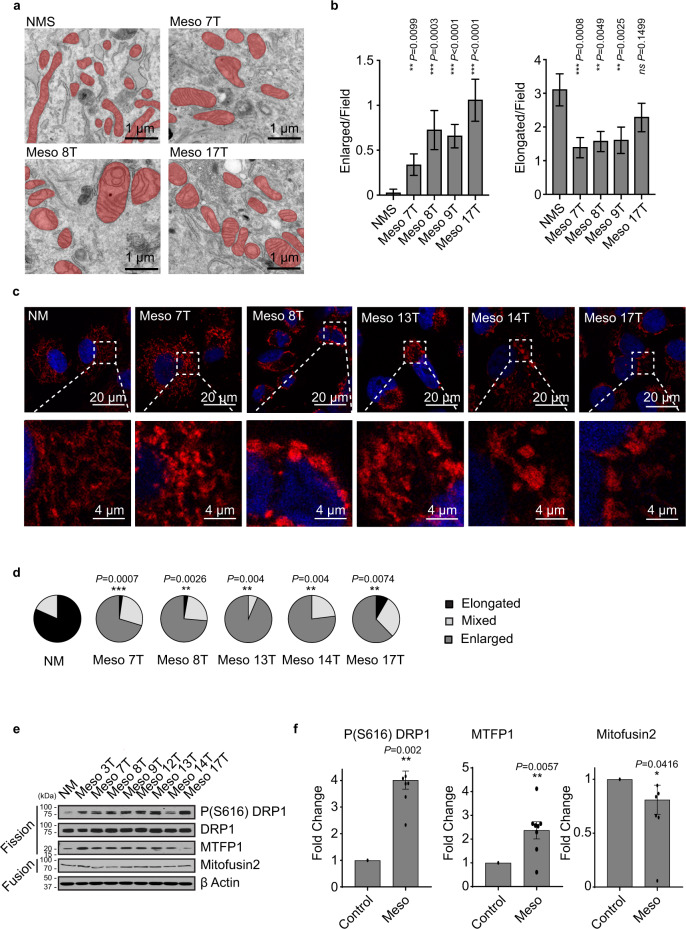
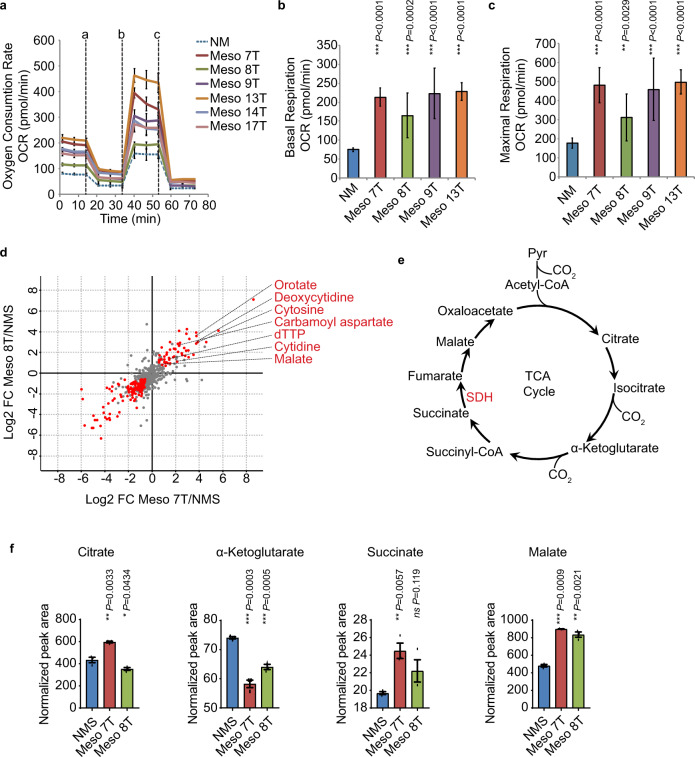
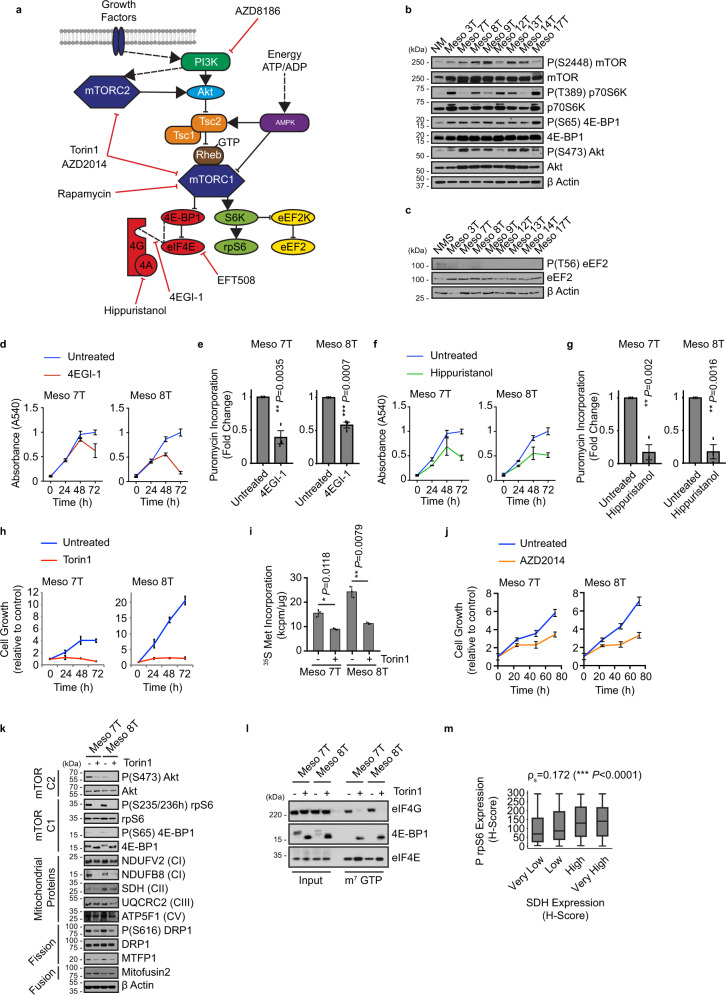
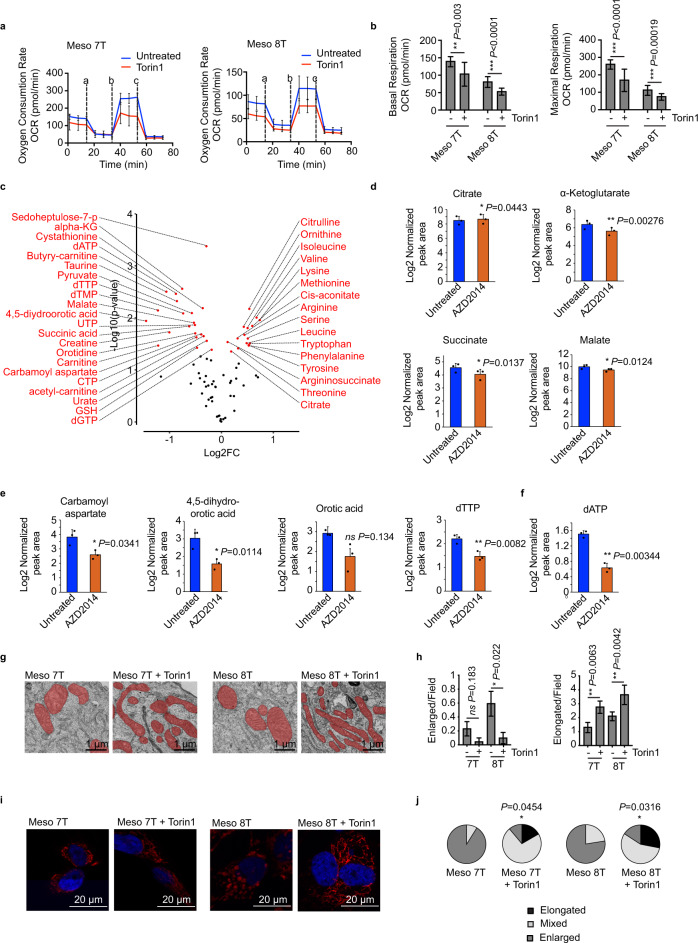
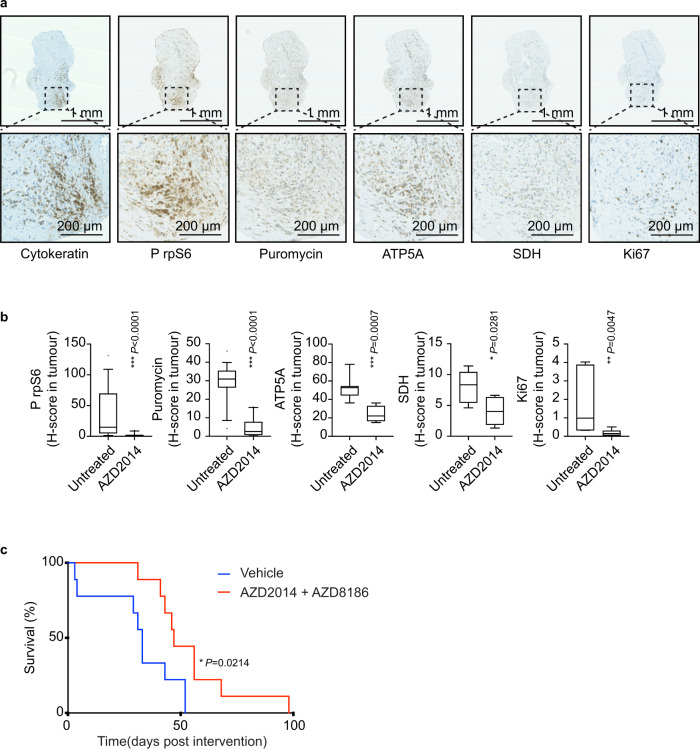
Malignant mesothelioma (MpM) is an aggressive, invariably fatal tumour that is causally linked with asbestos exposure. The disease primarily results from loss of tumour suppressor gene function and there are no 'druggable' driver oncogenes associated with MpM. To identify opportunities for management of this disease we have carried out polysome profiling to define the MpM translatome. We show that in MpM there is a selective increase in the translation of mRNAs encoding proteins required for ribosome assembly and mitochondrial biogenesis. This results in an enhanced rate of mRNA translation, abnormal mitochondrial morphology and oxygen consumption, and a reprogramming of metabolic outputs. These alterations delimit the cellular capacity for protein biosynthesis, accelerate growth and drive disease progression. Importantly, we show that inhibition of mRNA translation, particularly through combined pharmacological targeting of mTORC1 and 2, reverses these changes and inhibits malignant cell growth in vitro and in ex-vivo tumour tissue from patients with end-stage disease. Critically, we show that these pharmacological interventions prolong survival in animal models of asbestos-induced mesothelioma, providing the basis for a targeted, viable therapeutic option for patients with this incurable disease.


Conflict of interest statement

The authors declare no competing interests with the exception of the Murphy lab, which currently receives funding from Puma Biotechnology and the Merck Group for work unrelated to this manuscript.

Figures

Fig. 1
Fig. 1. Aberrant translational regulation increases the synthesis of ribosomal proteins, protein synthesis machinery and mitochondrial components.
a To assess protein synthesis rates, healthy mesothelial cells (NM) and primary MpM-derived cell lines were incubated with 35 S methionine and the rate of incorporation over a 30 min period was assessed. Error bars represent standard deviation and the measure of the centre of the error bars is the mean (n = 3, where n = number of biological repeats of 35 S methionine incorporation experiment) and significance was assessed using two-sided unpaired student’s t test with multiple comparisons, p values are shown on the bar graphs. b Polysome profiles of either healthy mesothelial cells (NM and NMS) or MpM-derived cell lines were obtained (n = 3, representative profile shown in Supplementary Fig. 1B, where n = number of biological repeats of the polysome profile experiment) and the area attributed to the subpolysomes (blue; subpolysomes fraction contains the 40 S, 60 S SUs and 80 S ribosomes and are generally not associated with translating mRNAs) or polysomes (red, polysomes are associated with translating mRNAs) calculated. Error bars represent standard deviation and the measure of the centre of the error bars is the mean (n = 3). Significance was assessed using a two-sided unpaired student’s t test with multiple comparisons, p values are shown on the bar graphs. c Polysome profiling was carried out using eight primary tumour cell lines and two controls with three biological repeats of each tumour cell or control cells used. Translation efficiency pattern and hierarchical clustering of control (NM–cells from a single donor and NMS–pool from four donors) and eight primary mesothelioma cell lines (n = 3 in each case). The heatmap displays the polysomal association of the most variable transcripts across the samples (fold change >2 compared with NM control). The legend bar shows the colour code for the normalised log intensity values. The hierarchical clustering shows the measure of the Pearson Correlation distance. d Volcano plot representing in red the mRNAs with the significant polysomal association and in blue a minority of downregulated transcripts. Polysome profiling array was analysed by RankProd, which generates two lists: the UP list (dark grey) contains every gene, their FC and their probability of being truly upregulated, and the DOWN list (light grey), with every gene, their FC and their probability of being truly downregulated. Each gene was included twice. Specifically, one arm of the plot includes all the genes with their probability of being UP, and the other arm of the plot includes all the genes and their probability of being DOWN regulated. e Densitometric analysis of the western blots in Supplementary Figs. 2C–E. Protein levels in MpM-derived cell lines are compared with NMS control cells. Error bars represent standard deviation and the measure of the centre of the error bars is the mean (n = 8 independent biological repeats) and significance was assessed using unpaired two-sided student’s t test adjusted for multiple comparisons, p values are shown on the bar graphs. Ribosomal factors are shown in the red bars, initiation factors in blue and mitochondrial proteins in green.
Fig. 2
Fig. 2. Protein synthesis and mitochondrial protein expression correlate with poor survival in patient-derived material.
a Representative section of tissue microarray (TMA) probed with antibodies against phospho-Ser240/244 rpS6 (magenta) and SDH (magenta). Tumour areas within the TMA cores were identified by cytokeratin staining (yellow). Visiopharm® software was used to quantify the magenta staining in the tumour area. b Kaplan–Meier plot, showing Ki67 staining is a strong predictor of survival. The 272 patients included in the TMAs, were split into two equally sized groups according to Ki67 H-score. A log-rank test was performed to determine the significance of differences in survival (*p = 0.025). c Scatter plot of the H-scores of rpS6 phosphorylation (mTOR activity) and Ki67 expression in mesothelioma TMAs. Linear regression analysis was performed by Spearman’s rank correlation, the coefficient was 0.274. The linear regression fit is depicted with a blue line. The grey band shown is the 95% confidence interval. d Scatter plot of the H-scores of eIF4A1 expression and Ki67 expression in mesothelioma TMAs. Linear regression analysis was performed by Spearman’s rank correlation, the coefficient was 0.26. The linear regression fit is depicted with a blue line. The grey band shown is the 95% confidence interval. e Scatter plot of the H-scores of mitochondrial ATP5A expression and Ki67 expression in mesothelioma TMAs. Linear regression analysis was performed by Spearman’s rank correlation, the coefficient was 0.182. The linear regression fit is depicted with a blue line. The grey band shown is the 95% confidence interval. f Scatter plot of the H-scores of mitochondrial SDH expression and Ki67 expression in mesothelioma TMAs. Linear regression analysis was performed by Spearman’s rank correlation, the coefficient was 0.116. The linear regression fit is depicted with a blue line. The grey band shown is the 95% confidence interval.
Fig. 3
Fig. 3. Aberrant synthesis of mitochondrial components and alterations in phosphorylation of fission proteins changes mitochondrial morphology and function.
a Representative electron micrographs of primary MpM cell lines (Meso 7 T, Meso 8 T, Meso17T) and control cells (NMS). Scale bar 1 μm. b The average number of enlarged particles per field. In all, 19–23 different micrographs (for n = 369 mitochondrial particles) were analysed per sample. Error bars represent SD and significance was assessed using Mann–Whitney test, p values are shown on the bar graphs. The average number of elongated particles per field. In all, 19–23 different micrographs (n = 369 mitochondrial particles) were analysed per sample. Error bars represent SEM and the measure of the centre of the error bars is the mean, significance was assessed using Mann–Whitney test p values are shown above the bars. c Confocal images of primary MpM cells or healthy mesothelial control, stained with DAPI (blue-nuclei) and ATPB (red-mitochondria). Scale bar 20 μm or 4 μM for the call outs. d The mitochondrial networks in the samples from c were assessed in terms of the extent of elongated, mixed or enlarged/fragmented mitochondria and the data represented as pie charts, (black sections = elongated, light grey sections = mixed and dark grey = enlarged). The significance of changes in the elongated mitochondrial network was assessed using two-sided unpaired Student’s t test NM vs tumour cell lines. P values are shown above the pie charts. e Western blot analysis of eight primary cell lines derived from patients with MpM and from untransformed mesothelium (NM), which were probed with antibodies against phospho-Ser616 DRP, DRP1, MTPF1 and Mitofusin2. Beta-actin was used as a sample integrity control. Source data are provided as a Source Data file. f Densitometric analysis of the western blots in data shown in Fig. 2e. Protein levels in MpM-derived cell lines are compared to NM control cells. Error bars represent standard deviation, and the measure of the centre of the error bars is the mean (n = 8 biological repeats). Significance was assessed using a two-sided unpaired student’s t test with multiple comparisons, p values are shown on the bar graphs.
Fig. 4
Fig. 4. Metabolic changes in MpM-derived cells.
a The oxygen consumption rate (OCR) of primary MpM and NM control cells was measured in the seahorse extracellular flux assay. The vertical dashed lines indicate when oligomycin (a), FCCP (b) and rotenone + antimycin A (c) were injected. Error bars represent standard deviation and the measure of the centre of the error bars is the mean (n = 6 where n = number of independent biological repeats of the oxygen consumption rate experiments). b The basal respiration of primary MpM and NM control cells was measured as the OCR value before oligomycin injection. Error bars represent standard deviation and the measure of the centre of the error bars is the mean. Significance was assessed using a two-tailed unpaired Student’s t test adjusted for multiple comparisons (n = 6 where n = number of independent biological repeats of the basal respiration rate measurements, p values are shown on the bar graphs). c The maximal respiration of primary MpM and NM control cells was measured as the highest OCR value after FCCP injection. Error bars represent standard deviation and the centre of the error bars is the mean. Significance was assessed using unpaired two-sided student’s t test adjusted for multiple comparisons (n = 6, n = number of biological repeats of maximal respiration rate measurements, p values are shown on the bar graphs). d Cell extracts were prepared from Meso 7 T, Meso 8 T and NMS cells and analysed by LC-MS/MS. Untargeted data analysis revealed increased intracellular abundance of malate, various intermediates of de novo pyrimidine synthesis, and derivatives of pyrimidine nucleotides in mesothelioma cells. Red dots indicate metabolites for which intracellular abundance was altered significantly and coherently in both cell lines compared with NMS cells (absolute log2 fold change ≥0.58; adjusted p value < 0.05 (Benjamini–Hochberg), ANOVA). e Schematic to show the TCA cycle. f Data analysis was performed to determine the intracellular abundance of citrate, α-ketoglutarate, succinate and malate. Data represent the mean ± SD obtained and the centre of the error bars represents the mean. Significance was assessed using two-sided unpaired two-sided student’s t test adjusted for multiple comparisons, p values are shown on the bar graphs. NMS = normal mesothelial cells, blue bars, Meso 7 T is red bars and Meso 8 T are the green bars.
Fig. 5
Fig. 5. Aberrant signalling through mTOR correlates with increased protein synthesis in MpM.
a Schematic summary showing mTORC1 and mTORC2 signalling pathways upstream of protein synthesis regulation. b Western blot analysis of eight primary cell lines derived from patients with MpM and from untransformed mesothelium (NM), which were probed with antibodies against Akt and phosphorylated Akt, as a marker for mTORC2 activity, and 4EBP1 and phosphorylated 4EBP1, p70S6K and phosphorylated p70S6K, as a marker for mTORC1 activity. Actin was used as a sample integrity control. Source data are provided as a Source Data file. Experiments were repeated on three occasions and similar data were obtained in each case. c Western blot analysis of eight cell lines derived from patients with MpM and from a pool of untransformed mesothelium (NMS), which were probed with antibodies against eEF2 and phosphorylated eEF2. Beta-actin was used as a sample integrity control. Experiments were repeated on three occasions. d Primary MpM cells (Meso 7 T or Meso 8 T) were treated with 25 μM 4EGI-1 and the rate of cell growth was assessed over a 72 h time period with a crystal violet assay. Error bars represent standard deviation, the centre of the error bars is the mean (n = 4 where n = number of biological repeats of growth rate measurements as determined by change in absorbance). Blueline is untreated, red line treated with 25 μM 4EGI-1. e Primary MpM cells (Meso 7 T or Meso 8 T) were treated with 25 μM 4EGI-1. Puromycin incorporation from n = 3 independent experiments (representative in Supplementary Fig. 7 A). Error bars represent standard deviation and significance was assessed using unpaired Student’s t test, p values are shown on the bar graphs. f Primary MpM cells (Meso 7 T or Meso 8 T) were treated with 100 nM Hippuristanol and the rate of cell growth was assessed over a 72 h time period with a crystal violet assay. Error bars represent standard deviation and the centre of the error bars represents the mean (n = 4 where n = number of biological repeats of growth rate measurements). Blueline is untreated, red line treated with 100 nM Hippuristanol. g Primary MpM cells (Meso 7 T or Meso 8 T) were treated with 100 nM Hippuristanol. Puromycin incorporation from n = 3 independent experiments (representative in Supplementary Fig. 7 C). Error bars represent standard deviation and the centre of the error bars represents the mean. Significance was assessed using two-sided unpaired Student’s t test adjusted for multiple comparisons, p values are shown on the bar graphs. h Primary MpM cells (Meso 7 T or Meso 8 T) were treated with 100 nM Torin 1 and the rate of cell growth was assessed over a 72 h time period with a crystal violet assay. Error bars represent standard deviation, with the centre of the error bar the mean (n = 3, n = number of independent biological repeats of growth rate measurements). Blueline is untreated, red line treated with 100 nM Torin 1. i To assess protein synthesis rates, primary MpM-derived cell lines Meso 7 T and Meso 8 T were incubated with 100 nM Torin 1 for 30 m, followed by 33 μCi of 35 S methionine and the rate of incorporation over a 30 m period was assessed. Error bars represent standard deviation and the centre of the error bars represents the mean. (n = 3) and where n = number of independent biological repeats. Significance was assessed using a two-sided unpaired Student’s t test adjusted for multiple comparisons, p values are shown on the bar graphs. j Primary MpM cells (Meso 7 T or Meso 8 T) were treated with 100 nM AZD2014 and the rate of cell growth was assessed over a 72 h time period with a crystal violet assay. Error bars represent standard deviation, the centre of the error bars represents the mean (n = 8, n = number of independent biological repeats of growth rate measurements). Blueline is untreated, red line treated with 100 nM AZD2014. k Western blot analysis of primary MpM cell lines (Meso 7 T and Meso 8 T) treated with 100 nM Torin 1 for 24 h and probed with antibodies to assess changes in mTOR pathway, mitochondrial protein expression and mitochondrial dynamics. Actin was used as a sample integrity control. l m7GTP pull-down assay was performed on primary MpM cell lines (Meso 7 T and Meso 8 T), which were treated with 100 nM Torin 1 for 30 m. Input extracts and cap analogue pull-downs were probed with antibodies against eIF4G and 4EBP1. eIF4E was used as an input and pull-down control. Experiments were repeated on three occasions. m Correlation analysis between rpS6 phosphorylation (mTOR activity) and SDH expression in mesothelioma TMAs. Of the n = 812 individual TMA cores, 723 (89.04%) had a Phosho rpS6 H-score and 734 (90.39%) had an SDH H-score. SDH H-score was split into four equally sized groups and Spearman’s correlation analysis was performed for Phospho pS6 H-score against these groups. From n = 689 cores which had both a pS6 and SDH H-score, Spearman’s correlation coefficient was 0.172. The box plots show the box from the first quartile to the third quartile. The middle line represents the median. The whiskers go up to the maximum and minimum values.
Fig. 6
Fig. 6. TORC1 and 2 inhibition reverse metabolic effects.
a Primary MpM cells Meso 7 T and Meso 8 T were treated with 100 nM Torin1 or left untreated for 18–20 h. The oxygen consumption rate (OCR) was measured in the SeaHorse extracellular flux assay. The vertical dashed lines indicate when oligomycin (a), FCCP (b) and rotenone + antimycin A (c) were injected. Error bars represent standard deviation, the centre of the error bar is the mean (n = 6 independent biological repeats). b The basal respiration from A was measured as the OCR value before oligomycin injection. The maximal respiration from A was measured as the highest OCR value after FCCP injection. Error bars represent standard deviation and the centre of the error bar is the mean. Significance was assessed using two-sided unpaired student’s t test adjusted for multiple comparisons, n = 6 independent biological repeats. P values are shown on the bar graph. c Cell extracts were prepared from Meso 8 T cells treated with vehicle or 100 nM AZD2014 for 24 h to inhibit mTORC1 and mTORC2, and analysed for metabolites representing multiple metabolic pathways. Volcano plot showing changes in intracellular metabolite abundance upon treatment with AZD2014. Red dots indicate metabolites for which intracellular abundance was altered significantly. Three biological experiments, each with three technical replicates absolute log2 fold change ≥0.58; two-sided paired t test was used with Benjamini–Hochberg correction to log2 transformed and centred data using R. d Intracellular abundance of TCA cycle metabolites: citrate, α-ketoglutarate, succinate, malate. Data represent the mean ± SD obtained from three biological experiments, each with three technical replicates. Significance was assessed using a two-sided Student’s t test with Benjamini–Hochberg correction, p values are shown on the graph. Blue bars untreated, red bars treated with 100 nM AZD2014. e Intracellular abundance of pyrimidine synthesis intermediates: carbamoyl aspartate, dihydroorotate, orotate, dTTP. Data represent the mean ± SD obtained from three biological experiments, each with three technical replicates. Significance was determined using two-sided Student’s t with Benjamini–Hochberg correction, p values are shown on the graph. Blue bars untreated, red bars treated with 100 nM AZD2014. f Intracellular abundance of dATP. Data represent the mean ± SD obtained from three biological experiments, each with three technical replicates. Significance was assessed using paired two-sided student’s t test with Benjamini–Hochberg correction, p values are shown on the graphs. g Electron micrographs of primary MpM cell lines (Meso 7 T and Meso 8 T) treated with 100 nM Torin 1 for 48 h. Scale bar 1 μm. h Enlarged and elongated mitochondria per field in G were calculated. In all, 19–23 different micrographs (for 369 mitochondrial particles) were analysed per sample. Error bars represent SEM and significance was assessed using a Mann–Whitney test, p values are shown. i Confocal images of primary MpM cells Meso 7 T and Meso 8 T treated with 100 nM Torin 1 for 24 h or left untreated, stained with DAPI (blue-nuclei) and ATPB (red-mitochondria). Scale bar 20 μm. Experiments were repeated on three independent occasions. j The mitochondrial networks in the samples from i were assessed in terms of the extent of elongated, mixed or enlarged/fragmented mitochondria and the data represented as pie charts, (black sections = elongated, light grey sections = mixed and dark grey = enlarged). The significance of changes in the elongated mitochondrial network was assessed using an unpaired two-sided student’s t test adjusted for multiple comparisons. Untreated vs Torin 1, p values are shown on the bar graphs.
Fig. 7
Fig. 7. mTORC1 and 2 inactivation inhibits tumour cell growth ex vivo and in mouse models of MpM.
a Representative sections of mesothelioma explants stained with the indicated antibody. Cytokeratin staining was used to identify tumour areas within the explants. Scale bar 1 μm, 200 μm for the call outs. b Mesothelioma explants were cultured for 72 h with 100 nM AZD2014 or with vehicle. H-score quantification of IHC staining within tumour areas is performed by Visiopharm® software. Mann–Witney significance test was performed (two patients, n = 8 explants, each p values are shown on the graph). The box plots show the box from the first quartile to the third quartile. The middle line represents the median. The whiskers go up to the maximum and minimum values. c Adult mice (Cdkn2a−/−;Nf2fl/fl;Tp53fl/fl) were intrapleurally injected with 107 pfu Lenti-Cre, followed after 10 days by a single intrapleural injection of 25 μg of long fibre amosite asbestos and allowed to age for a further 50 days. The mice were treated with AZD2014 + AZD8186 (n = 9 mice) or vehicle control (n = 9 mice), from d60 post-viral induction of floxed alleles. Graph shows survival from the first day of treatment (Mantel–Cox log-rank test).

Similar articles

Cited by

References

    1. Darnton A, Hodgson J, Benson P, Coggon D. Mortality from asbestosis and mesothelioma in Britain by birth cohort. Occup. Med. (Lond.) 2012;62:549–552. doi: 10.1093/occmed/kqs119. - DOI - PMC - PubMed
    1. Rake C, et al. Occupational, domestic and environmental mesothelioma risks in the British population: a case-control study. Br. J. Cancer. 2009;100:1175–1183. doi: 10.1038/sj.bjc.6604879. - DOI - PMC - PubMed
    1. Tan E, Warren N, Darnton AJ, Hodgson JT. Projection of mesothelioma mortality in Britain using Bayesian methods. Br. J. Cancer. 2010;103:430–436. doi: 10.1038/sj.bjc.6605781. - DOI - PMC - PubMed
    1. Feldman MorrisE, Apsel Beth, Aino Uotila RL, Zachary A Knight, Davide Ruggero, Kevan M Shokat. Active-site inhibitors of mTOR target rapamycin-resistant outputs of mTORC1 and mTORC2. PLoS Biol. 2009;7:e1000038. doi: 10.1371/journal.pbio.1000038. - DOI - PMC - PubMed
    1. de Gooijer CJ, Baas P, Burgers JA. Current chemotherapy strategies in malignant pleural mesothelioma. Transl. Lung cancer Res. 2018;7:574–583. doi: 10.21037/tlcr.2018.04.10. - DOI - PMC - PubMed

Publication types

MeSH terms

Substances

LinkOut - more resources