. 2021 Aug 13;11(1):16499.
doi: 10.1038/s41598-021-94984-x.

miR-141 mediates recovery from acute kidney injury

Affiliations

miR-141 mediates recovery from acute kidney injury

Lucy J Newbury et al. Sci Rep. .

Abstract

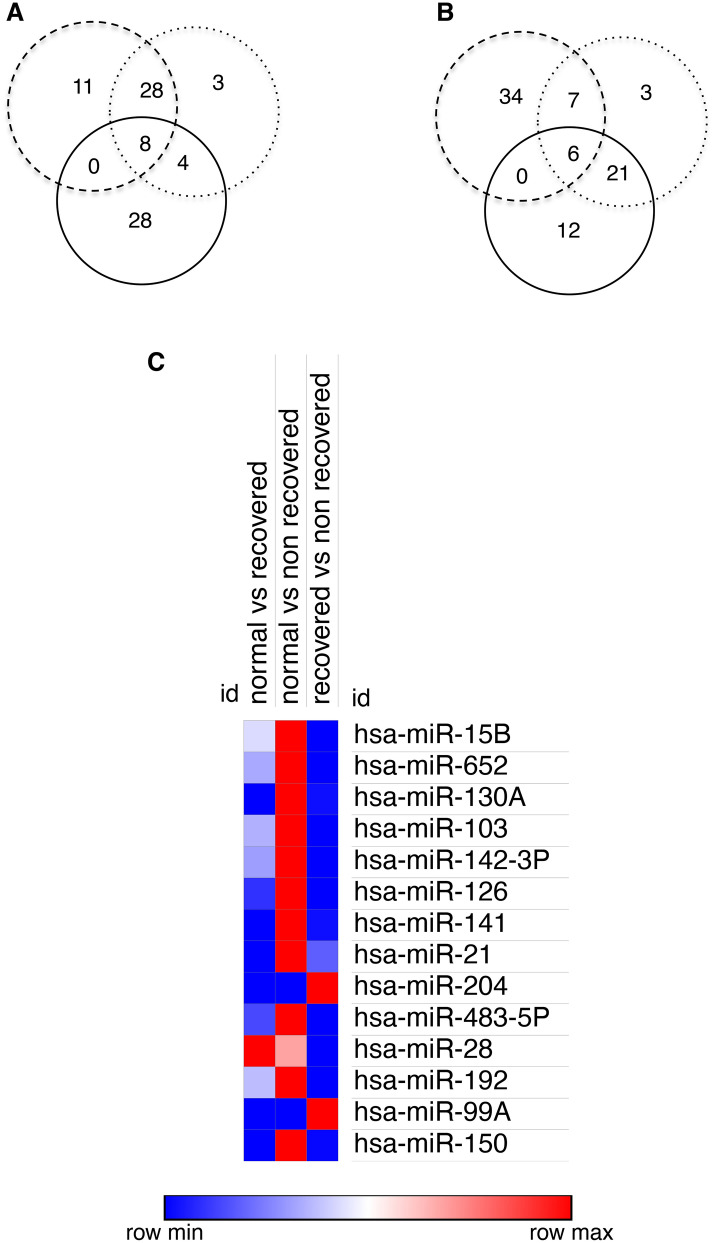
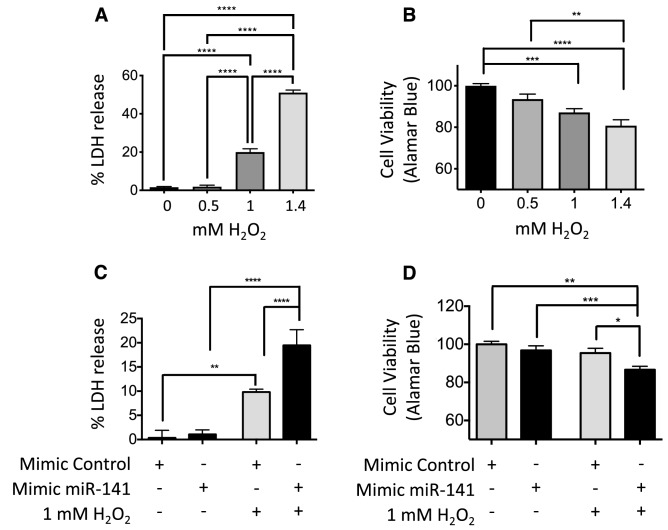
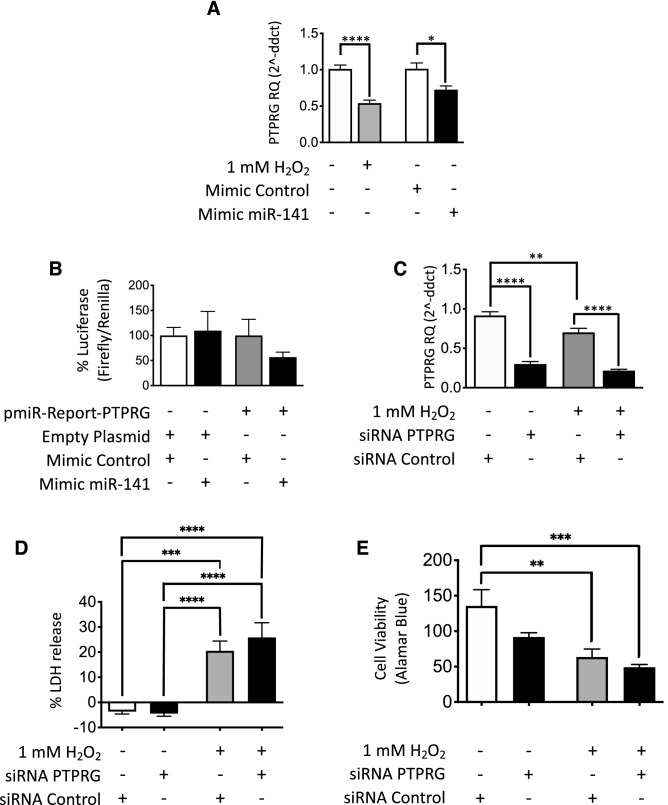
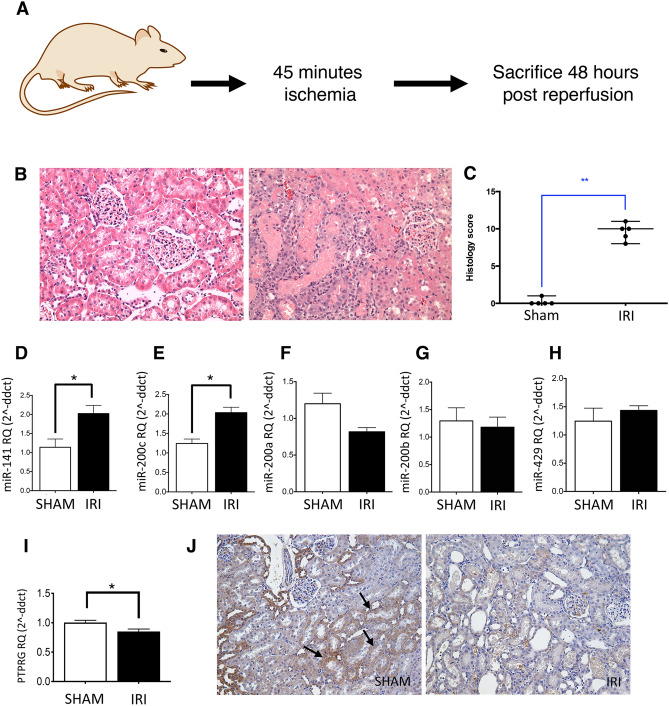
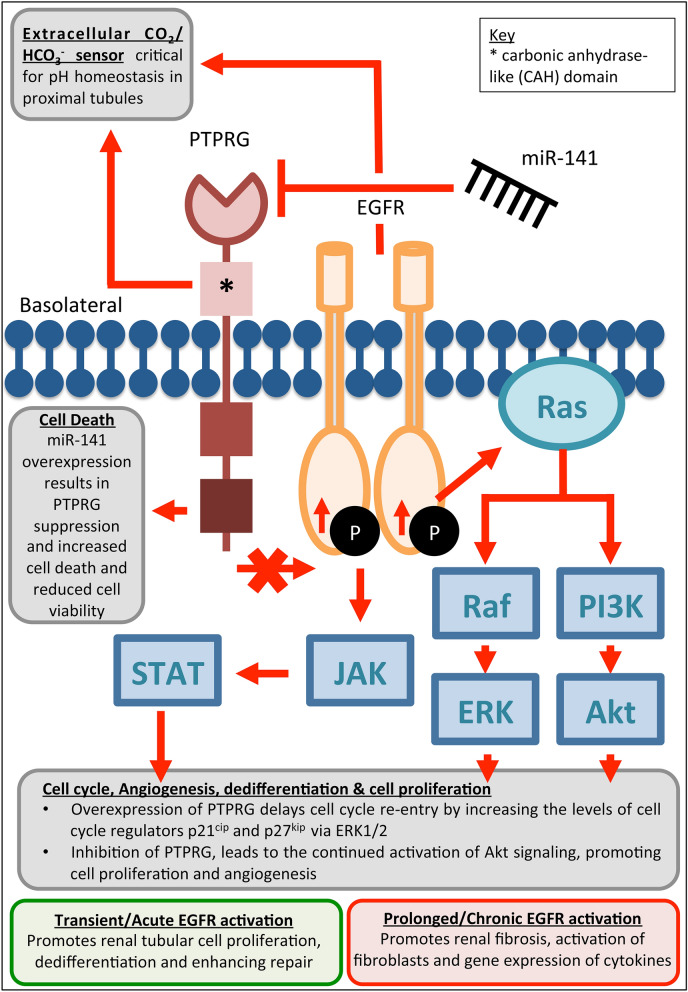
Acute kidney injury (AKI) is a global clinical problem characterised by a sudden decline in renal function and mortality as high as 60%. Current AKI biomarkers have limited ability to classify disease progression and identify underlying pathological mechanisms. Here we hypothesised that alterations in urinary microRNA profiles could predict AKI recovery/nonrecovery after 90 days, and that injury-specific changes would signify microRNA mediators of AKI pathology. Comparison of urinary microRNA profiles from AKI patients with controls detected significant injury-specific increases in miR-21, miR-126 and miR-141 (p < 0.05) and decreases in miR-192 (p < 0.001) and miR-204 (p < 0.05). Expression of miR-141 increased in renal proximal tubular epithelial cells (PTECs) under oxidative stress in vitro and unilateral ischaemic reperfusion injury in vivo. Forced miR-141 expression in the presence of H2O2 increased PTEC death and decreased cell viability. Of nine messenger RNA targets with two or more miR-141 3'-untranslated region binding sites, we confirmed protein tyrosine phosphatase receptor type G (PTPRG) as a direct miR-141 target in PTECs. PTPRG-specific siRNA knockdown under oxidative stress increased PTEC death and decreased cell viability. In conclusion, we detected significant alterations in five urinary microRNAs following AKI, and identified proximal tubular cell PTPRG as a putative novel therapeutic target.


Conflict of interest statement

T.B. and D.F. are inventors for patent WO/2017/129977 Chronic Kidney Disease Diagnostic. All other authors have no competing/conflict of interest.

Figures

Figure 1
Figure 1
Comparison of expression profiles of 377 urinary miRNAs in pooled urine samples from recovered and nonrecovered AKI patients. (A,B) Using TaqMan Low Density Array (TLDA) Human microRNA Card A with global normalisation, urinary miRNAs from recovered AKI patients (n = 6), nonrecovered AKI patients (n = 5) and control subjects (n = 20) were analysed. Venn diagrams depicting miRNAs with ≥ twofold increased (A) and decreased (B) detection when comparing recovered AKI with controls (dashed circle), non-recovered AKI with controls (dotted circle) and non-recovered AKI with recovered AKI (solid circle). (C) Heatmap showing changes between recovered, non-recovered and controls with a ≥ twofold change in all three comparisons. The heatmap was generated using Morpheus software from the Broad Institute (Morpheus, https://software.broadinstitute.org/morpheus).
Figure 2
Figure 2
RT-qPCR detection of candidate miRNA biomarkers in AKI patient urine samples and control subjects. (A-E) Significant differences were observed between AKI patients (n = 29) and controls (n = 10) for (A) miR-21 (sevenfold increase), (B) miR-126 (fourfold increase), (C) miR-141 (twofold increase), (D) miR-192 (50% decrease) and (E) miR-204 (50% decrease). (F) Receiver operating characteristic (ROC) curve comparing all AKI patients with controls for all five miRNAs gave an area under the curve (AUC) = 0.94. (G) Bar graphs of AUCs for single and multiple miRNA comparisons between AKI patients compared to controls. Statistical analysis comparing two groups was carried out by Mann–Whitney U test. Data were normalised to endogenous control miR-191 and are presented as median ± range; *p < 0.05, ***p < 0.001. CON: control; AKI ALL: all AKI patients; Top Three: miR-192, miR-21 and miR-204.
Figure 3
Figure 3
Elevated urinary miR-141 and decreased miR-192 are associated with AKI nonrecovery. (A-D) At 90 days post study entry, significant differences were observed between recovered (R; n = 18) and nonrecovered (NR; n = 8) AKI patients for (A) miR-141 (threefold increase) and (B) miR-192 (70% decrease in control compared with nonrecovered). (C) Receiver operating characteristic (ROC) curve for miR-141 and miR-192 area under the curve (AUC) = 0.83 in recovered compared with nonrecovered AKI patients. (D) Bar graph of AUCs for single and multiple miRNA comparisons between recovered and nonrecovered AKI patients. Statistical analysis comparing two groups was carried out by Mann Whitney U test, for comparison of three or more groups the Kruskal–Wallis test was used with Dunn’s multiple comparisons. Data were normalised to endogenous control miR-191 and are presented as median ± range; *p < 0.05, **p < 0.01, CON: control, R: recovered AKI patients, NR: nonrecovered AKI patients.
Figure 4
Figure 4
Expression of miR-200 family miRNAs in an in vitro oxidative stress model of AKI. (A) RT-qPCR analysis of four cells types found in the kidney: podocytes (Pod), glomerular endothelial cells (GEnC), fibroblasts (Fib) and proximal tubular epithelial cells (PTEC) showed miR-141 detection at similar abundance in each. (B-F) RT-qPCR data for miR-200 family expression in an in vitro oxidative stress model of AKI, in which PTECs were treated with 1 mM H2O2 for 24 h. (B,C) miR-141 and miR-200c were upregulated under oxidative stress (sevenfold and twofold changes, respectively). (D-F) miR-200a, miR-200b and miR-429 showed no significant changes in this model. Statistical analysis comparing H2O2-treated PTECs with untreated control cells was carried out by unpaired T-test (n = 3). Data were normalised to endogenous control miR-191 and are presented as mean ± SEM; *p < 0.05.
Figure 5
Figure 5
PTEC analysis in vitro: cell death and cell viability under oxidative stress, and manipulation of miR-141 expression. (A) Cell death marker lactate dehydrogenase (LDH) increased significantly at 1 mM and 1.4 mM H2O2. (B) Cell viability marker Alamar Blue showed 10% and 20% fewer viable cells in 1 mM and 1.4 mM H2O2, respectively. (C) A 100% increase in PTEC LDH release was seen in 1 mM H2O2 with forced miR-141 expression, with no significant change following forced miR-141 expression alone. (D) Forced miR-141 expression resulted in a 10% decrease in PTEC viability compared with miRNA mimic control under 1 mM H2O2, with no significant change following forced miR-141 expression alone. Statistical analysis between groups was carried out using one-way ANOVA with post-hoc analysis of Turkey. Data are presented as mean ± SEM; *p < 0.05, **p < 0.01, ***p < 0.001, ****p < 0.0001.
Figure 6
Figure 6
Luciferase reporter analysis of miR-141: PTPRG 3′-UTR interaction and siRNA knockdown of PTPRG in PTECs in response to oxidative stress and forced miR-141 expression. (A) RT-qPCR analysis of PTPRG showed significant downregulation in 1 mM H2O2 (50% decrease) and following forced miR-141 expression (30% decrease). (B) PTPRG 3′-UTR reporter assay activity in PTECs showed PTPRG to be a direct miR-141 target. (C) RT-qPCR analysis showed significant PTPRG mRNA knockdown using siRNA, as well as repression of PTPRG in 1 mM H2O2 compared to healthy cells. (D) LDH release increased significantly under oxidative stress and showed a further increase with PTPRG knockdown. (E) Cell viability marker Alamar Blue decreased in 1 mM H2O2, lowering further following PTPRG knockdown. Statistical analysis between groups was carried out using one-way ANOVA with post-hoc analysis of Tukey (n = 3). Data are presented as mean ± SEM; *p < 0.05, **p < 0.01, ***p < 0.001, ****p < 0.0001.
Figure 7
Figure 7
MiR-200 family expression in a rat unilateral ischaemic reperfusion injury (IRI) model of AKI. (A) A diagram depicting our unilateral IRI model in Lewis male rats and (B,C) histological evidence of tubular damage. (D-H) RT-qPCR analysis of the miR-200 family expression in rat kidneys from animals in sham and IRI experimental groups. Detection of miR-141 and miR-200c was upregulated in the unilateral IRI model (twofold, D,E), while miR-200a, miR-200b and miR-429 showed no significant changes between sham and unilateral IRI groups (FH). RT-qPCR analysis of PTPRG expression in whole kidney showed a significant injury-specific decrease in PTPRG expression (I). Histological analysis demonstrated clear kidney tubular PTPRG expression in sham tissue sections, including expression in PTECs (e.g. see arrows), which was not present in IRI tissue sections (J). Statistical analysis for IRI compared to controls was carried out by unpaired T-test (n = 4). Data were normalised to endogenous control miR-191 and are presented as mean ± SEM; *p < 0.05, **p < 0.01.
Figure 8
Figure 8
Hypothetical miR-141 regulation of PTPRG expression and its effect on PTEC signalling.

References

    1. Section 2:AKI definition. Kidney International Supplement2, 19–36 (2012). - PMC - PubMed
    1. Stewart JA. Adding insult to injury: care of patients with acute kidney injury. Br. J. Hosp. Med. (Lond.) 2009;70:372–373. doi: 10.12968/hmed.2009.70.7.43116. - DOI - PubMed
    1. Wonnacott A, Meran S, Amphlett B, Talabani B, Phillips A. Epidemiology and outcomes in community-acquired versus hospital-acquired AKI. Clin. J. Am. Soc. Nephrol. 2014;9:1007–1014. doi: 10.2215/CJN.07920713. - DOI - PMC - PubMed
    1. Gabarre P, et al. Acute kidney injury in critically ill patients with COVID-19. Intensive Care Med. 2020;46:1339–1348. doi: 10.1007/s00134-020-06153-9. - DOI - PMC - PubMed
    1. Ronco C. Biomarkers for acute kidney injury: Is NGAL ready for clinical use? Crit. Care. 2014;18:680. doi: 10.1186/s13054-014-0680-0. - DOI - PMC - PubMed

Publication types