. 2021 Aug 13;11(1):16519.
doi: 10.1038/s41598-021-96049-5.

A highly-sensitive genetically encoded temperature indicator exploiting a temperature-responsive elastin-like polypeptide

Affiliations

A highly-sensitive genetically encoded temperature indicator exploiting a temperature-responsive elastin-like polypeptide

Cong Quang Vu et al. Sci Rep. .

Abstract

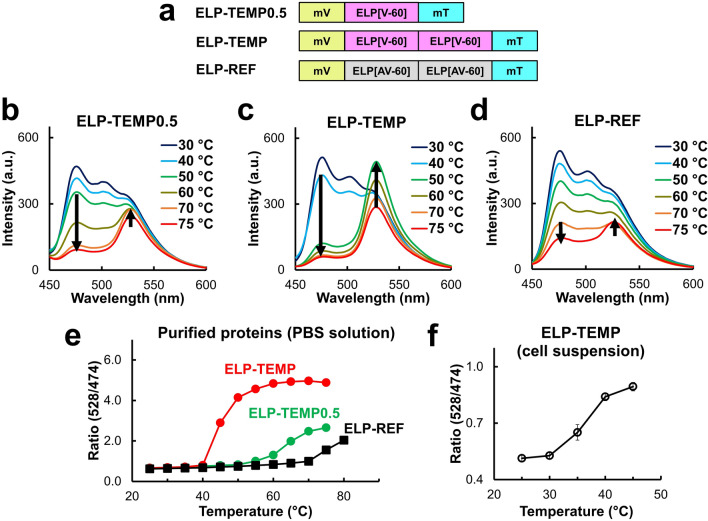
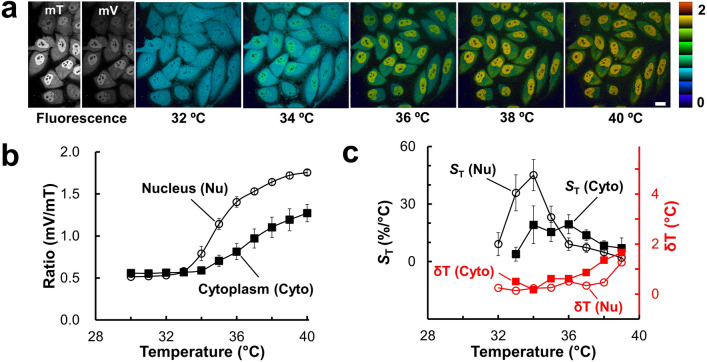
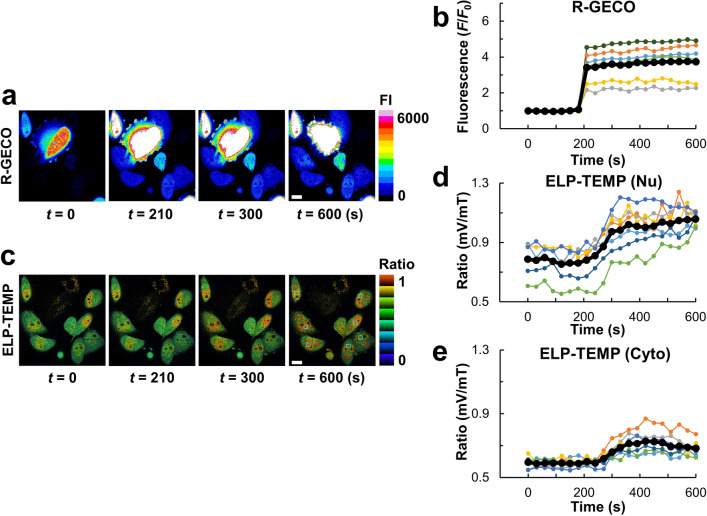
Genetically encoded temperature indicators (GETIs) allow for real-time measurement of subcellular temperature dynamics in live cells. However, GETIs have suffered from poor temperature sensitivity, which may not be sufficient to resolve small heat production from a biological process. Here, we develop a highly-sensitive GETI, denoted as ELP-TEMP, comprised of a temperature-responsive elastin-like polypeptide (ELP) fused with a cyan fluorescent protein (FP), mTurquoise2 (mT), and a yellow FP, mVenus (mV), as the donor and acceptor, respectively, of Förster resonance energy transfer (FRET). At elevated temperatures, the ELP moiety in ELP-TEMP undergoes a phase transition leading to an increase in the FRET efficiency. In HeLa cells, ELP-TEMP responded to the temperature from 33 to 40 °C with a maximum temperature sensitivity of 45.1 ± 8.1%/°C, which was the highest ever temperature sensitivity among hitherto-developed fluorescent nanothermometers. Although ELP-TEMP showed sensitivity not only to temperature but also to macromolecular crowding and self-concentration, we were able to correct the output of ELP-TEMP to achieve accurate temperature measurements at a subcellular resolution. We successfully applied ELP-TEMP to accurately measure temperature changes in cells induced by a local heat spot, even if the temperature difference was as small as < 1 °C, and to visualize heat production from stimulated Ca2+ influx in live HeLa cells induced by a chemical stimulation. Furthermore, we investigated temperatures in the nucleus and cytoplasm of live HeLa cells and found that their temperatures were almost the same within the temperature resolution of our measurement. Our study would contribute to better understanding of cellular temperature dynamics, and ELP-TEMP would be a useful GETI for the investigation of cell thermobiology.


Conflict of interest statement

The authors declare no competing interests.

Figures

Figure 1
Figure 1
Temperature response of ELP-TEMP0.5, ELP-TEMP, and ELP-reference (ELP-REF). (a) Gene design of ELP-TEMP0.5, ELP-TEMP, and ELP-REF. (bd) The fluorescence emission spectrum of (b) ELP-TEMP0.5, (c) ELP-TEMP, and (d) ELP-REF at various temperatures. (e) A plot of fluorescence ratio of mV (peak emission, 528 nm) to mT (peak emission, 474 nm) of ELP-TEMP0.5, ELP-TEMP, and ELP-REF against temperature. (f) A plot of fluorescence ratio of ELP-TEMP in HeLa cell suspension against temperature. Purified proteins (2 µM) were dissolved in a PBS solution (pH 7.4). The excitation wavelength was 430 nm. Data are mean ± SD (n = 3).
Figure 2
Figure 2
Fluorescence response of ELP-TEMP to temperature in various factors. (a) The effect of Ficoll PM70 as a macromolecular crowding reagent on the temperature dependence of fluorescence ratio mV/mT (528/474 nm) of ELP-TEMP. Purified proteins were dissolved in PBS solution containing Ficoll PM70 (0, 10, 14, and 20% w/w; pH 7.4). (b) The effect of self-concentration of ELP-TEMP on its temperature dependence of fluorescence ratio. (c) The pH-dependence of ELP-TEMP fluorescence ratio. The ELP-TEMP solution contained 30 mM trisodium citrate and 30 mM borax, whose pH was adjusted by adding HCl. The pH values of the solution were directly measured at various temperatures. (d) The effect of KCl or NaCl on the temperature response of ELP-TEMP. The ELP-TEMP solution contained PBS solution or 10 mM sodium phosphate buffer with 150 mM KCl or NaCl, pH 7.4. (e) The effect of CaCl2 or MgCl2 on the temperature response of ELP-TEMP. The ELP-TEMP solution contained PBS solution and one of the salts. To mimic 0 mM of CaCl2 or MgCl2, we added EDTA to the final concentration of 1 mM to the PBS solution. (f) The effect of repeatability on the florescence ratio of ELP-TEMP. The protein concentration was 2 µM for all measurements unless otherwise stated. The excitation was 430 nm. Data are mean ± SD (n = 3).
Figure 3
Figure 3
Temperature response of ELP-TEMP stably expressed in live HeLa cells under confocal microscopy observation. (a) Confocal fluorescence images and pseudo-colored ratio images of HeLa cells stably expressing ELP-TEMP at various temperatures. (b) A plot of fluorescence ratio mV/mT in the nucleus (Nu) and cytoplasm (Cyto) against medium temperature. (c) A plot of relative temperature sensitivity (ST; left vertical axis) and temperature resolution (δT; right vertical axis) of the Nu or Cyto against medium temperature. The color bar indicates fluorescence ratio mV/mT. Scale bar, 20 µm. Data are mean ± SD (n = 18).
Figure 4
Figure 4
Application of ELP-TEMP to monitor quick temperature rise in live HeLa cells with a local heat spot. (a) Bright-field (BF) and pseudo-colored ratio images of HeLa cells stably expressing ELP-TEMP before, during, and after local heating. The red circle indicates the CNT cluster, i.e., the heat spot, whereas squares indicate regions of interest (ROI). (b) A plot of temperature increment ΔT as the function of time in ROIs 1–4. The temperature of ROI 1 and 2 was estimated from the cytoplasm calibration curve, whereas the temperature of ROI 3 and 4 was estimated from the nucleus calibration curve in Fig. S5, respectively. A CNT cluster located near two cells was irradiated with a 638 nm laser beam at a power of 1.3 mW. Black lines indicate the periods of laser irradiation. (c) A plot of ΔT in ROI 1 as a function of the laser power at 638 nm. (d) A pseudo-colored ratio image of HeLa cells stably expressing ELP-TEMP under local heating with the laser power of 0.44 mW. A line indicates ROI. (e) A plot of ΔT of the line in panel (d) against the distance from the heat spot. Closed and opened blue circles represent ΔT in the cytoplasm and nucleus, respectively, with the laser power of 0.44 mW, whereas closed and opened red squares represent ΔT in the cytoplasm and nucleus, respectively, with the laser power of 1.3 mW. The transparent box indicates the nucleus area. The medium temperature was 34 °C. The color bar indicates fluorescence ratio mV/mT. Scale bars, 20 μm.
Figure 5
Figure 5
Visualization of heat production by stimulated Ca2+ influx with a Ca2+-ionophore ionomycin in live HeLa cells stably expressing ELP-TEMP and transiently co-expressing R-GECO. (a) Pseudo-colored fluorescence images of R-GECO in response to ionomycin stimulation. (b) A plot of fluorescence intensity (F/F0) of R-GECO against time. (c) Pseudo-colored ratio images of ELP-TEMP in response to ionomycin stimulation. (d) A plot of fluorescence ratio mV/mT of ELP-TEMP in the nuclues (Nu) against time. (e) A plot of fluorescence ratio mV/mT of ELP-TEMP in the cytoplasm (Cyto) against time. The observation was performed under the same confocal micoscope in Fig. 3. To prevent changes in medium temperature due to ionomycin stimulation, medium containing 4 µM ionomycin was supplied through a preheated perfusion tube, and the medium temperature around the observed cells was maintained at 34 ± 0.1 °C during observation. Red and cyan squares indicate ROIs for cytoplasm and nuclues, respectively. The color bars indicate fluorescence intensity (FI) and ratio for (a) and (c), respectively. Scale bars, 20 µm.
Figure 6
Figure 6
Investigation of the difference in fluorescence ratios of ELP-TEMP between the nucleus and cytoplasm. (a) Fluorescence image of mV signal in ELP-TEMP by direct excitation at 514 nm observed by a confocal microscope. The mV fluorescence intensity in the nucleus was measured to be 3.3-fold higher than that in the cytoplasm. From the calibration curve (Fig. S9), the ELP-TEMP concentration in the nucleus and cytoplasm was estimated to be 1.3 ± 0.6 µM and 0.4 ± 0.2 µM (n = 43 cells), respectively. The color bar indicates fluorescence intensity of mV. Scale bar, 20 μm. (b) Comparison of temperature response of ELP-TEMP in HeLa cells measured by confocal microscopy (Fig. 3b) with that of purified protein at concentrations of 1.3 and 0.4 µM in a PBS solution containing 14% w/w Ficoll PM70 by fluorescence spectroscopy. The correlation coefficients between the fluorescence ratios from cells and purified protein were 0.995 and 0.999 for nucleus and cytoplasm, respectively, where the data points on the trajectories of purified protein were interpolated by spline curves. For comparison with the microscopy data, we calculated the integral of F(λ)T(λ) for mT and mV, where F is a fluorescence emission intensity at a wavelength λ and T is a composite spectral transmittance of a bandpass filter and a dichroic mirror. The integration wavelengths were 457–500 nm and 526–552 nm for mT and mV, respectively. Additionally, we directly measured the temperature of the ELP-TEMP solution with the same thermometer used for the microscopy observation. The excitation was 430 nm. Data are mean ± SD (n = 3).

References

    1. Okabe K, et al. Intracellular temperature mapping with a fluorescent polymeric thermometer and fluorescence lifetime imaging microscopy. Nat. Commun. 2012;3:705. doi: 10.1038/ncomms1714. - DOI - PMC - PubMed
    1. Nakano M, et al. Genetically encoded ratiometric fluorescent thermometer with wide range and rapid response. PLoS ONE. 2017;12:e0172344. doi: 10.1371/journal.pone.0172344. - DOI - PMC - PubMed
    1. Hayashi T, Fukuda N, Uchiyama S, Inada N. A cell-permeable fluorescent polymeric thermometer for intracellular temperature mapping in mammalian cell lines. PLoS ONE. 2015;10:e0117677. doi: 10.1371/journal.pone.0117677. - DOI - PMC - PubMed
    1. Chrétien D, et al. Mitochondria are physiologically maintained at close to 50 °C. PLoS Biol. 2018;16:e2003992. doi: 10.1371/journal.pbio.2003992. - DOI - PMC - PubMed
    1. Sotoma S, et al. In situ measurements of intracellular thermal conductivity using heater-thermometer hybrid diamond nanosensors. Sci. Adv. 2021;7:7888. doi: 10.1126/sciadv.abd7888. - DOI - PMC - PubMed

Publication types