

Differences in health care spending and utilization among older frail adults in high-income countries: ICCONIC hip fracture persona
- PMID: 34390254
- PMCID: PMC8579209
- DOI: 10.1111/1475-6773.13739
Differences in health care spending and utilization among older frail adults in high-income countries: ICCONIC hip fracture persona
Abstract
Objective: This study explores differences in spending and utilization of health care services for an older person with frailty before and after a hip fracture.
Data sources: We used individual-level patient data from five care settings.
Study design: We compared utilization and spending of an older person aged older than 65 years for 365 days before and after a hip fracture across 11 countries and five domains of care as follows: acute hospital care, primary care, outpatient specialty care, post-acute rehabilitative care, and outpatient drugs. Utilization and spending were age and sex standardized..
Data collection/extraction methods: The data were compiled by the International Collaborative on Costs, Outcomes, and Needs in Care (ICCONIC) across 11 countries as follows: Australia, Canada, England, France, Germany, the Netherlands, New Zealand, Spain, Sweden, Switzerland, and the United States.
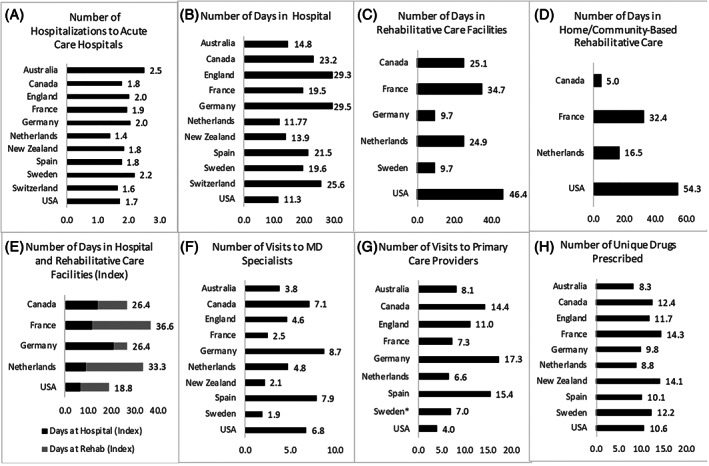
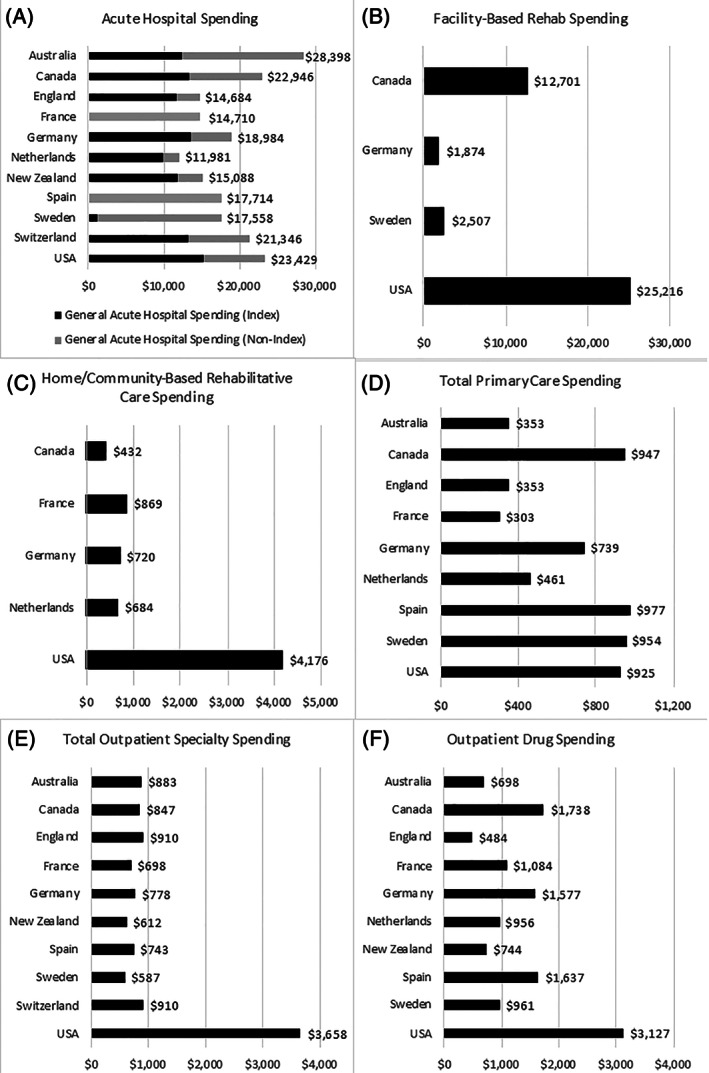
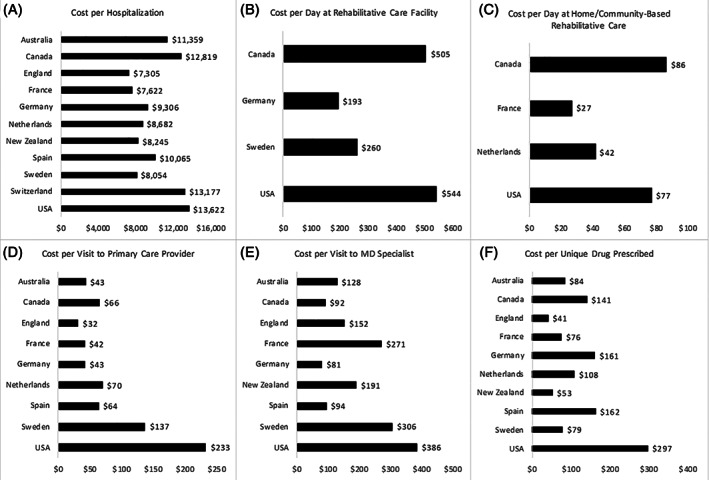
Principal findings: The sample ranged from 1859 patients in Spain to 42,849 in France. Mean age ranged from 81.2 in Switzerland to 84.7 in Australia. The majority of patients across countries were female. Relative to other countries, the United States had the lowest inpatient length of stay (11.3), but the highest number of days were spent in post-acute care rehab (100.7) and, on average, had more visits to specialist providers (6.8 per year) than primary care providers (4.0 per year). Across almost all sectors, the United States spent more per person than other countries per unit ($13,622 per hospitalization, $233 per primary care visit, $386 per MD specialist visit). Patients also had high expenditures in the year prior to the hip fracture, mostly concentrated in the inpatient setting.
Conclusion: Across 11 high-income countries, there is substantial variation in health care spending and utilization for an older person with frailty, both before and after a hip fracture. The United States is the most expensive country due to high prices and above average utilization of post-acute rehab care.
Keywords: health systems; hip fracture; international comparisons.
© 2021 The Authors. Health Services Research published by Wiley Periodicals LLC on behalf of Health Research and Educational Trust.
Figures
References
-
- Handforth C, Clegg A, Young C, et al. The prevalence and outcomes of frailty in older cancer patients: a systematic review. Ann Oncol. 2015;26(6):1091‐1101. - PubMed
Publication types
MeSH terms
LinkOut - more resources
Full Text Sources
Medical
