Review
. 2022 Dec;29(57):85595-85611.
doi: 10.1007/s11356-021-15915-x. Epub 2021 Aug 14.

Spike in pollution to ignite the bursting of COVID-19 second wave is more dangerous than spike of SAR-CoV-2 under environmental ignorance in long term: a review

Affiliations
Review

Spike in pollution to ignite the bursting of COVID-19 second wave is more dangerous than spike of SAR-CoV-2 under environmental ignorance in long term: a review

Biswaranjan Paital et al. Environ Sci Pollut Res Int. 2022 Dec.

Abstract

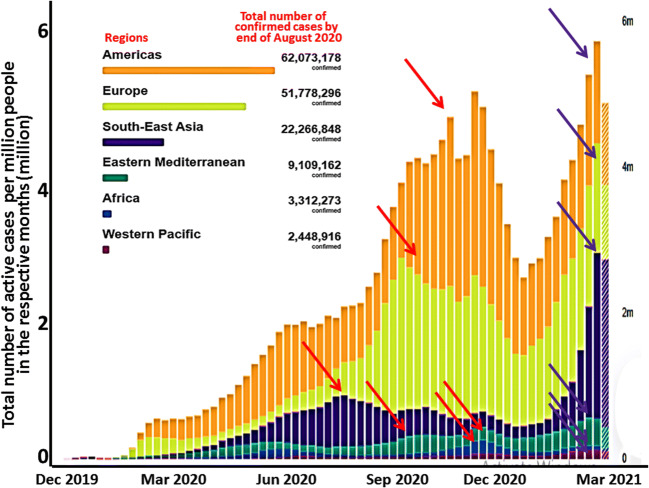
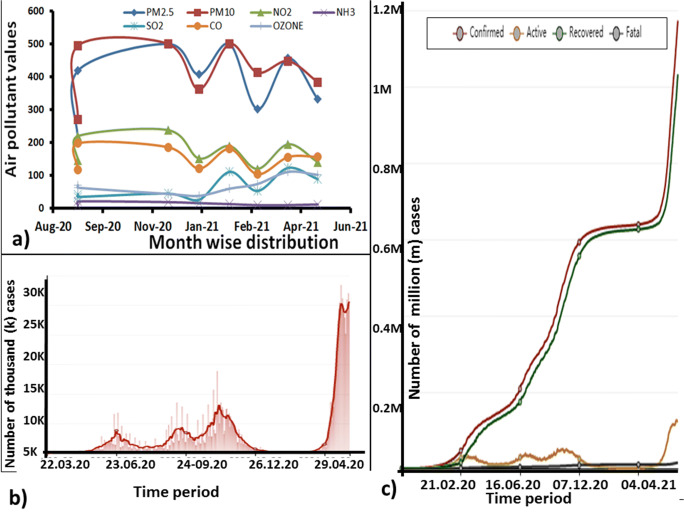
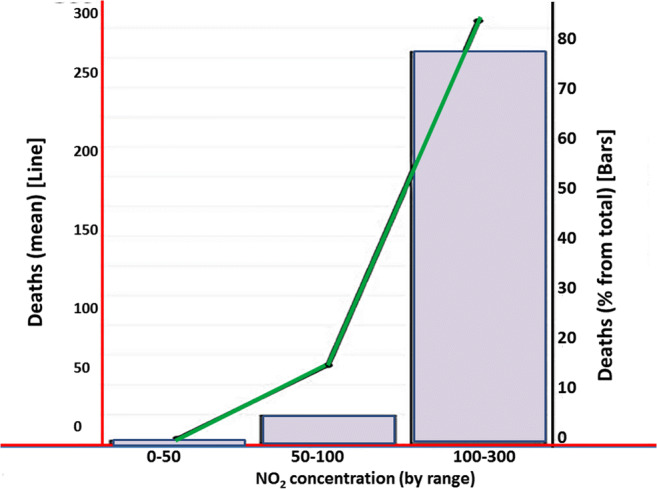
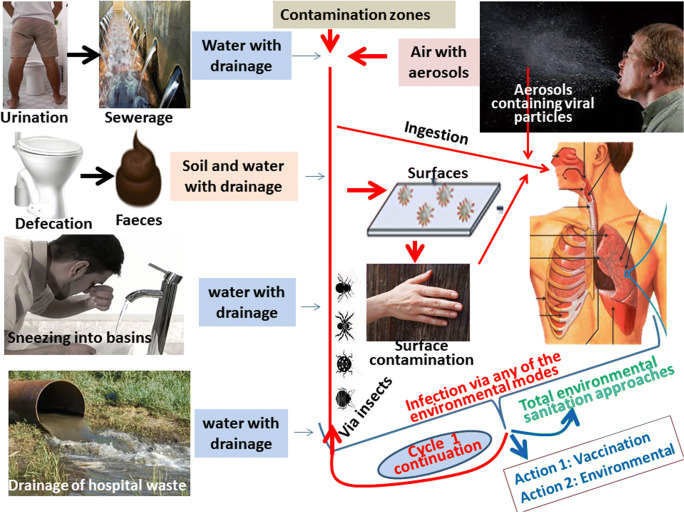
Specific areas in many countries such as Italy, India, China, Brazil, Germany and the USA have witnessed that air pollution increases the risk of COVID-19 severity as particulate matters transmit the virus SARS-CoV-2 and causes high expression of ACE2, the receptor for spike protein of the virus, especially under exposure to NO2, SO2 and NOx emissions. Wastewater-based epidemiology of COVID-19 is also noticed in many countries such as the Netherlands, the USA, Paris, France, Australia, Spain, Italy, Switzerland China, India and Hungary. Soil is also found to be contaminated by the RNA of SARS-CoV-2. Activities including defecation and urination by infected people contribute to the source for soil contamination, while release of wastewater containing cough, urine and stool of infected people from hospitals and home isolation contributes to the source of SARS-CoV-2 RNA in both water and soil. Detection of the virus early before the outbreak of the disease supports this fact. Based on this information, spike in pollution is found to be more dangerous in long-term than the spike protein of SARS-CoV-2. It is because the later one may be controlled in future within months or few years by vaccination and with specific drugs, but the former one provides base for many diseases including the current and any future pandemics. Although such predictions and the positive effects of SARS-CoV-2 on environment was already forecasted after the first wave of COVID-19, the learnt lesson as spotlight was not considered as one of the measures for which 2nd wave has quickly hit the world.

Keywords: Future pandemics; Future waves of COVID-19; Pollution spike; Spike protein of SARS-CoV-2; Total environmental management; Waterborne COVID-19.


Conflict of interest statement

The authors declare no competing interests.

Figures

Fig. 1
Fig. 1
Global status of the first and second wave of COVID-19 outbreak by the mid-April 2021. The first wave (red arrows) seemed to be decreased to its lowest value by the end of December 2020, while the second wave (purple arrows) has been started almost in all countries and now been observed to move with full speed of contamination. Although most of the countries have experienced the peak of the first wave between June 2020 and December 2020, the second wave is hitting almost all the countries at this time point. Still the trend of COVID-19 infection per million population is high in America, followed by Europe, Asia, Eastern Mediterranean countries, Africa and Western Pacific regions. Numbers of infection has been shown in inserts (Source WHO under creative common attribution)
Fig. 2
Fig. 2
Real-time data for the total number of cases verses the total number of deaths in India in COVID-19 up to the last week of April 2021. Data indicate that the peak in both death and infection rate was observed in the country during August to September 2020, and then the graph took a long jump in linear scale in March to May 2021 (Worldometers, 2021)
Fig. 3
Fig. 3
Relation between air pollution and COVID-19 status in New Delhi, India. Air pollution indices were low in August 2020 amid COVID-19-induced lockdowns in New Delhi, India. As the lockdowns was lifted, the predicted massive gas exhaustion from reopening industries, vehicular traffics, etc. was able to uplift the air pollution status (a). Again the loose lockdowns along with disobeying of COVID-19 guidelines were able to lift the gas exhaustion in February 2021. That provided a sound background for speedy infection (b), causality and mortality in March 2021. The pattern still continues in April and May 2021 (c). The main factors such as particulate matters (PM) could be the reason to increase a sharp rise in COVID-19 infection by acting as vehicle of transmission while SO2, NO2 and CO could be the contributing factor to increase the infection rate and/or severity in the disease by up regulating the angiotensin converting enzyme 2 in the epithelia cells of respiratory cells that acts as the receptor for the SARS-CoV-2, especially for its spike protein (Paital and Agrawal 2020). The raw data were collected from Bing (2021) and NAQI (2021) under creative common attribution license
Fig. 4
Fig. 4
Relation between environmental NO2 concentration and COVID-19 infection and death rate in Italy. Data indicates that a strong and positive correlation observed between environmental NO2 concentration and COVID-19 infection and/or severity and death rate in Italy. The reason being contributed to the upregulation of the angiotensin converting enzyme 2 in the epithelia cells of respiratory cells that acts as the receptor for the SARS-CoV-2, especially for its spike protein (Redrawn after Ogen (2020) under creative common attribution license. Paital and Agrawal 2020)
Fig. 5
Fig. 5
Global view of the second wave of the COVID-19. a Total number of the confirmed COVID-19 cases as on May 2021. b Total number of the confirmed death in COVID-19 cases as on May 2021. Two clear peaks are observed between October 2020 and November 2020 both for the infections (nearly 5 million cases per 100 million populations) and death (nearly 90 thousand per million populations) in COVID-19 in the first wave (red arrows). In the 2nd wave, an increasing trend has been observed, but it is not clear when the peak will arrive (blue arrows)
Fig. 6
Fig. 6
High risk of the COVID-19 infection under air pollution especially under the high NO2 and PM2.5. It has been studied that the PM2.5 from the infected patients can carry the virus up to certain distance and the virus can be viable up to few days. The ACE2 present mainly in the respiratory tract of humans acts as the receptor of spike protein (S that breaks to S1 and S2 once it get attached to ACE2 of host) of the virus gets upregulated under NO2 exposure. Therefore, both PM2.5 carrying the virus and NO2 when inhaled, they can work synergistically to increase the risk of infection in human. On the other hand, air pollutants such as NO2 and SO2 are known for their immunoreduction capacity in human. Therefore, once the viruses enters through PM2.5 or via other droplets, NO2 and SO2 can be responsible for the internalisation of the virus increasing the chance of severity in the patients. The step-by-step possible mechanism is demonstrated (adapted from our previous article Paital and Agrawal, 2021 under creative common attribution license)
Fig. 7
Fig. 7
Severity of COVID-19 under industrial and vehicular activities. Under the high industrial and vehicular traffics, air pollutants such as NO2, NOX, PMs, SO2 and CO can decrease the immunity and increase the chance of infection and/or severity of COVID-19. Mainly, the virus can increase the lung fibrosis decreasing the chance of survivability of the patients. The relation that exists among air pollutants, ACE2 expression and reduction of immunity can increase the lung fibrosis that positively correlated with mortality rate in COVID-19 (Adapted after Paital and Agrawal, 2021). Lifting of lockdowns and high industrial and vehicular activities to make up the loss incurred during the first wave of COVID-19 could be the deciding factor. So, environmental policy to check pollution especially air pollution is suggested
Fig. 8
Fig. 8
Total environmental approaches for handling COVID-19. It has been noticed that the SARS-CoV-2 virus can emerge to air, water and soil via sneezing, talking, singing-like activities, faecal and urine of patients from self-quarantined houses and hospitals and via insect vectors. The contamination of above spheres can be seen in a cycling manner, and the cycles continue if sanitization like water treatment, air filtering and fixing pollutions along with vaccination is not done
Fig. 9
Fig. 9
Several basic air cleaning methods used in air polluting industries or even in vehicles. Aerosols or particulate matters present in the air found to be the main contributing factor for the airborne nature of the SARS-CoV-2. Along with use of the advanced air purifiers in houses, but the major air polluting contributors such as in industry and associated sectors must use cyclonic dirty separator (a air is circulated with speed to settled down dirty particles), trajectory separator (b air is moved in projectile so that dirty particle can be settled down), simple filtering bag with lower mess size and high filtering capacity (c), gravity separator (d air is allowed in a chamber to settle down the heavier particulate matters before they are released), scrubber (e special liquids can be used to absorb the dirty particulate matters) and electrostatics separated (f electric plates are used to separate the pre-changed particulate matters) to clean air before they are released into atmosphere
Fig. 10
Fig. 10
Total environmental approaches to avoid severity of subsequent COVID-19 wave and any future pandemics

References

    1. Ahmed W, Angel N, Edson J, Bibby K, Bivins A, O'Brien JW, Choi PM, Kitajima M, Simpson SL, Li J, Tscharke B, Verhagen R, Smith WJM, Zaugg J, Dierens L, Hugenholtz P, Thomas KV, Mueller JF. First confirmed detection of SARS-CoV-2 in untreated wastewater in Australia: a proof of concept for the wastewater surveillance of COVID-19 in the community. Sci Total Environ. 2020;728:138764. doi: 10.1016/j.scitotenv.2020.138764. - DOI - PMC - PubMed
    1. Amirian ES. Potential fecal transmission of SARS-CoV-2: current evidence and implications for public health. Int J Infect Dis. 2020;95:363–370. doi: 10.1016/j.ijid.2020.04.057. - DOI - PMC - PubMed
    1. AQICN (2021) World air pollution statistics top 10 best and worst air quality in World.https://aqicn.org/statistics/. Accessed 02.05.2021
    1. Bhargava R (2021) Environmental pollution: environmental pollution: sources, causes Sources, causes, effect and effect and control. https://www.iitr.ac.in/wfw/web_ua_water_for_welfare/education/proceeding.... Accessed 13.05.2021
    1. Bhuyan A. Experts criticise India’s complacency over COVID-19. Lancet. 2021;397(10285):1611–1612. doi: 10.1016/S0140-6736(21)00993-4. - DOI - PMC - PubMed