. 2021 Nov;51(11):e13669.
doi: 10.1111/eci.13669. Epub 2021 Aug 27.

Racial and ethnic inequities in the early distribution of U.S. COVID-19 testing sites and mortality

Affiliations

Racial and ethnic inequities in the early distribution of U.S. COVID-19 testing sites and mortality

Nathan P Dalva-Baird et al. Eur J Clin Invest. 2021 Nov.

Abstract

Background: In 2020, early U.S. COVID-19 testing sites offered diagnostic capacity to patients and were important sources of epidemiological data about the spread of the novel pandemic disease. However, little research has comprehensively described American testing sites' distribution by race/ethnicity and sought to identify any relation to known disparities in COVID-19 outcomes.

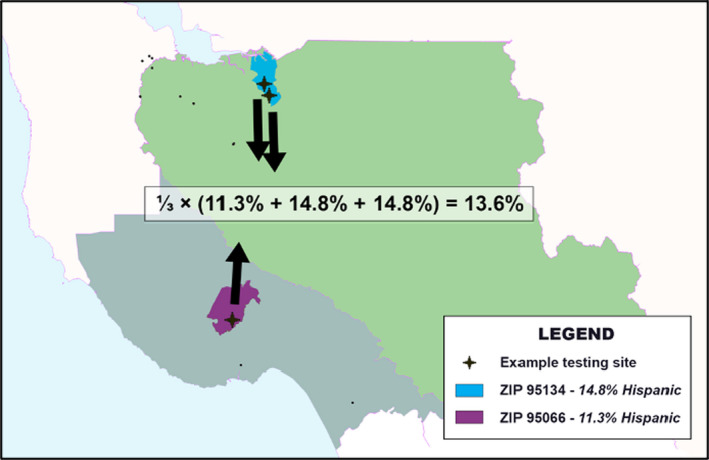
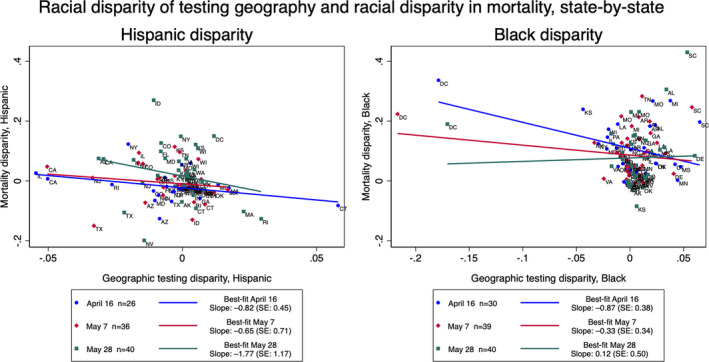
Methods: Locations of U.S. COVID-19 testing sites were gathered from 16 April to 28 May 2020. Geographic testing disparities were evaluated with comparisons of the demographic makeup of zip codes around each testing site versus Monte Carlo simulations, aggregated to statewide and nationwide levels. State testing disparities were compared with statewide disparities in mortality observed one to 3 weeks later using multivariable regression, controlling for confounding disparities and characteristics.

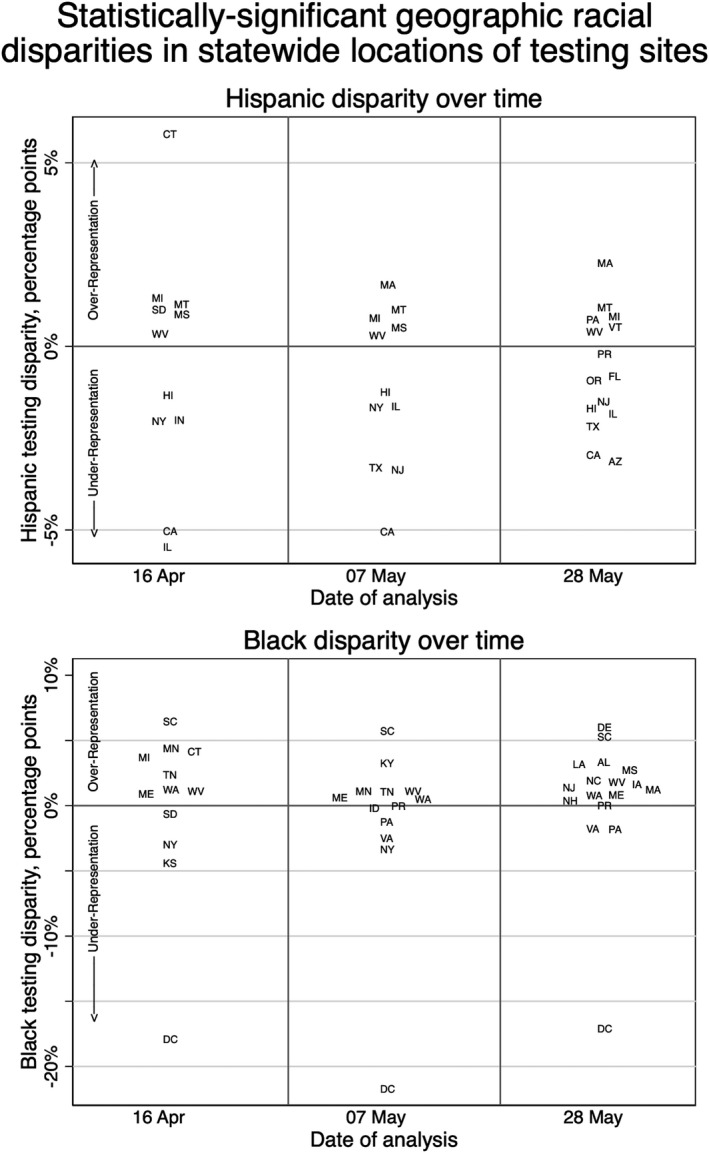
Results: Nationwide, COVID-19 testing sites geographically overrepresented White residents on 7 May, underrepresented Hispanic residents on 16 April, 7 May and 28 May and overrepresented Black residents on 28 May compared with random distribution within counties, with new sites added over time exhibiting inconsistent disparities for Black and Hispanic populations. For every 1 percentage point increase in underrepresentation of Hispanic populations in zip codes with testing, mortality among the state's Hispanic population was 1.04 percentage points more over-representative (SE = 0.415, p = .01).

Conclusions: American testing sites were not distributed equitably by race during this analysis, often underrepresenting minority populations who bear a disproportionate burden of COVID-19 cases and deaths. With an easy-to-implement measure of geographic disparity, these results provide empirical support for the consideration of access when distributing preventive resources.


Figures

FIGURE 1
FIGURE 1
Demonstration of aggregate proportion calculation with three arbitrary testing sites. Three testing sites in California were arbitrarily chosen to demonstrate how the aggregate proportion in ZCTAs around testing sites is calculated. The Hispanic proportion was calculated for just these three sites. One site is in zip code 95066 (purple), which is 11.3% Hispanic. The other two sites are in zip code 95134 (blue), which is 14.8% Hispanic. For these three sites, the aggregate proportion is 13.6 per cent. In this study, all testing sites in the state or the country would be aggregated in this way for both the empirical and simulated testing distributions. The empirical aggregate proportion is compared to the mean‐simulated aggregate proportion to calculate the testing disparity
FIGURE 2
FIGURE 2
Statistically significant statewide racial and ethnic disparities in testing geography. For both Hispanic and non‐Hispanic Black, states with significant disparities (p‐value <.05) are distributed along the y‐axis based on the percentage point disparity between the per cent makeup of the zip codes containing testing sites and per cent makeup of surrounding counties. Positive (negative) testing disparities indicate that the racial/ethnic group is overrepresented (underrepresented) in the zip codes with testing compared to the surrounding counties. Horizontal separation is only to make state abbreviations legible and does not convey meaning
FIGURE 3
FIGURE 3
Disparity of testing geography and disparity in mortality, state‐by‐state. For Hispanic and non‐Hispanic Black and all dates of analysis, statewide disparities in the makeup of zip codes and what would be expected from random distribution are plotted against the statewide disparity in mortality, comparing the group's proportion of total state population to its proportion of COVID‐19 deaths 1 to 3 weeks later with known race/ethnicity. Positive (negative) testing disparities indicate that the racial/ethnic group is overrepresented (underrepresented) in the zip codes with testing compared with the surrounding counties. Positive (negative) mortality disparities indicate that members of the racial/ethnic group are overrepresented (underrepresented) among deaths compared to what would be expected given the proportion of the racial/ethnic group in the state. Best‐fit lines show simple linear regression between the two disparities for each date of analysis. A version of this figure without DC and CT, the two notable outliers, is available in the supplement (Supplemental Figure 2)

References

    1. Centers for Disease Control and Prevention . Cases of Coronavirus Disease (COVID‐19) in the U.S. Published online 2020. https://www.cdc.gov/coronavirus/2019‐ncov/cases‐updates/cases‐in‐us.html
    1. Millett GA, Jones AT, Benkeser D, et al. Assessing differential impacts of COVID‐19 on black communities. Ann Epidemiol. 2020;47:37‐44. 10.1016/j.annepidem.2020.05.003 - DOI - PMC - PubMed
    1. Gross CP, Essien UR, Pasha S, Gross JR, Wang S‐Y, Nunez‐Smith M. Racial and ethnic disparities in population‐level Covid‐19 mortality. J Gen Intern Med. 2020;35(10):3097‐3099. 10.1007/s11606-020-06081-w - DOI - PMC - PubMed
    1. Mahajan UV, Larkins‐Pettigrew M. Racial demographics and COVID‐19 confirmed cases and deaths: a correlational analysis of 2886 US counties. J Public Health. 2020;42(3):445‐447. 10.1093/pubmed/fdaa070 - DOI - PMC - PubMed
    1. Maroko AR, Nash D, Pavilonis BT. COVID‐19 and inequity: a comparative spatial analysis of New York city and Chicago hot spots. J Urban Heal. 2020;97(4):461‐470. 10.1007/s11524-020-00468-0 - DOI - PMC - PubMed