Observational Study
. 2021 Nov;32(11):1425-1433.
doi: 10.1016/j.annonc.2021.08.1746. Epub 2021 Aug 11.

A multigenomic liquid biopsy biomarker for neuroendocrine tumor disease outperforms CgA and has surgical and clinical utility

Affiliations
Observational Study

A multigenomic liquid biopsy biomarker for neuroendocrine tumor disease outperforms CgA and has surgical and clinical utility

I M Modlin et al. Ann Oncol. 2021 Nov.

Abstract

Background: Biomarkers are key tools in cancer management. In neuroendocrine tumors (NETs), Chromogranin A (CgA) was considered acceptable as a biomarker. We compared the clinical efficacy of a multigenomic blood biomarker (NETest) to CgA over a 5-year period.

Patients and methods: An observational, prospective, cross-sectional, multicenter, multinational, comparative cohort assessment. Cohort 1: NETest evaluation in NETs (n = 1684) and cancers, benign diseases, controls (n = 731). Cohort 2: (n = 1270): matched analysis of NETest/CgA in a sub-cohort of NETs (n = 922) versus other diseases and controls (n = 348). Disease status was assessed by response evaluation criteria in solid tumors (RECIST). NETest measurement: qPCR [upper limit of normal (ULN: 20)], CgA (EuroDiagnostica, ULN: 108 ng/ml).

Statistics: Mann-Whitney U-test, AUROC, chi-square and McNemar' test.

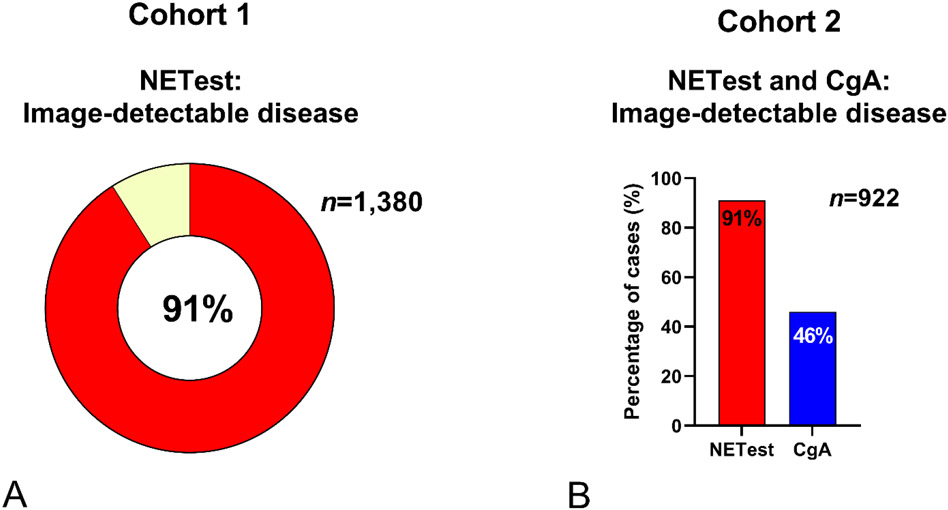
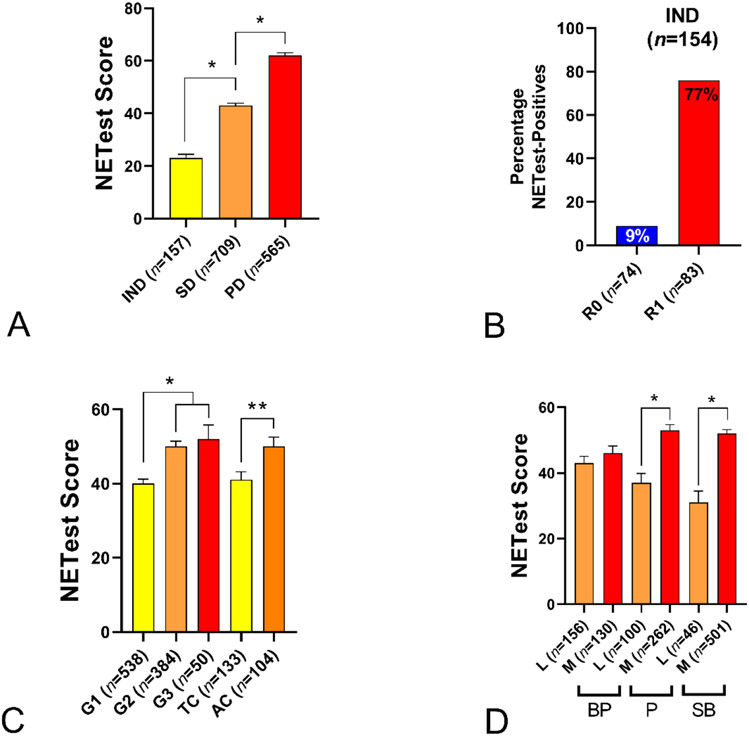
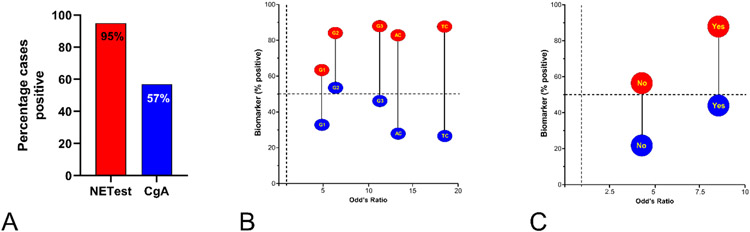
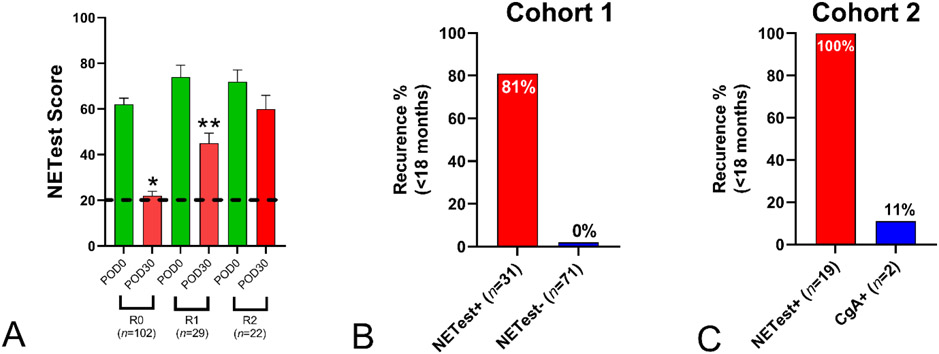
Results: Cohort 1: NETest diagnostic accuracy was 91% (P < 0.0001) and identified pheochromocytomas (98%), small intestine (94%), pancreas (91%), lung (88%), gastric (80%) and appendix (79%). NETest reflected grading: G1: 40 ± 1, G2 (50 ± 1) and G3 (52 ± 1). Locoregional disease levels were lower (38 ± 1) than metastatic (52 ± 1, P < 0.0001). NETest accurately stratified RECIST-assessed disease extent: no disease (21 ± 1), stable (43 ± 2), progressive (62 ± 2) (P < 0.0001). NETest concordance with imaging (CT/MRI/68Ga-SSA-PET) 91%. Presurgery, all NETs (n = 153) were positive (100%). After palliative R1/R2 surgery (n = 51) all (100%) remained elevated. After curative R0-surgery (n = 102), NETest levels were normal in 81 (70%) with no recurrence at 2 years. In the 31 (30%) with elevated levels, 25 (81%) recurred within 2 years. Cohort #2: NETest diagnostic accuracy was 87% and CgA 54% (P < 0.0001). NETest was more accurate than CgA for grading (chi-square = 7.7, OR = 18.5) and metastatic identification (chi-square = 180, OR = 8.4). NETest identified progressive disease (95%) versus CgA (57%, P < 0.0001). Imaging concordance for NETest was 91% versus CgA (46%) (P < 0.0001). Recurrence prediction after surgery was NETest-positive in >94% versus CgA 11%.

Conclusion: NETest accurately diagnoses NETs and is an effective surrogate marker for imaging, grade, metastases and disease status compared to CgA. A multigenomic liquid biopsy is an accurate biomarker of NET disease.

Keywords: Chromogranin; NET; NETest; biomarker; neuroendocrine tumor.


Conflict of interest statement

Disclosure KEÖ is a senior professor Uppsala University, has received honoraria from Novartis, IPSEN, AAA, DQS, Wren, Camurus and ITM. Centers of Excellence reviewer for ENETS. IMM: consultant for Novartis, Ipsen, Wren, Wyeth, Nycomed, RadioMedix and Mallinckrodt. MK: employee of Wren. MF: research grants and advisory role for: J&J, Novartis, Ipsen, AAA, Mylan and Celgene. AF: has received educational grants and research grants from Novartis. Speaker honorarium from Novartis for work not related to the present paper. CT: IPSEN honoraria for lectures, advisory boards and educational grants. LB: unpaid consultant/advisor AAA and Ipsen. All other authors have declared no conflicts of interest.

Figures

Figure 1.
Figure 1.. Biomarker diagnostic utility
1A. Cohort 1 (n=2,415): NETest scores (y-axis) and the percentage positive cases (x-axis) irrespective of disease status (includes CR/NED) for the principal organ sites. Upper limit of normal=20 is expressed by the red dotted line. The majority of NETs (>80%) exhibit an elevated NETest with mean scores >20. 1B. Cohort 2 (n=1,270): Relationship between the percentage positive cases and the calculated relative risk (versus the controls, benign and malignant diseases: n=348) for the principal sites. NETest (red circles) and CgA (blue circles). Pancreatic (P), small bowel (SB), CUP and lung (BP – bronchopulmonary) exhibited relative risks of >3 for the NETest. CgA exhibited lower performance metrics especially for rectal (R), lung (BP) and pancreatic (P) NETs (all with <40% positive samples, RR<1.5). Dotted lines reflect a 50% cut-off for test positive (horizontal line) and a RR of 1.0 (vertical line). BD = Benign disease. BP = bronchopulmonary (lung). CON = control. CR = complete remission. CUP = carcinoid of unknown primary. G = gastric. IVD = in vitro diagnostic. NED = no evidence of disease. NEO = other neoplasia. P = pancreatic. R = rectal. SB = small bowel.
Figure 2.
Figure 2.. NETest versus CgA: Imaging utility
2A. Cohort 1 (n=1,684). NETest was elevated in image-positive disease (n=1,380) in 91%. 2B. Cohort 2 (n=922). NETest-positive 91% positive compared to CgA elevated in 46%. NETest is significantly more accurate than CgA (p<0.0001).
Figure 3.
Figure 3.. Correlations with clinical parameters.
3A. Clinical Disease status. NETest scores were significantly elevated in those with SD vs. IND and in PD vs. SD. (1-way ANOVA: F = 191.3, *p<0.01). 3B Image Negative Disease. In the IND cohort with microscopic disease (R1) the percentage positive NETest was 76% versus 9% in those with R0 resection (Chi2=64, p<0.0001). 3C. Grading. NETest scores were significantly elevated in G2 and G3 tumors compared to G1. In BPNETs the AC group NETest levels were similar to G2 and G3 and were elevated compared to TC (not different to G1) *p<0.01, **p<0.05. 3D. Disease Extent. NETest scores were significantly elevated in metastatic vs. localized disease. (*p<0.0001). AC = atypical carcinoid. BP = bronchopulmonary. IND = image-negative disease. P = Pancreas. PD = progressive disease. SB = small bowel. SD = stable disease. TC = typical carcinoid. Mean±SEM.
Figure 4.
Figure 4.. Cohort #2 NETest/CgA Correlation with clinical parameters (n=922).
4A. Progressive disease. NETest 95% positive was compared CgA 57% (p<0.0001). 4B. Grade analysis by McNemar test of the relationship between the percentage positivity and Odd’s ratio for grades and NETest/CgA. The OR ranged was from 5.03 for G1 tumors (NETest positive: 63% vs. CgA-positive 33%) to 18.5 (TC: NETest positive 87% vs. 27% for CgA). Overall, the NETest (red circles) is 5-20x more accurate than CgA (blue circles) for grade. 4C. Metastasis assessment using the McNemar’s test. For no metastases, the OR was 3.9. NETest was elevated in 60% vs. 20% for CgA. For metastases, the OR was 8.4 (87% elevated NETest, 47% elevated CgA). Overall, the NETest (red circles) is 8x more accurate than CgA (blue circles) for identifying metastasis. AC = atypical carcinoid. BP = bronchopulmonary. CR = complete remission. NED = no evidence of disease. P = Pancreas. PD = progressive disease. SB = small bowel. SD = stable disease. TC = typical carcinoid. Mean±SEM. Dotted lines reflect 50% who are biomarker positive (horizontal line, 4B-C) and an OR of 1.0 (vertical line: 4B-C).
Figure 5.
Figure 5.. NETest and Prediction of Surgical Recurrence
5A. Surgical strategies. R0 and R1 surgery significantly decreased NETest levels (respectively *p<0.0001, **p<0.002). R0 NETest levels were significantly decreased (p<0.0001) compared to R1. R2 resection failed to decrease NETest levels 5B. Cohort 1, R0 percentage recurrence rate within 24 months. Of the 71 with a normal NETest, recurrence was 0% (0/71). Of the 31 with elevated NETest levels 25 (81%) recurred. 5C. Cohort 2, R0 percentage recurrence rate within 24 months. All nineteen (100%) with an elevated NETest recurred compared to 11% (2/19) with an elevated CgA. Mean±SEM. Black dotted line = upper limit of normal. POD0 = pre-operative NETest score; POD30 = post-operative day 30 NETest score.

References

    1. Perera FP, Weinstein IB. Molecular epidemiology: recent advances and future directions. Carcinogenesis 2000; 21: 517–524. - PubMed
    1. Hanahan D, Weinberg RA. Hallmarks of cancer: the next generation. Cell. 2011; 144: 646–674. doi: 10.1016/j.cell.2011.1002.1013. - DOI - PubMed
    1. Bodei L, Schöder H, Baum RP et al. Molecular profiling of neuroendocrine tumours to predict response and toxicity to peptide receptor radionuclide therapy. Lancet Oncol 2020; 21: e431–e443. - PMC - PubMed
    1. Oberg K, Modlin IM, De Herder W et al. Consensus on biomarkers for neuroendocrine tumour disease. Lancet Oncol. 2015; 16: e435–e446. doi: 410.1016/S1470-2045(1015)00186-00182. - DOI - PMC - PubMed
    1. Shah MH, Kulke MH, Goldner WS et al. NCCN Guidelines: Neuroendocrine and Adrenal Tumors, Version 3.2018 -Sept 11. In. 2018; 693–702. doi: 610.6004/jnccn.2018.0056. - DOI - PubMed

Publication types