Observational Study
. 2021 Dec:66:14-19.
doi: 10.1016/j.jcrc.2021.07.022. Epub 2021 Aug 12.

A radiological predictor for pneumomediastinum/pneumothorax in COVID-19 ARDS patients

Collaborators, Affiliations
Observational Study

A radiological predictor for pneumomediastinum/pneumothorax in COVID-19 ARDS patients

Diego Palumbo et al. J Crit Care. 2021 Dec.

Abstract

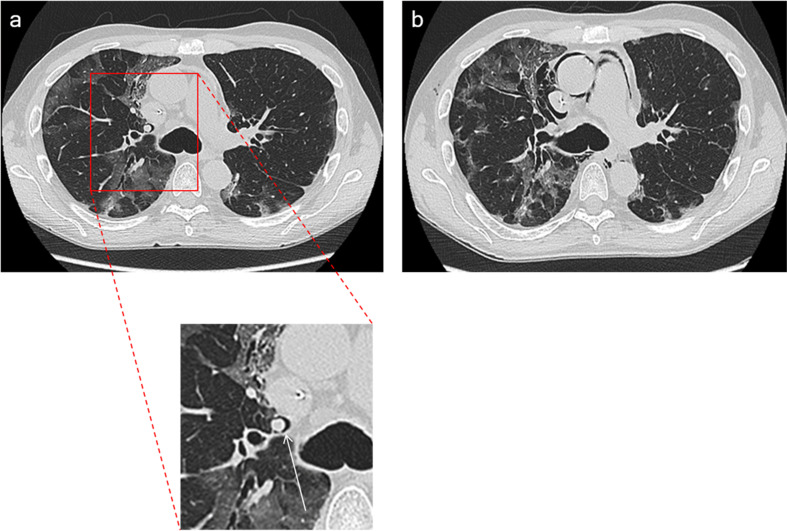
Purpose: To determine whether Macklin effect (a linear collection of air contiguous to the bronchovascular sheath) on baseline CT imaging is an accurate predictor for subsequent pneumomediastinum (PMD)/pneumothorax (PNX) development in invasively ventilated patients with COVID-19-related acute respiratory distress syndrome (ARDS).

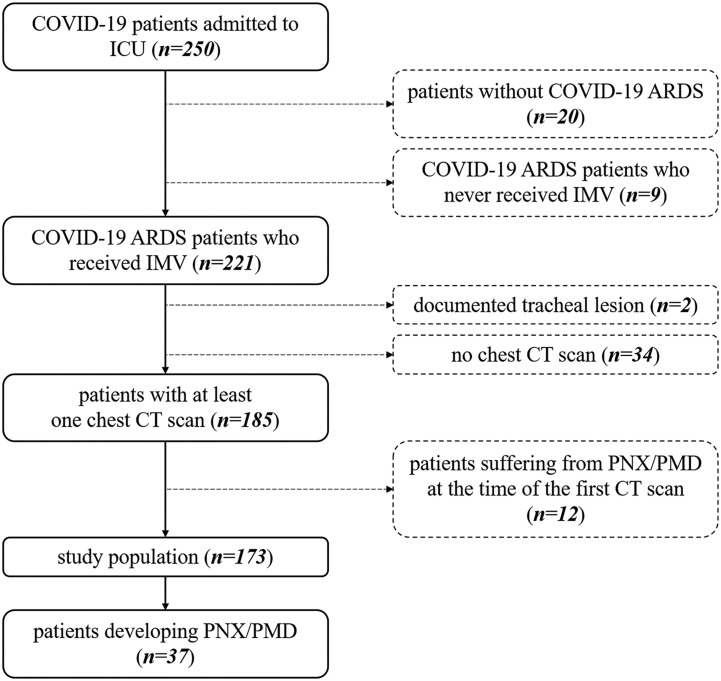
Materials and methods: This is an observational, case-control study. From a prospectively acquired database, all consecutive invasively ventilated COVID-19 ARDS patients who underwent at least one baseline chest CT scan during the study time period (February 25th, 2020-December 31st, 2020) were identified; those who had tracheal lesion or already had PMD/PNX at the time of the first available chest imaging were excluded.

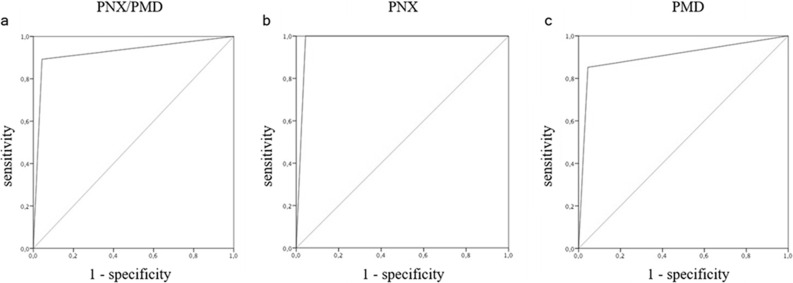
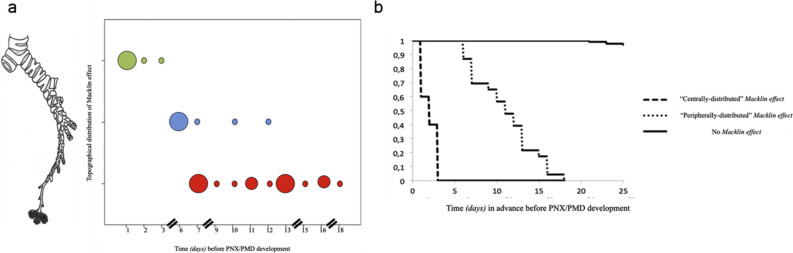
Results: 37/173 (21.4%) patients enrolled had PMD/PNX; specifically, 20 (11.5%) had PMD, 10 (5.8%) PNX, 7 (4%) both. 33/37 patients with subsequent PMD/PNX had Macklin effect on baseline CT (89.2%, true positives) 8.5 days [range, 1-18] before the first actual radiological evidence of PMD/PNX. Conversely, 6/136 patients without PMD/PNX (4.4%, false positives) demonstrated Macklin effect (p < 0.001). Macklin effect yielded a sensitivity of 89.2% (95% confidence interval [CI]: 74.6-96.9), a specificity of 95.6% (95% CI: 90.6-98.4), a positive predictive value (PV) of 84.5% (95% CI: 71.3-92.3), a negative PV of 97.1% (95% CI: 74.6-96.9) and an accuracy of 94.2% (95% CI: 89.6-97.2) in predicting PMD/PNX (AUC:0.924).

Conclusions: Macklin effect accurately predicts, 8.5 days in advance, PMD/PNX development in COVID-19 ARDS patients.

Keywords: Acute respiratory distress syndrome; COVID-19; Mechanical ventilation; Pneumomediastinum; Pneumothorax; Tomography, X-ray computed.


Conflict of interest statement

Declaration of Competing Interest None.

Figures

Fig. 1
Fig. 1
Inclusion and exclusion criteria flowchart. COVID-19: coronavirus disease 2019; ARDS: Acute Respiratory Distress Syndrome; IMV: invasive mechanical ventilation; CT: Computed Tomography; PMD: pneumomediastinum; PNX: pneumothorax.
Fig. 2
Fig. 2
Macklin effect in a mechanically ventilated COVID-19 patient. Lung parenchyma windowed CT images demonstrate [a] a crescent collection of air contiguous to the right upper lobar bronchovascular sheath (that is, Macklin effect – white arrow). Two days later [b], pneumomediastinum occurred.
Fig. 3
Fig. 3
Macklin effect accuracy. ROC curve analysis showing overall accuracy of the Macklin effect in predicting pneumothorax and/or pneumomediastinum [a] (AUC: 0.924), pneumothorax alone [b] (AUC: 0.978) and pneumomediastinum alone [c] (AUC: 0.904).
Fig. 4
Fig. 4
Topographical distribution of Macklin effect and temporal interval before pneumothorax/pneumomediastinum occurrence. [a] According to the bronchial order (lobar [green dots, upper line], segmental [blue dots, mid line] or subsegmental [red dots, lower line]) most adjacent to the Macklin effect observed, the smaller the bronchovascular sheath involved, the longer the temporal advance before pneumothorax/pneumomediastinum (p < 0.001, R = − 0.896). Each dot represents a patient with Macklin effect on baseline CT scan; larger dots means that multiple patients with Macklin effect share the same temporal advance before pneumothorax/pneumomediastinum development. [b] Kaplan Meier curve demonstrating statistically significant difference between patients with “centrally-distributed” Macklin effect and those with “peripherally-distributed” Macklin effect in terms of temporal interval before pneumothorax/pneumomediastinum occurrence. (For interpretation of the references to colour in this figure legend, the reader is referred to the web version of this article.)

References

    1. Lemmers D.H.L., Abu Hilal M., Bna C., et al. Pneumomediastinum and subcutaneous emphysema in COVID-19: barotrauma or lung frailty? ERJ Open Res. 2020;6(4) doi: 10.1183/23120541.00385-2020. - DOI - PMC - PubMed
    1. Belletti A., Palumbo D., Zangrillo A., et al. COVID-BioB Study Group Predictors of pneumothorax/pneumomediastinum in mechanically ventilated COVID-19 patients. J Cardiothorac Vasc Anesth. 2021 doi: 10.1053/j.jvca.2021.02.008. In press. - DOI - PMC - PubMed
    1. McGuinness G., Zhan C., Rosenberg N., et al. Increased incidence of barotrauma in patients with COVID-19 on invasive mechanical ventilation. Radiology. 2020;297(2):E252–E262. doi: 10.1148/radiol.2020202352. - DOI - PMC - PubMed
    1. Palumbo D., Belletti A., Campochiaro C., et al. COVID-BioB Study Group Pneumothorax/pneumomediastinum in non-intubated COVID-19 patients: differences between first and second Italian pandemic wave. Eur J Intern Med. 2021;88:144–146. doi: 10.1016/j.ejim.2021.03.018. - DOI - PMC - PubMed
    1. Martinelli A.W., Ingle T., Newman J., et al. COVID-19 and pneumothorax: a multicentre retrospective case series. Eur Respir J. 2020;56(5) doi: 10.1183/13993003.02697-2020. - DOI - PMC - PubMed

Publication types