. 2022 Jan;16(1):148-165.
doi: 10.1002/1878-0261.13083. Epub 2021 Aug 29.

Prolonged estrogen deprivation triggers a broad immunosuppressive phenotype in breast cancer cells

Affiliations

Prolonged estrogen deprivation triggers a broad immunosuppressive phenotype in breast cancer cells

Daniela Hühn et al. Mol Oncol. 2022 Jan.

Abstract

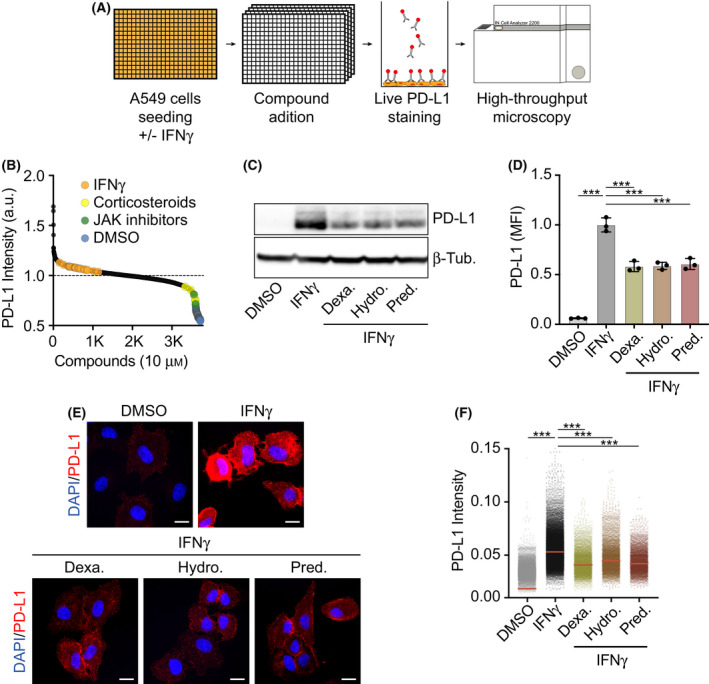
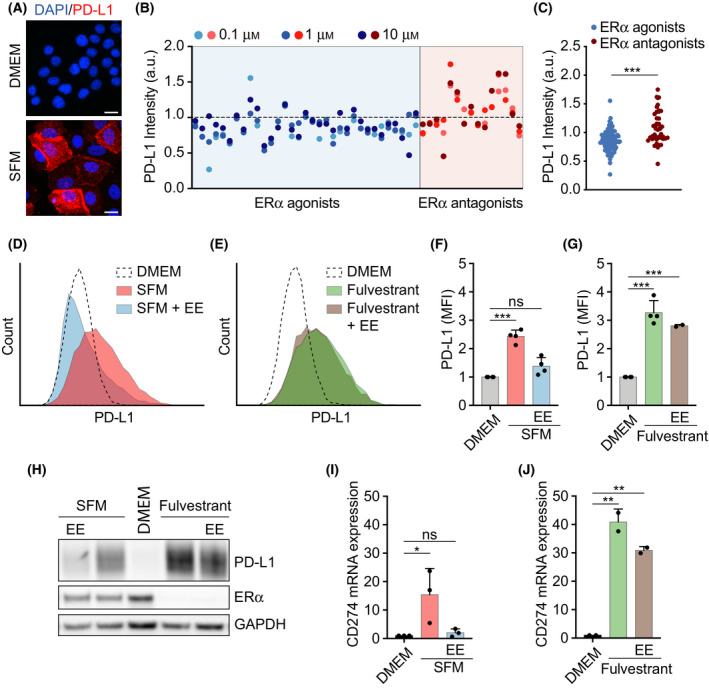
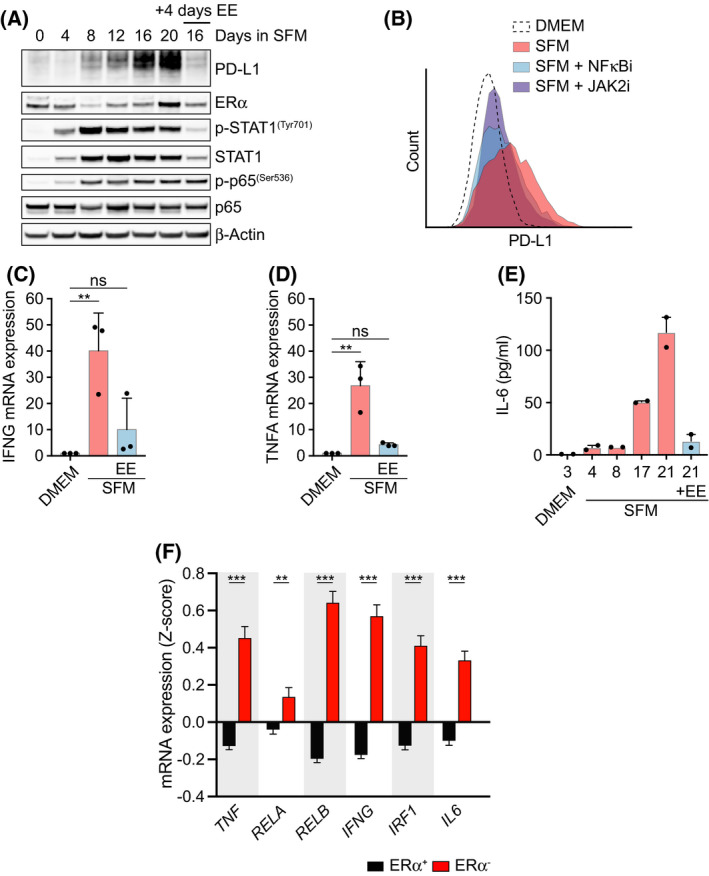
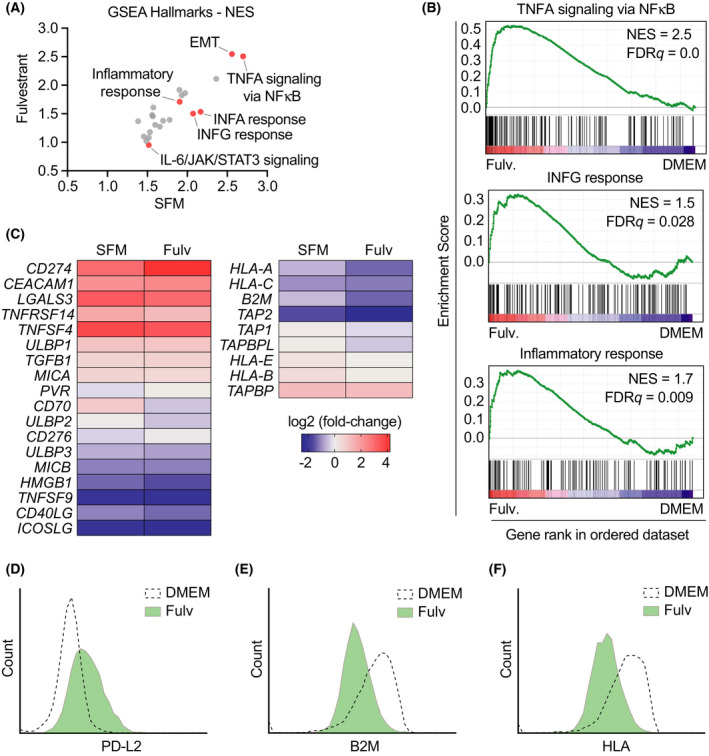
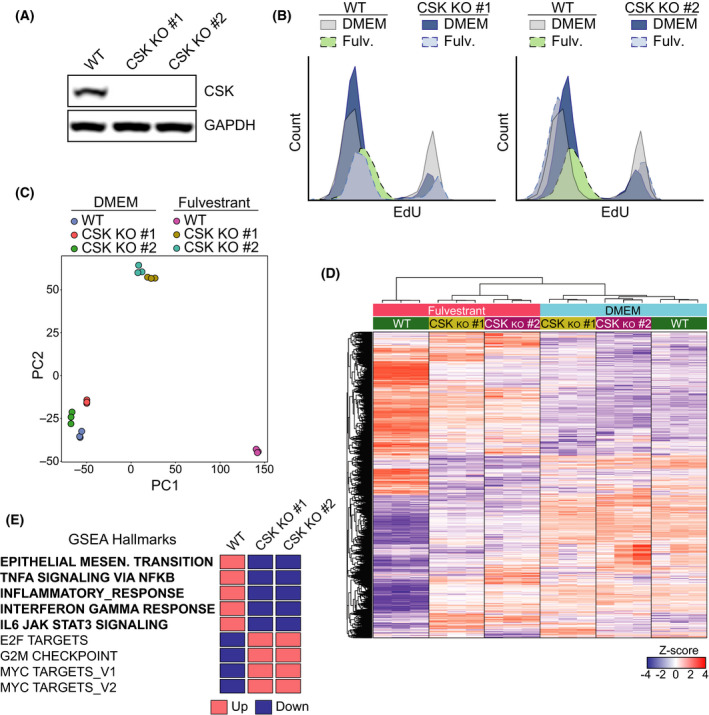
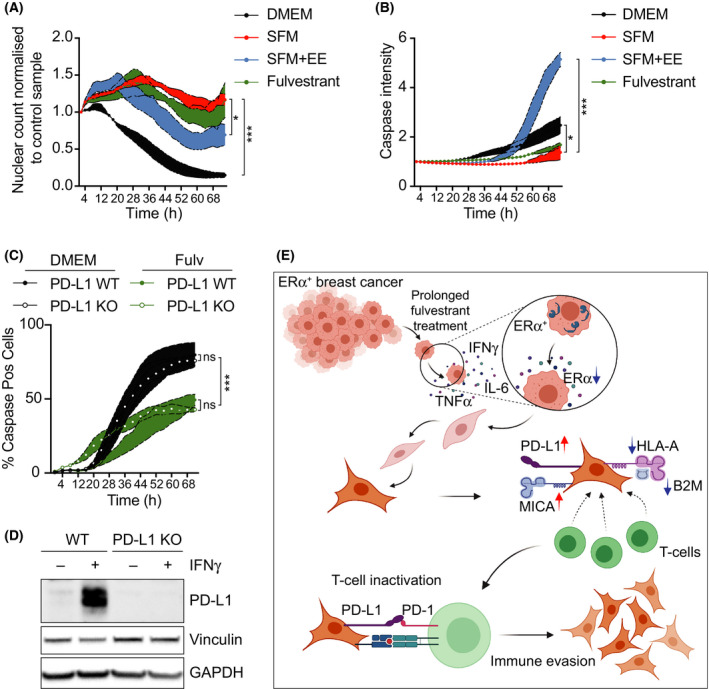
Among others, expression levels of programmed cell death 1 ligand 1 (PD-L1) have been explored as biomarkers of the response to immune checkpoint inhibitors in cancer therapy. Here, we present the results of a chemical screen that interrogated how medically approved drugs influence PD-L1 expression. As expected, corticosteroids and inhibitors of Janus kinases were among the top PD-L1 downregulators. In addition, we identified that PD-L1 expression is induced by antiestrogenic compounds. Transcriptomic analyses indicate that chronic estrogen receptor alpha (ERα) inhibition triggers a broad immunosuppressive program in ER-positive breast cancer cells, which is subsequent to their growth arrest and involves the activation of multiple immune checkpoints together with the silencing of the antigen-presenting machinery. Accordingly, estrogen-deprived MCF7 cells are resistant to T-cell-mediated cell killing, in a manner that is independent of PD-L1, but which is reverted by estradiol. Our study reveals that while antiestrogen therapies efficiently limit the growth of ER-positive breast cancer cells, they concomitantly trigger a transcriptional program that favors their immune evasion.

Keywords: HLA; PD-L1; breast cancer; estrogen receptor; immunotherapy; inflammation.


Conflict of interest statement

The authors declare no conflict of interest.

Figures

Fig. 1
Fig. 1
Evaluating the effect of medically approved drugs on IFN‐γ‐induced PD‐L1 expression. (A) Overview of the phenotypic screen workflow. Briefly, A549 cells were seeded in 100 ng·mL−1 IFN‐γ 24 h before addition of 4216 compounds at 10 μm. After 24 h of compound exposure, cells were stained with an anti‐PD‐L1 antibody conjugated to phycoerythrin and fixed with formaldehyde. Nuclei were stained with Hoechst, and the immunofluorescences were analyzed by HTM. (B) Hit distribution of the screen described in (A) illustrating the enrichment of JAK inhibitors and corticosteroids among the compounds reducing PD‐L1 signal in HTM. PD‐L1 levels in wells with only IFN‐γ and negative controls (DMSO) are also shown to illustrate the window of the assay. (C) Western blot illustrating the levels of PD‐L1 in A549 cells grown in the presence of DMSO as control or 100 ng·mL−1 IFN‐γ 24 h before addition of hydrocortisone (10 μm), prednisolone (10 μm), or dexamethasone (10 μm), for 24 h. β‐Tubulin levels are shown for loading control. (D) Quantification of flow cytometry‐mediated assessment of surface PD‐L1 levels in A549 cells after 24 h of control or compound exposure (treated as in (C)). Mean Fluorescence Intensity (MFI) values are relative to those observed in the control. One‐way ANOVA (n = 3) was used for statistical analysis ***P < 0.001, error bars indicate ± SD. (E) Representative immunofluorescence images of PD‐L1 (red) in A549 cells cultured in the presence or absence of IFN‐γ and the indicated compounds (treated as in (C)), nuclei are shown in blue. Scale bar (white), 5 μm. (F) HTM‐based quantification of PD‐L1 levels in A549 cells treated as in (C). One‐way ANOVA test (n = 3) was used to calculate statistical significance of the differences between groups, ***P < 0.001. All datapoints represent single‐cell measurements, with the horizontal red line indicating the median.
Fig. 2
Fig. 2
Estrogen‐dependent suppression of PD‐L1 expression in ER+ BC cells. (A) Immunofluorescence of PD‐L1 (red) in MCF7 cells cultured in normal or steroid‐free medium (SFM) for 15 days. DAPI (blue) was used to stain DNA. Representative images are shown. Scale bar (white), 5 μm. (B) Scatterplot of PD‐L1 intensity levels in SFM‐grown MCF7 cells treated with ERα agonists or antagonists, screened at three concentrations, 0.1, 1.0, and 10 µm. (C) Grouped comparison of PD‐L1 levels in response to ERα agonists and ERα antagonists from the experiment shown in (B) using a two‐tailed Student t‐test. (D, E) Flow cytometry‐mediated assessment of surface PD‐L1 levels in MCF7 cells grown in DMEM, SFM (D), or DMEM containing 1 μm fulvestrant (Fulv) (E) for 14 days. Where indicated, EE (10 nm) was added for the final 3 days. (F,G) Quantification of 4 independent flow cytometric experiments as shown in (D, E). Mean fluorescent intensity (MFI) values are relative to those observed in the control. Data represent the mean ± SD, ***P < 0.001 calculated by one‐way ANOVA. (H) Western blot illustrating the levels of PD‐L1 and ERα of MCF7 cells cultured as in (D, E). GAPDH levels are shown for loading control. (I, J) qRT‐PCR analysis of PD‐L1 (CD274) expression in MCF7 cells cultured in DMEM and SFM (n = 3 in I) or 1 μm fulvestrant (n = 2 in J) for 18 days. Where indicated, media were supplemented with EE (10 nm) for the last 3 days. 18S RNA served as an internal control. Data represent the mean ± SD, statistical significance was determined by one‐way ANOVA. *P < 0.05; **P < 0.01; ***P < 0.001.
Fig. 3
Fig. 3
Estrogen signaling suppresses an inflammatory phenotype in MCF7 cells. (A) Whole‐cell lysates from MCF7 cells cultured in SFM for the specified days were analyzed by WB using the indicated antibodies. Where indicated, 10 nm EE was added at 16 days for the final 4 days. Total p65 and β‐Actin served as loading controls. (B) Flow cytometry‐mediated evaluation of PD‐L1 membrane levels in MCF7 cells grown in DMEM or SFM for 21 days, alone or in combination with the NF‐kB inhibitor CAPE (10 μm) or JAK2 inhibitor CEP‐33779 (10 μm) for the last 3 days. Representative data from 3 experiments are shown. (C, D) qRT‐PCR analysis (n = 3) of IFN‐γ (IFNG) (C) or TNF‐α (TNFA) (D) mRNA levels in MCF7 cells cultured as in (A). 18S rRNA was used as an internal control. (E) Levels of IL‐6 in the supernatant of MCF7 cells cultured in DMEM or SFM for the specified days as measured in duplicates by LEGENDplex‐FACS (see Materials and methods). Where indicated, EE (10 nm) was added at day 17 for the last 4 days. (F) TNF, RELA, RELB, IFNG, IRF1, and IL6 mRNA expression levels in ERα+ (n = 1459) and ERα (n = 445) patient samples. Normalized Z‐scores were extracted from the METABRIC dataset [22]. Data are presented as mean ± SEM, and two‐tailed Student's t‐test was used to calculate the statistical significance. **P < 0.01 and ***P < 0.001.
Fig. 4
Fig. 4
Estrogen deprivation drives expression of immune checkpoints together with silencing of the antigen‐presenting machinery. (A) GSEA hallmark gene sets ranked by normalized enrichment score (NES) comparing the transcriptional programs triggered by 3‐week treatments with fulvestrant (1 μm) or SFM in MCF7 cells, both normalized to DMEM (n = 3 biological replicates). Selected hallmarks are indicated in red. (B) Preranked GSEA on the genes from the hallmarks ‘TNFA signaling via NF‐κB’, ‘IFNG response’, and ‘inflammatory response’ obtained from RNAseq analysis comparing the transcriptome of MCF7 cells grown in DMEM or fulvestrant (1 μm) for 3 weeks. The heatmap representation illustrates the overall upregulation of these pathways in estrogen‐deprived MCF7 cells. (C) Representation of the expression of selected mRNAs related to immune checkpoints (left) and antigen‐presenting machinery (right), comparing the levels in SFM‐ or fulvestrant‐treated cells vs DMEM (as in (A)). (D–F) Flow cytometry‐mediated assessment of PD‐L2 (D), B2M (E), and HLA (F) levels in MCF7 cells grown in DMEM or fulvestrant (1 μm) for 14 days. Note that the antibody that was used for HLA detects 3 isoforms (HLA‐A, HLA‐B, and HLA‐C). Representative results out of three experiments are shown.
Fig. 5
Fig. 5
CSK‐dependent growth arrest mediates activation of the inflammatory phenotype in MCF7 cells. (A) Western blot illustrating the loss of CSK expression in 2 independent clones of CSK‐deficient MCF7 generated by CRISPR/Cas9. GAPDH is added as a loading control. (B) Flow cytometric data illustrating the growth arrest that is observed in WT MCF7 cells grown in fulvestrant for 20 days. Two clones of CSK‐deficient cells continue to incorporate EdU in the same conditions. (C) Principal component analysis (PCA) plot of an RNAseq experiment where the transcriptome of two independent MCF7 CSKko clones grown in DMEM with or without fulvestrant (1 μm) for 20 days was compared. The PCA plot was based on normalized gene counts after filtering for low‐expressed genes. (D) Heatmap and clustering of genes from the experiment defined in (C). The genes shown in the heatmap are genes that were found significantly regulated in any of the comparisons. Each gene (row) is standardized (z‐score) to mean = 0 and sd = 1 and then clustered by hierarchical clustering. Note that the fulvestrant‐induced changes in WT MCF7 cells are significantly milder in CSK‐deficient cells. (E) Impact of CSK deficiency on fulvestrant‐dependent expression of genes related to specific GSEA pathways from the experiment defined in (C). The full GSEA is provided in Table S4.
Fig. 6
Fig. 6
Estrogen signaling inhibition limits T‐cell‐mediated killing of MCF7 cells. (A) Live cell imaging of nuclei count from MCF7 cells after addition of activated primary T lymphocytes isolated from human peripheral blood. Nuclei counts were normalized to the value at time = 0 h for each condition, and then, each timepoint was subsequently normalized to the value of the control to which no T cells were added. (B) Time‐lapse microscopy of the intensity of a fluorescently labeled caspase‐3/7 substrate in MCF7 cells exposed to activated primary T cells. (C) Time‐lapse microscopy of the intensity of a fluorescently labeled caspase‐3/7 substrate in wild‐type (WT) or PD‐L1‐deficient (PD‐L1 KO) MCF7 cells exposed to activated primary T cells. (A–C) For these experiments, indicated cells were grown in normal media, SFM or fulvestrant (1 μm) for 2 weeks, prior to the addition of the activated T cells. Where indicated, EE (10 nm) was added for the last 3 days. One‐way ANOVA for (A, B) and two‐way ANOVA for (C) analyses were used to calculate the statistical significance of the differences between groups. All datapoints indicate mean values (n = 3) ± SEM (colored boundary). *P < 0.05 and ***P < 0.001. (D) Western blot illustrating the levels of PD‐L1 in WT and PD‐L1‐deficient MCF7 cells used in (C). Cells were treated with IFN‐γ to stimulate PD‐L1 expression. Vinculin and GAPDH levels are shown as loading controls. (E) Graphical summary of our work depicting that under prolonged hormone therapy, ER+ BC cells activate an inflammatory transcriptional program, which includes a generalized upregulation of immune checkpoint mediators together with the downregulation of the antigen‐presenting machinery. Hence, while hormone therapies efficiently arrest the growth of ER+ BC cells, they also promote a phenotype switch that favors their immune evasion.

References

    1. Bray F, Ferlay J, Soerjomataram I, Siegel RL, Torre LA & Jemal A (2018) Global cancer statistics 2018: GLOBOCAN estimates of incidence and mortality worldwide for 36 cancers in 185 countries. CA Cancer J Clin 68, 394–424. - PubMed
    1. Prall OW, Rogan EM & Sutherland RL (1998) Estrogen regulation of cell cycle progression in breast cancer cells. J Steroid Biochem Mol Biol 65, 169–174. - PubMed
    1. Siersbaek R, Kumar S & Carroll JS (2018) Signaling pathways and steroid receptors modulating estrogen receptor alpha function in breast cancer. Genes Dev 32, 1141–1154. - PMC - PubMed
    1. Osborne CK & Schiff R (2011) Mechanisms of endocrine resistance in breast cancer. Annu Rev Med 62, 233–247. - PMC - PubMed
    1. Schmid P, Adams S, Rugo HS, Schneeweiss A, Barrios CH, Iwata H, Dieras V, Hegg R, Im SA, Shaw Wright G et al. (2018) Atezolizumab and Nab‐paclitaxel in advanced triple‐negative breast cancer. N Engl J Med 379, 2108–2121. - PubMed

Publication types