. 2021;77(1):16.
doi: 10.1186/s41118-021-00123-9. Epub 2021 Aug 9.

Assessing excess mortality in times of pandemics based on principal component analysis of weekly mortality data-the case of COVID-19

Affiliations

Assessing excess mortality in times of pandemics based on principal component analysis of weekly mortality data-the case of COVID-19

Patrizio Vanella et al. Genus. 2021.

Abstract

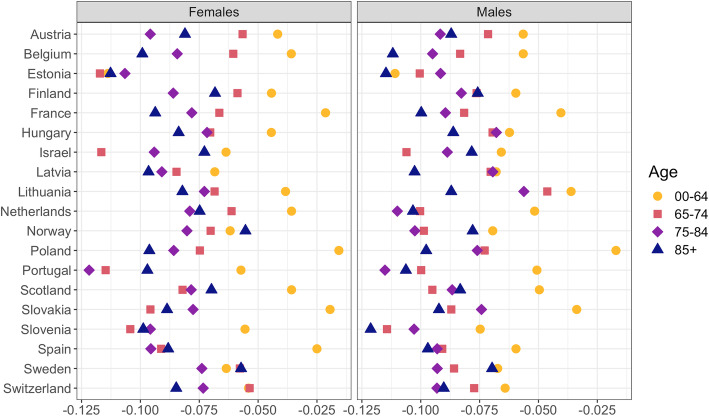
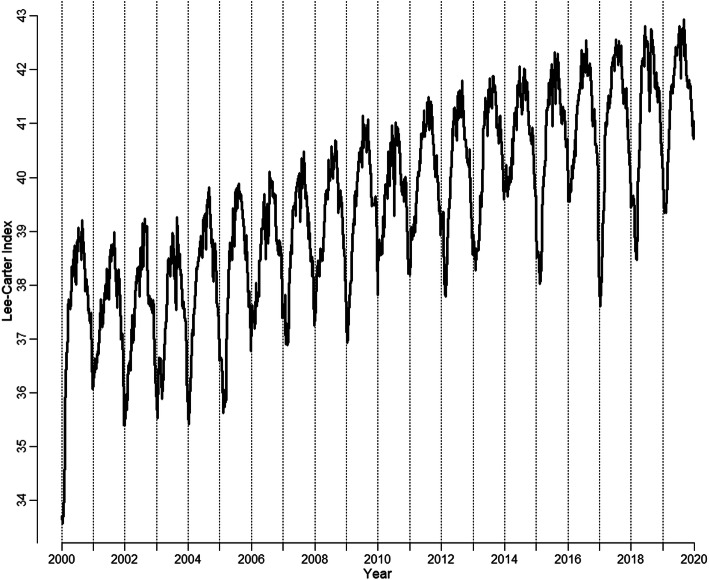
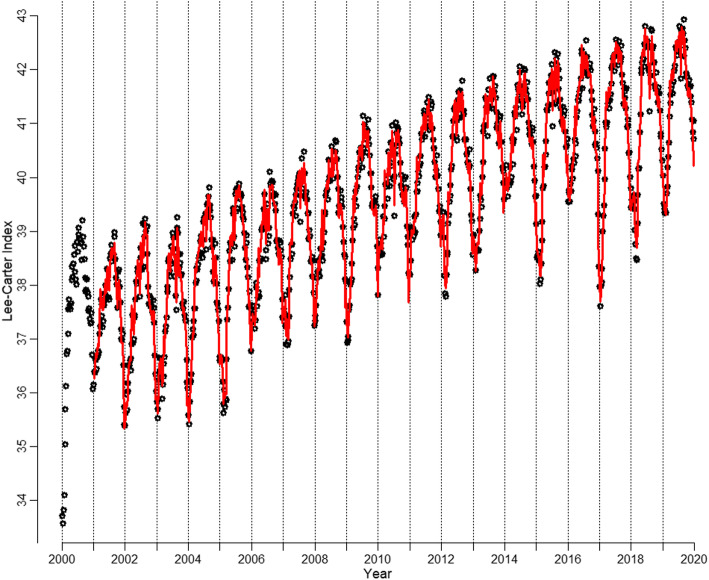
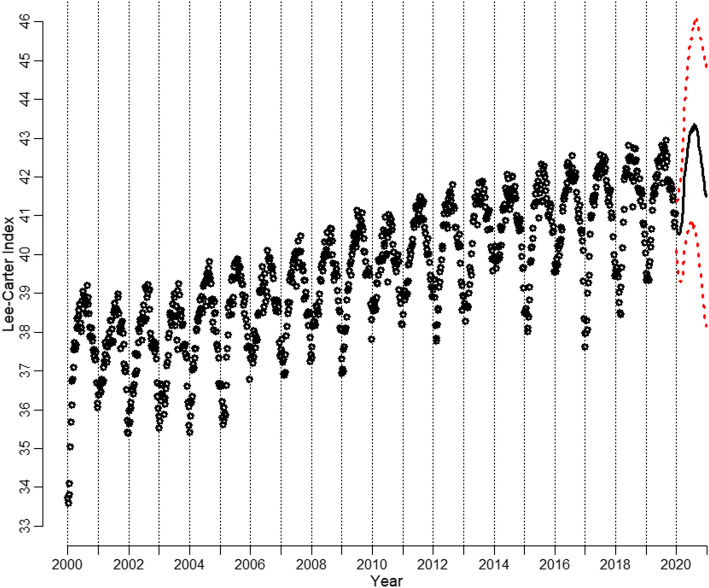
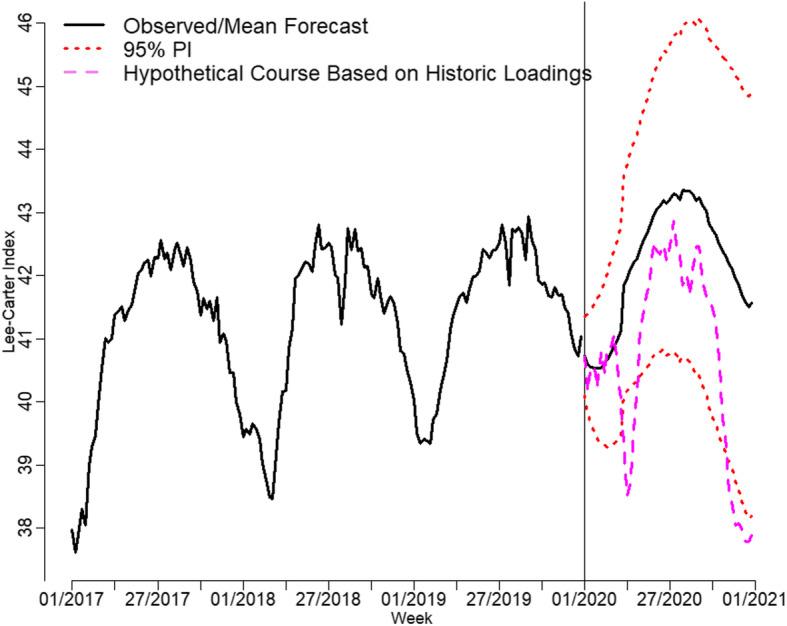
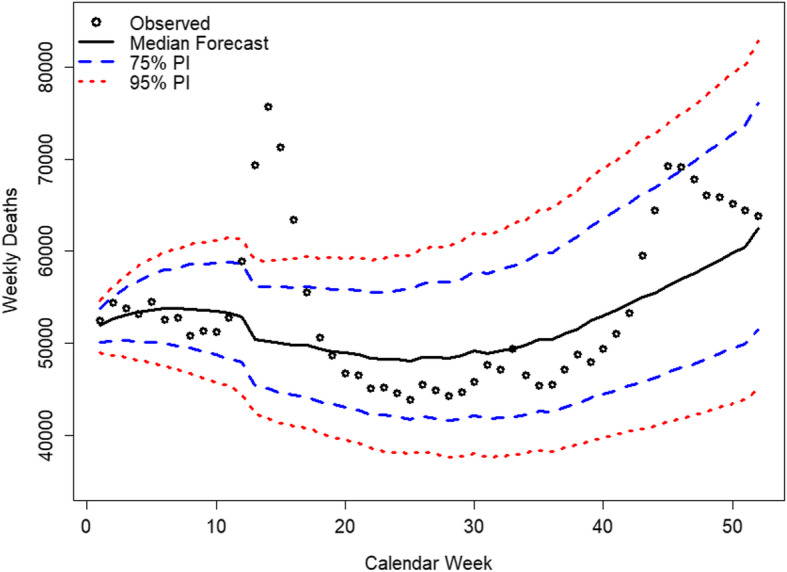
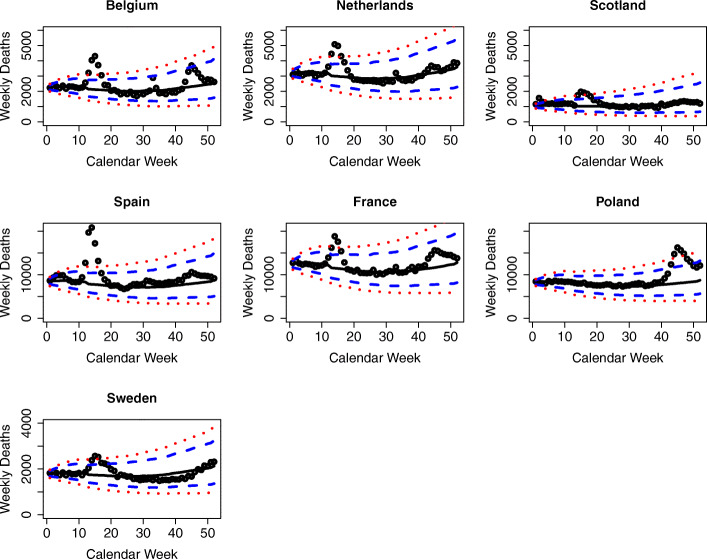
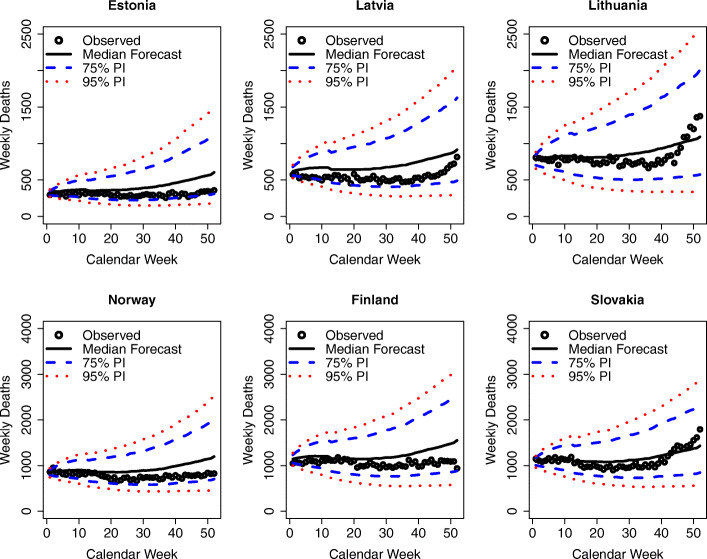
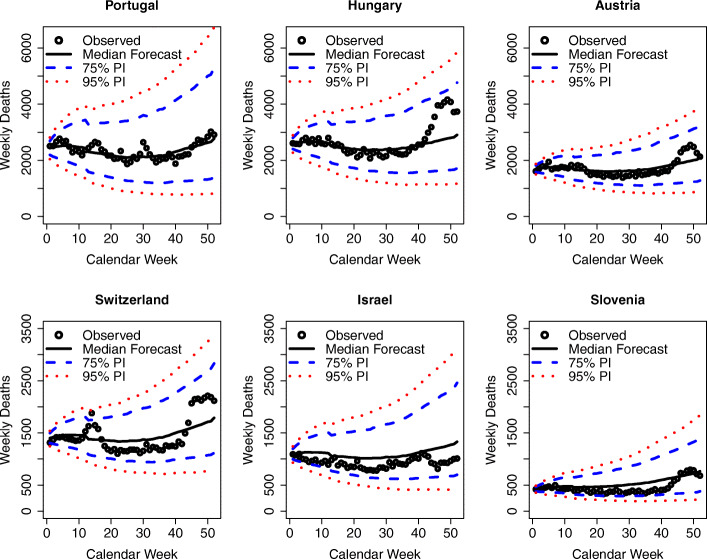
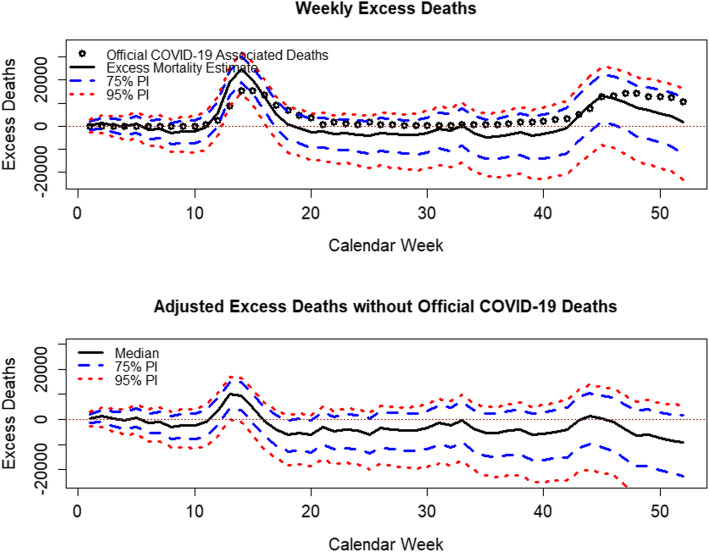
The COVID-19 outbreak has called for renewed attention to the need for sound statistical analyses to monitor mortality patterns and trends over time. Excess mortality has been suggested as the most appropriate indicator to measure the overall burden of the pandemic in terms of mortality. As such, excess mortality has received considerable interest since the outbreak of COVID-19 began. Previous approaches to estimate excess mortality are somewhat limited, as they do not include sufficiently long-term trends, correlations among different demographic and geographic groups, or autocorrelations in the mortality time series. This might lead to biased estimates of excess mortality, as random mortality fluctuations may be misinterpreted as excess mortality. We propose a novel approach that overcomes the named limitations and draws a more realistic picture of excess mortality. Our approach is based on an established forecasting model that is used in demography, namely, the Lee-Carter model. We illustrate our approach by using the weekly age- and sex-specific mortality data for 19 countries and the current COVID-19 pandemic as a case study. Our findings show evidence of considerable excess mortality during 2020 in Europe, which affects different countries, age, and sex groups heterogeneously. Our proposed model can be applied to future pandemics as well as to monitor excess mortality from specific causes of death.

Keywords: COVID-19 pandemic; Cross-country mortality trends; Demography; Epidemiology; Excess mortality assessment; Monte Carlo simulation; Mortality forecasting; Principal component analysis; Stochasticity; Time series analysis.


Conflict of interest statement

Competing interestsThe authors declare that they have no competing interests.

Figures

Fig. 1
Fig. 1
Loadings of principal component 1
Fig. 2
Fig. 2
Past course of the Lee-Carter Index
Fig. 3
Fig. 3
Course of the Lee-Carter Index for 2000–2019 with model fit
Fig. 4
Fig. 4
Historic course of the Lee-Carter Index with median forecast and 95% prediction intervals
Fig. 5
Fig. 5
Forecast of Lee-Carter Index for 2020 with 95% PIs and actual course
Fig. 6
Fig. 6
Observed and predicted weekly deaths in 2020 for the 19 study countries. Sources: Human Mortality Database (2021); Computations and design by the authors
Fig. 7
Fig. 7
Observed and predicted weekly deaths in 2020 by country for countries with statistically significant excess mortality. Sources: Human Mortality Database (2021); Computations and design by the authors
Fig. 8
Fig. 8
Observed and predicted weekly deaths in 2020 by country for the Northern European Countries without statistically significant excess mortalities. Sources: Human Mortality Database (2021); Computations and design by the authors
Fig. 9
Fig. 9
Observed and predicted weekly deaths in 2020 by country for the remaining countries without statistically significant excess mortalities. Sources: Human Mortality Database (2021); Computations and design by the authors
Fig. 10
Fig. 10
Excess mortality distribution with official COVID-19-associated deaths by calendar week for 18 study countries. Sources: European Centre for Disease Prevention and Control (2021a); Human Mortality Database (2021); Computations and design by the authors
Fig. 11
Fig. 11
Cosine function with amplitude 1 and period 2π
Fig. 12
Fig. 12
Cosine with amplitude 1 and period 52
Fig. 13
Fig. 13
Cosine function with amplitude 1.34 and period 52
Fig. 14
Fig. 14
Observed and predicted weekly sex-specific deaths in 2020 for the 19 study countries and by age group below 75 years, Sources: Human Mortality Database (2021); Own computation and design
Fig. 15
Fig. 15
Observed and predicted weekly sex-specific deaths in 2020 for the 19 study countries and by age group above 74 years. Sources: Human Mortality Database (2021); Own computation and design
Fig. 16
Fig. 16
Observed and predicted weekly death numbers in 2020 in Spain by sex and age below 75 years of age. Sources: Human Mortality Database (2021); Computations and design by the authors
Fig. 17
Fig. 17
Observed and predicted weekly death numbers in 2020 in Spain by sex and age above 74 years of age. Sources: Human Mortality Database (2021); Computations and design by the authors

References

    1. Aburto, J. M., Schöley, J., Kashnitsky, I., Zhang, L., Rahal, C., Missov, T. I., . . . Kashyap, R. (2021). Quantifying impacts of the COVID-19 pandemic through life expectancy losses: a population-level study of 29 countries. medRxiv. doi:10.1101/2021.03.02.21252772 - DOI - PMC - PubMed
    1. Antonio K, Bardoutsos A, Ouburg W. Bayesian Poisson log-bilinear models for mortality projections with multiple populations. European Actuarial Journal. 2015;5(2):245–281. doi: 10.1007/s13385-015-0115-6. - DOI
    1. Backhaus A. Common pitfalls in the interpretation of COVID-19 data and statistics. Intereconomics. 2020;55(3):162–166. doi: 10.1007/s10272-020-0893-1. - DOI - PMC - PubMed
    1. Bell WR, Monsell BC. Using principal components in time series modeling and forecasting of age-specific mortality rates. In: A. S. Association, editor. Proceedings of the social statistics section. Alexandria: American Statistical Association; 1991. pp. 154–159.
    1. Bergeron-Boucher M-P, Canudas-Romo V, Oeppen J, Vaupel JW. Coherent forecasts of mortality with compositional data analysis. Demographic Research. 2017;37(17):527–566. doi: 10.4054/DemRes.2017.37.17. - DOI

LinkOut - more resources