. 2021 Jan 31;17(1):37-45.
doi: 10.6026/97320630017037. eCollection 2021.

Effect of environmental, economic and health factors on CoVid-19 transmission

Affiliations

Effect of environmental, economic and health factors on CoVid-19 transmission

Sobia Anam et al. Bioinformation. .

Abstract

The severe acute respiratory syndrome (SARS) is affected by meteorological parameters such as temperature and humidity. It is also observed that people having asthma are at risk for SARS. Therefore, it is of interest to report the effect of environmental, economic, and health factors on the spread of CoVid-19. We used data reporting CoVid-19 cases from 24 cities in eight different countries for this analysis. Data was analyzed using multiple linear regressions between these parameters. Data shows that temperature has effects on CoVid-19. A one-degree rise in temperature causes a -0.19 decrease in CoVid-19 cases per million people (log natural value per million populations). The effect of humidity is not significant at a p value of 0.26. Moreover, one-unit increase in asthma and GDP cases per million people show 0.06 and 0.46 increases in CoVid-19 cases, respectively.

Keywords: CoVid-19 cases per million population; GDP; SPSS; asthma; humidity; multiple regression; pearson correlation; temperature.


Figures

Figure 1
Figure 1
This figure shows the steps that are followed in methodology that data is retrieved and processed via three methods and ledto outcome.
Figure 2
Figure 2
The correlation between the temperature (X) in Celsius and CoVid-19case per million population with log natural (Y), and it infers that a moderate negative correlation, which means there is a tendency for high X values to go with low Y values and vice versa.
Figure 3
Figure 3
The correlation between the Humidity (X) and CoVid-19case per million populations with log natural (Y), which infers that technically it is a negative correlation, the relationship between X and Y- is only weak.
Figure 4
Figure 4
The correlation between the Asthma cases per million populations (X) and CoVid-19case per million population with log natural (Y), it infers that technically it is a positive correlation, the relationship between X and Y cases is weak is only weak.
Figure 5
Figure 5
The correlation between the GDP per million populations with log natural (X) and CoVid-19case per million populations with log natural (Y), it concludes that technically it is a positive correlation, the relationship between X and Y is weak.
Figure 6
Figure 6
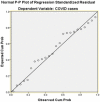
Normal P-P plot of Regression Standardized Residual Dependent variable CoVid-19cases, normal probability plot is showing that every variable in the regression model is normally distributed, and free from univariate outliers.
Figure 7
Figure 7
Scatter plot of standardized residuals against standardized predicted values represented that the assumptions of homo scedasticity, normality, and linearity of residuals were met.
Figure 8
Figure 8
The association between actual and predicted value of CoVid-19cases per million populations (in log natural) per city.
Figure 9
Figure 9
The given python code is used for multiple regressions.

References

    1. https://www.who.int/
    1. https://coronavirus.jhu.edu/map.html.
    1. Sohrabi C, et al. International Journal of Surgery . 2020;76:71. - PMC - PubMed
    1. Wallis P, Nerlich B. Social Science and Medicine . 2005;60:2629. - PMC - PubMed
    1. Tan J, et al. Journal of Epidemiology and Community Health. 2005;59:186. - PMC - PubMed

LinkOut - more resources