. 2021 Jul 28:12:707119.
doi: 10.3389/fphys.2021.707119. eCollection 2021.

Effects of Lung Injury on Regional Aeration and Expiratory Time Constants: Insights From Four-Dimensional Computed Tomography Image Registration

Affiliations

Effects of Lung Injury on Regional Aeration and Expiratory Time Constants: Insights From Four-Dimensional Computed Tomography Image Registration

Jacob Herrmann et al. Front Physiol. .

Abstract

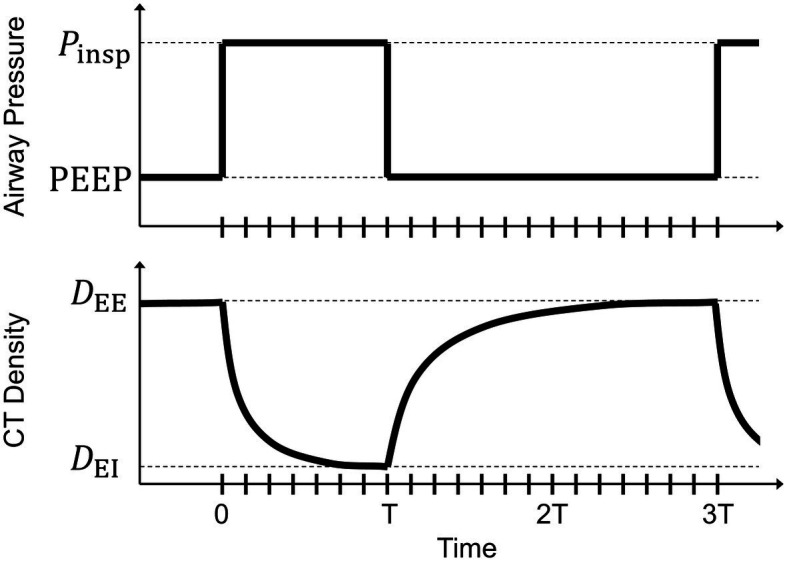
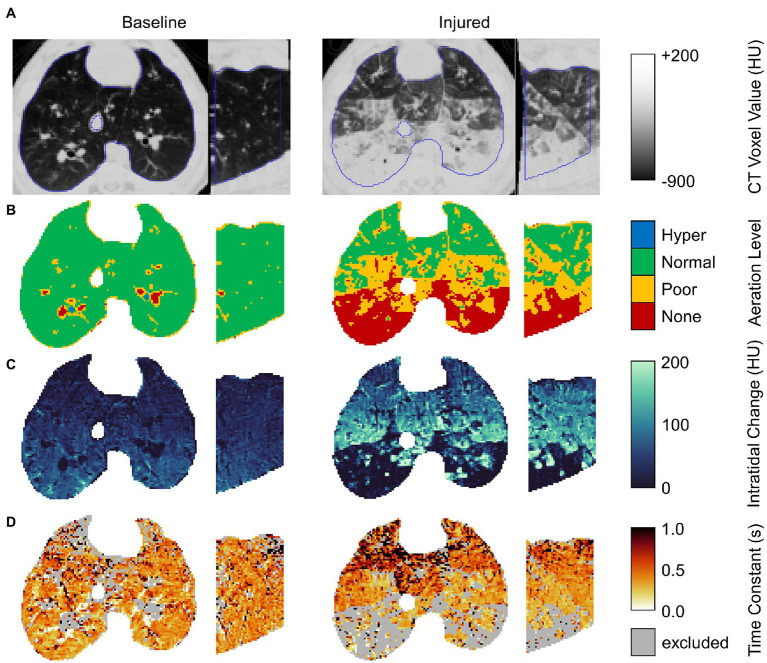
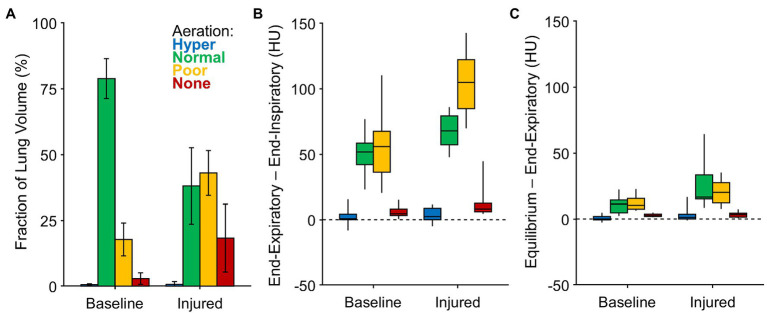
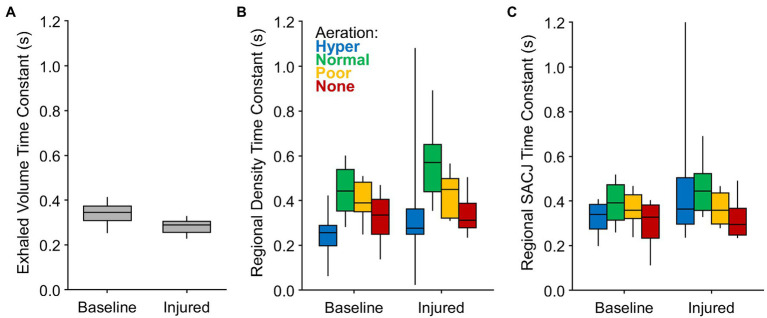
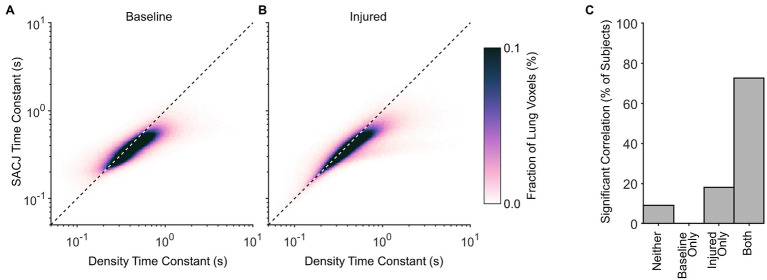
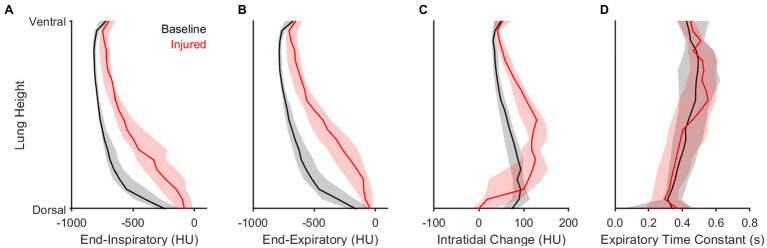
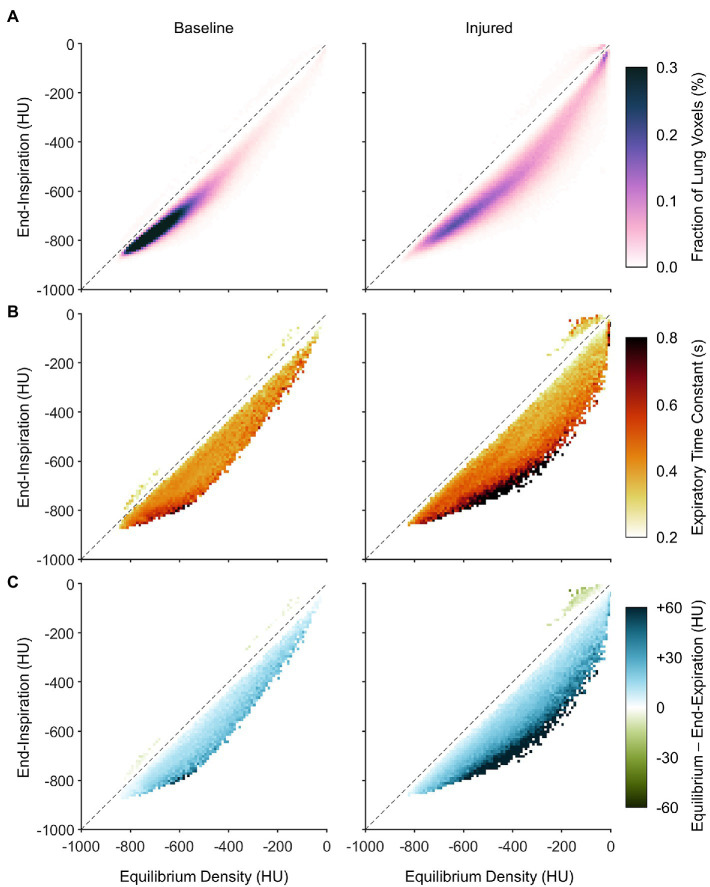
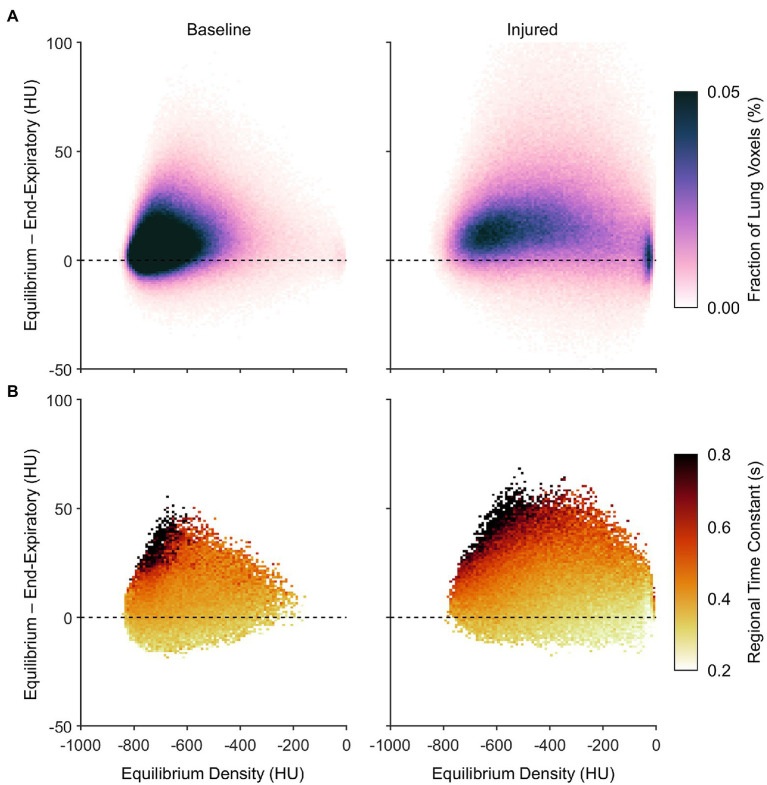
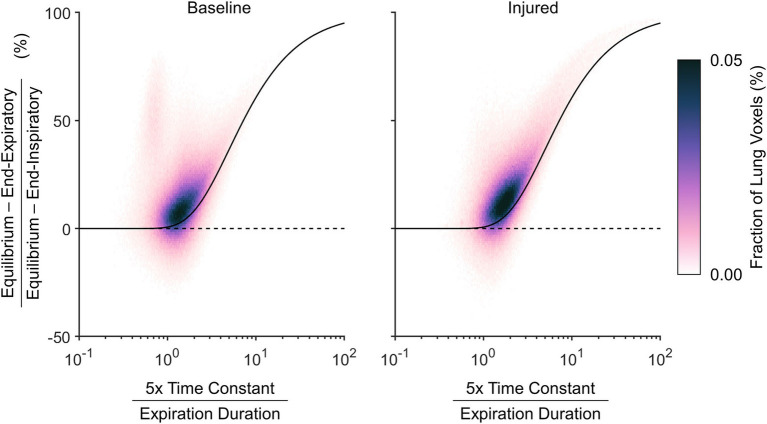
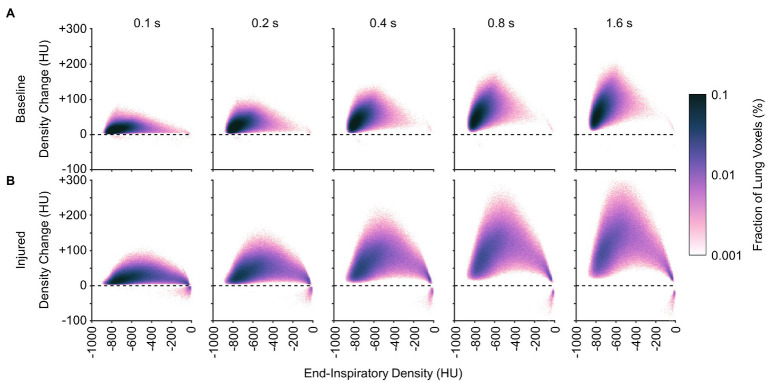
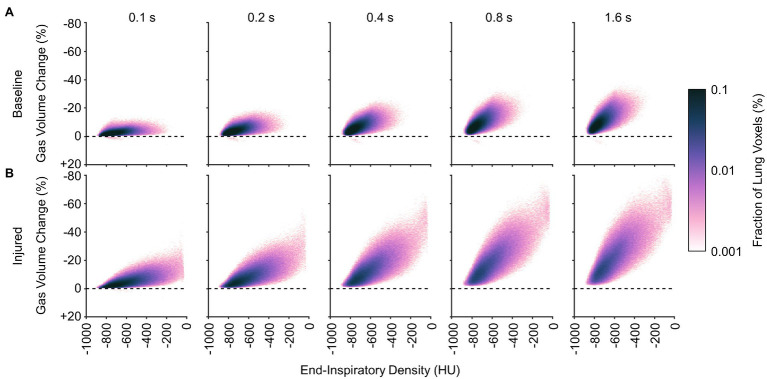
Rationale: Intratidal changes in regional lung aeration, as assessed with dynamic four-dimensional computed tomography (CT; 4DCT), may indicate the processes of recruitment and derecruitment, thus portending atelectrauma during mechanical ventilation. In this study, we characterized the time constants associated with deaeration during the expiratory phase of pressure-controlled ventilation in pigs before and after acute lung injury using respiratory-gated 4DCT and image registration. Methods: Eleven pigs were mechanically ventilated in pressure-controlled mode under baseline conditions and following an oleic acid model of acute lung injury. Dynamic 4DCT scans were acquired without interrupting ventilation. Automated segmentation of lung parenchyma was obtained by a convolutional neural network. Respiratory structures were aligned using 4D image registration. Exponential regression was performed on the time-varying CT density in each aligned voxel during exhalation, resulting in regional estimates of intratidal aeration change and deaeration time constants. Regressions were also performed for regional and total exhaled gas volume changes. Results: Normally and poorly aerated lung regions demonstrated the largest median intratidal aeration changes during exhalation, compared to minimal changes within hyper- and non-aerated regions. Following lung injury, median time constants throughout normally aerated regions within each subject were greater than respective values for poorly aerated regions. However, parametric response mapping revealed an association between larger intratidal aeration changes and slower time constants. Lower aeration and faster time constants were observed for the dependent lung regions in the supine position. Regional gas volume changes exhibited faster time constants compared to regional density time constants, as well as better correspondence to total exhaled volume time constants. Conclusion: Mechanical time constants based on exhaled gas volume underestimate regional aeration time constants. After lung injury, poorly aerated regions experience larger intratidal changes in aeration over shorter time scales compared to normally aerated regions. However, the largest intratidal aeration changes occur over the longest time scales within poorly aerated regions. These dynamic 4DCT imaging data provide supporting evidence for the susceptibility of poorly aerated regions to ventilator-induced lung injury, and for the functional benefits of short exhalation times during mechanical ventilation of injured lungs.

Keywords: computed tomography; image registration; mechanical ventilation; respiratory mechanics; ventilator-induced lung injury.


Conflict of interest statement

JH and DK are co-founders and shareholders of OscillaVent, Inc. and consultants for ZOLL Medical Corporation. JR and EH are co-founders and shareholders of VIDA Diagnostics, Inc., and GC is paid licensing fees from VIDA Diagnostics, Inc.

Figures

Figure 1
Figure 1
Schematic of a step change in airway pressure producing a decaying exponential response in voxel computed tomography (CT) density. At end-inspiration, airway pressure changes from inspiratory pressure (Pinsp) to positive end-expiratory pressure (PEEP) with an inspiratory:expiratory ratio of 1:2. Voxel CT density changes from an end-inspiratory level (DEI) to an end-expiratory level (DEE). Tick marks along the horizontal axis indicate the corresponding breath phases of retrospectively gated four-dimensional computed tomographic images. The duration of inspiration (T) is half that of exhalation (2 T).
Figure 2
Figure 2
Example axial and sagittal views from images of a single representative subject before and after lung injury. From top to bottom, rows show (A) the end-expiratory CT image with lung segmentation (blue line); (B) end-expiratory aeration level; (C) the intratidal density change given by the difference between end-inspiratory and end-expiratory densities; and (D) the regional density time constant (excluding voxels for which exponential regression did not significantly contribute to prediction of variability at the 0.05 significance level).
Figure 3
Figure 3
Aeration levels at end-expiration, end-inspiration, and predicted equilibrium. (A) The fraction of imaged lung volume at each end-expiratory aeration level. (B) The intratidal density change or the difference between end-expiratory density and end-inspiratory density, among voxels at each aeration level. (C) The nonequilibrated remaining density change or the difference between predicted equilibrium density and end-expiratory density, among voxels at each aeration level.
Figure 4
Figure 4
Expiratory time constants estimated for (A) the entire lung based on exponential regression of exhaled volume measured at the proximal end of the endotracheal tube; (B) lung regions based on exponential regression of density changes among voxels at each aeration level; and (C) lung regions based on exponential regression of specific air volume change by corrected Jacobian (SACJ) among voxels at each aeration level.
Figure 5
Figure 5
Correlation between regional time constants estimated for density changes and specific air volume change by corrected Jacobian (SACJ). Average probability density distributions are shown for (A) baseline and (B) injured conditions, including voxels for which both exponential regressions significantly predicted variability in the respective signals at the 0.05 significance level. Dashed line indicates identity. (C) The fraction of subjects exhibiting significant correlations between density and SACJ time constants before and/or after lung injury.
Figure 6
Figure 6
Influence of height and lung condition on regional intratidal density variation. Panels show median and interquartile range at each relative height level along the dorsal-ventral axis for (A) end-inspiratory density, (B) end-expiratory density, (C) the difference between end-expiratory and end-inspiratory densities, and (D) the density time constant.
Figure 7
Figure 7
Distributions of dynamic aeration characteristics before and after lung injury with respect to location on the parametric response map (PRM), aggregated across all subjects. (A) Aggregate PRM showing the average probability density distribution of lung voxels with a given initial (or end-inspiratory) density and equilibrium density. Note that equilibrium density is not necessarily equal to end-expiratory density. The dashed line is the line of identity, indicating no change between end-inspiration and equilibrium. (B) Median density time constants, shown wherever at least half of the subjects exhibited at least five voxels each at the corresponding location of the PRM. (C) The median difference between equilibrium density and end-expiratory density, using the same inclusion criteria as (B).
Figure 8
Figure 8
Characteristics of nonequilibrating density at end-expiration according to the difference between predicted equilibrium density and end-expiratory density, aggregated across all subjects. (A) Average probability density distribution, with increasing vertical distance from the dashed line indicating an increasing lack of convergence to the equilibrium density by end-expiration. (B) Median expiratory time constants, shown wherever at least half of the subjects exhibited at least five voxels each at the corresponding locations of (A).
Figure 9
Figure 9
Relative nonequilibrated density change remaining at end-expiration, according to the difference between predicted equilibrium density and end-expiratory density normalized by the total expected density change from end-inspiration to equilibrium, shown with respect to the estimated density time constant normalized by the total duration allowed for exhalation. A voxel with an estimated density time constant less than one fifth of the exhalation duration is expected to converge to within 0.7%. The black line shows theoretical expected convergence for exponential decay.
Figure 10
Figure 10
Average distributions of density change at different time points during exhalation (A) before and (B) after lung injury. Density change was estimated from exponential regression.
Figure 11
Figure 11
Average distributions of relative gas volume change at different time points during exhalation (A) before and (B) after lung injury.

References

    1. Ballard-Croft C., Wang D., Sumpter L. R., Zhou X., Zwischenberger J. B. (2012). Large-animal models of acute respiratory distress syndrome. Ann. Thorac. Surg. 93, 1331–1339. 10.1016/j.athoracsur.2011.06.107, PMID: - DOI - PubMed
    1. Bates J. H. T., Gaver D. P., Habashi N. M., Nieman G. F. (2020). Atelectrauma versus volutrauma: A tale of two time-constants. Crit. Care Explor. 2:e0299. 10.1097/CCE.0000000000000299, PMID: - DOI - PMC - PubMed
    1. Bates J. H. T., Irvin C. G. (2002). Time dependence of recruitment and derecruitment in the lung: a theoretical model. J. Appl. Physiol. 93, 705–713. 10.1152/japplphysiol.01274.2001, PMID: - DOI - PubMed
    1. Broche L., Perchiazzi G., Porra L., Tannoia A., Pellegrini M., Derosa S., et al. . (2017). Dynamic mechanical interactions between neighboring airspaces determine cyclic opening and closure in injured lung. Crit. Care Med. 45, 687–694. 10.1097/CCM.0000000000002234, PMID: - DOI - PMC - PubMed
    1. Broche L., Pisa P., Porra L., Degrugilliers L., Bravin A., Pellegrini M., et al. . (2019). Individual airway closure characterized in vivo by phase-contrast CT imaging in injured rabbit lung. Crit. Care Med. 47, e774–e781. 10.1097/CCM.0000000000003838, PMID: - DOI - PubMed

LinkOut - more resources