. 2021 Jul 29:12:701198.
doi: 10.3389/fmicb.2021.701198. eCollection 2021.

Generation of a Sleeping Beauty Transposon-Based Cellular System for Rapid and Sensitive Screening for Compounds and Cellular Factors Limiting SARS-CoV-2 Replication

Affiliations

Generation of a Sleeping Beauty Transposon-Based Cellular System for Rapid and Sensitive Screening for Compounds and Cellular Factors Limiting SARS-CoV-2 Replication

Marek Widera et al. Front Microbiol. .

Abstract

The severe acute respiratory syndrome coronavirus 2 (SARS-CoV-2) is the causative agent of the acute respiratory disease COVID-19, which has become a global concern due to its rapid spread. The common methods to monitor and quantitate SARS-CoV-2 infectivity in cell culture are so far time-consuming and labor-intensive. Using the Sleeping Beauty transposase system, we generated a robust and versatile cellular infection model that allows SARS-CoV-2 infection experiments compatible for high-throughput and live cell imaging. The model is based on lung derived A549 cells, which show a profound interferon response and convenient cell culture characteristics. ACE2 and TMPRSS2 were introduced for constitutive expression (A549-AT). Subclones with varying levels of ACE2/TMPRSS2 were screened for optimal SARS-CoV-2 susceptibility. Furthermore, extensive evaluation demonstrated that SARS-CoV-2 infected A549-AT cells were distinguishable from mock-infected cells and already showed approximately 12 h post infection a clear signal to noise ratio in terms of cell roughness, fluorescence and a profound visible cytopathic effect. Moreover, due to the high transfection efficiency and proliferation capacity, Sleeping Beauty transposase-based overexpression cell lines with a second inducible fluorescence reporter cassette (eGFP) can be generated in a very short time, enabling the investigation of host and restriction factors in a doxycycline-inducible manner. Thus, the novel model cell line allows rapid and sensitive monitoring of SARS-CoV-2 infection and the screening for host factors essential for viral replication.

Keywords: COVID-19; CPE; SARS-CoV-2; corona virus; drug screening; high throughput; infection model; live cell imaging.


Conflict of interest statement

The authors declare that the research was conducted in the absence of any commercial or financial relationships that could be construed as a potential conflict of interest.

Figures

FIGURE 1
FIGURE 1
Susceptibility of cell lines to type I–III interferons. Vero, Caco2, and A549 cells were stimulated with the indicated type I/III (500 U/mL) and type II interferons (10 ng/mL). (A) After 24 h, total RNA was isolated and subjected to RT-qPCR analysis. ISG15 (under control of ISRE promoter) was used as a surrogate marker for IFN-I and III. Activation of the type II interferon pathway was monitored by IRF1 expression (under control of the GAS promoter). (B,C) Time course of ISG15 and IRF1 gene expression in Caco2 and A549 cells. RNA was isolated at the indicated time point and subjected to RT-qPCR analysis. Expression was calculated using the Δct method and beta actin as housekeeping gene. Error bars indicate SD from three biological replicates. *p < 0.05, **p ≤ 0.01, and ***p ≤ 0.001.
FIGURE 2
FIGURE 2
Cell culture characteristics of A549 and Caco2 cells. (A) Growth curves of Caco2 and A549 cells were shown in 12-well plates with low density (2 × 10⁴ A549-AT/well; 1 × 10⁵ Caco2/well). The relative confluence was monitored automatically using live cell imaging SparkCyto 400 (Tecan) over a period of 198 h. After 48 h, each well was washed with PBS to remove unattached cells. (B) Trypsinization properties of A549 and Caco2 cells. Cells were seeded in 96-well plates, treated with trypsin/EDTA and incubated for the indicated time. For incubation times longer than 10 min cells were incubated at 37°C, otherwise at room temperature. (C,D) To determine transfection efficiency, A549 and Caco2 cells were transiently transfected with an eGFP-encoding plasmid (pSBtet GP). After 48 h, eGFP fluorescence was detected. (D) DAPI normalized green object count of Caco2 and A549 cells 24 and 48 h post transfection. Error bars indicate SD from three biological replicates. *p < 0.05, **p ≤ 0.01, and ***p ≤ 0.001.
FIGURE 3
FIGURE 3
Constructs used for the generation of A549-AT model cells. Schematic drawing of plasmids (A) pSBbi RB-ACE2 and (B) pSBbi BH-TMPRSS2 including locations of open reading frames (ORFs), transcriptional start sites of the promoters (EF1alpha, RPBSA), inverted terminal repeats (ITR), polyadenylation signals (pA), FLAG epitope (FLAG), 2A self-cleaving peptide (P2A). ACE2 and TMPRSS2 ORFs are marked in black. The ORFs encoding dTomato and BFP are highlighted in red and blue, respectively. The antibiotic resistance cassettes coding for blasticidin S deaminase gene (BSD) and the Hygromycin resistance gene (HygR) are indicated in gray.
FIGURE 4
FIGURE 4
Susceptibility of A549 derived cell lines to SARS-CoV-2. Caco2, A549 cells, and derivates were infected with SARS-CoV or SARS-CoV-2 strain FFM1, respectively and total RNA was isolated 24 h post infection or as indicated (0.01 MOI or as depicted). (A,B) Relative expression of SARS-CoV-2 sgRNA was used as surrogate markers to quantify active viral replication. (C,D) Relative expression of ISG15 and IFITM1 (fold change) were determined using RT-qPCR to monitor interferon signaling in SARS-CoV and SARS-CoV-2 infected cells (MOI 0.1). *p < 0.05, **p < 0.01 and ***p < 0.001.
FIGURE 5
FIGURE 5
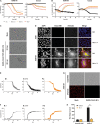
Monitoring of SARS-CoV-2 infection and CPE formation. (A,B) Caco2 and A549-AT cells were infected with SARS-CoV-2 strain FFM1 with the indicated MOI. Relative confluency and roughness of infected cells was analyzed in an automated live-cell-imaging system in continuous measurement over the specified period in 37°C and 5% CO2. (C) Imaging of SARS-CoV-2 (FFM1) infected A549-AT cells showing induced syncytia and CPE formation. (D) Fluorescence imaging of SARS-CoV-2 (B.1 and B.1.1.7) infected parental A549 and A549-AT cells. SARS-CoV-2 Spike was stained with an Alexa-488-coupled antibody and cellular dTomato was used to visualize syncytia formation. (E,F) Relative confluency and roughness of cells infected with SARS-CoV-2 variants B.1 (FFM7), B.1.1.7, and P.2. Analysis was performed as described in A. (G) Representative fluorescence imaging of A549-AT cells constitutively expressing dTomato enabling the detection of SARS-CoV-2 induced cell lysis. (H) Red object count was used to quantitate the loss of dTomato fluorescence in SARS-CoV-2 infected cells shown in E. The figure shows the representative results of at least two independent experiments. ***p < 0.001.
FIGURE 6
FIGURE 6
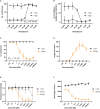
Antiviral activity of remdesivir and camostat against SARS-CoV-2 using A549-AT cells. (A–F) Evaluation of antiviral activity of remdesivir (n = 3) and camostat (n = 6) against SARS-CoV-2 (1, 3, 24, or 48 h post infection as indicated). Relative confluency (A,C) and roughness (B,D) were measured as surrogate marker to monitor for SARS-CoV-2 induced CPE formation. Prior to infection, cells were treated with the indicated concentrations of remdesivir and camostat, respectively. (E) Relative fluorescence intensity (RFI) and (F) red object count (ROC) were determined alternatively to confluency and roughness. Error bars indicate standard deviation from at least three biological replicates.
FIGURE 7
FIGURE 7
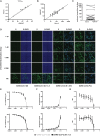
Correlation of neutralization and TCID50 test results obtained with A549-AT and CaCo2 cells. Representative results of two biological replicates confirmed in Caco2 cells are depicted. (A) Correlation of SARS-CoV-2 TCID50 titers determined using A549-AT and Caco2 cells. (B,C) Reciprocal SARS-CoV-2 microneutralization titers resulting in 50% virus neutralization (NT50). The values indicate mean values from two replicates per cell line. (D) Neutralization titers against SARS-CoV-2 variants B (FFM1), B.1.1.7, B.1.351, and P.2. The mAb solution containing bamlanivimab (LY-CoV555) was serially diluted (1:2) and incubated with 100 TCID50/well. Cells were inoculated and analyzed for a CPE formation after 72 h. Immunofluorescence staining was performed using spike antibody and a secondary antibody coupled to Alexa488 for detection. DAPI was used to stain nuclei. (E) Relative confluency and (F) roughness of SARS-CoV-2 B and B.1.1.7 infected A549-AT cells were measured as surrogate marker to monitor for SARS-CoV-2 induced CPE formation at the indicated timepoints. (G) Normalized mean of relative fluorescence intensity (RFI) measured at five spots per well. Error bars indicate standard deviation from at least three biological replicates.
FIGURE 8
FIGURE 8
Inducible overexpression of host factors in A549-AT cells. (A) Graphical overview of A549-AT cells constitutively expressing ACE2/dTomato (red), TMPRSS2/BFP (blue), and doxycycline inducible gene of interest (green). (B) Schematic drawing of plasmid pSBtet –GOI –GP including locations of open reading frames (ORFs), transcriptional start sites of the indicated promoters (tight TCE, RPBSA), inverted terminal repeats (ITR), polyadenylation signals (pA), SfiI sites for cloning (SfiI), and the reverse tetracycline-controlled transactivator (rtTA). The ORF of the GOI is marked in black. The ORFs encoding eGFP is highlighted in green. The antibiotic resistance cassette encoding the puromycin resistance gene (PuroR) is indicated in gray. (C) Western blot analysis of A549-AT and Caco2 cells stably transfected with a FLAG-tagged IFITM1 encoding construct illustrated in B. (D) A549-AT cells overexpressing the host restriction factor IFITM1 were infected with SARS-CoV-2 and total cellular RNA was subjected to RT-qPCR analysis at the indicated time points (n = 3). Relative expression of sgRNA 8 in Dox-induced or mock cells was used as surrogate marker for viral entry and active SARS-CoV-2 replication. (E) Cell viability of Dox and mock treated A549-AT cells was determined using a microplate reader with cell imaging and real time – cytometry. Cell viability was analyzed after doxycycline induction measuring cellular confluency.

References

    1. Andreakos E., Tsiodras S. (2020). COVID-19: lambda interferon against viral load and hyperinflammation. EMBO Mol. Med. 12:e12465. - PMC - PubMed
    1. Belouzard S., Chu V. C., Whittaker G. R. (2009). Activation of the SARS coronavirus spike protein via sequential proteolytic cleavage at two distinct sites. Proc. Natl. Acad. Sci. U. S. A. 106 5871–5876. 10.1073/pnas.0809524106 - DOI - PMC - PubMed
    1. Bestle D., Heindl M. R., Limburg H., Van Lam Van T., Pilgram O., Moulton H., et al. (2020). TMPRSS2 and furin are both essential for proteolytic activation of SARS-CoV-2 in human airway cells. Life Sci. Alliance 3:e202000786. 10.26508/lsa.202000786 - DOI - PMC - PubMed
    1. Bojkova D., Bechtel M., Mclaughlin K. M., Mcgreig J. E., Klann K., Bellinghausen C., et al. (2020a). Aprotinin Inhibits SARS-CoV-2 Replication. Cells 9:2377. 10.3390/cells9112377 - DOI - PMC - PubMed
    1. Bojkova D., Klann K., Koch B., Widera M., Krause D., Ciesek S., et al. (2020b). Proteomics of SARS-CoV-2-infected host cells reveals therapy targets. Nature 583 469–472. 10.1038/s41586-020-2332-7 - DOI - PMC - PubMed