. 2021 Jul 30:12:713989.
doi: 10.3389/fimmu.2021.713989. eCollection 2021.

Pathogenetic Interplay Between IL-6 and Tryptophan Metabolism in an Experimental Model of Obesity

Affiliations

Pathogenetic Interplay Between IL-6 and Tryptophan Metabolism in an Experimental Model of Obesity

Giada Mondanelli et al. Front Immunol. .

Abstract

Obesity is a metabolic disease characterized by a state of chronic, low-grade inflammation and dominated by pro-inflammatory cytokines such as IL-6. Indoleamine 2,3-dioxygenase 1 (IDO1) is an enzyme that catalyzes the first step in the kynurenine pathway by transforming l-tryptophan (Trp) into l-kynurenine (Kyn), a metabolite endowed with anti-inflammatory and immunoregulatory effects. In dendritic cells, IL-6 induces IDO1 proteasomal degradation and shuts down IDO1-mediated immunosuppressive effects. In tumor cells, IL-6 upregulates IDO1 expression and favors tumor immune escape mechanisms. To investigate the role of IDO1 and its possible relationship with IL-6 in obesity, we induced the disease by feeding mice with a high fat diet (HFD). Mice on a standard diet were used as control. Experimental obesity was associated with high IDO1 expression and Kyn levels in the stromal vascular fraction of visceral white adipose tissue (SVF WAT). IDO1-deficient mice on HFD gained less weight and were less insulin resistant as compared to wild type counterparts. Administration of tocilizumab (TCZ), an IL-6 receptor (IL-6R) antagonist, to mice on HFD significantly reduced weight gain, controlled adipose tissue hypertrophy, increased insulin sensitivity, and induced a better glucose tolerance. TCZ also induced a dramatic inhibition of IDO1 expression and Kyn production in the SVF WAT. Thus our data indicated that the IL-6/IDO1 axis may play a pathogenetic role in a chronic, low-grade inflammation condition, and, perhaps most importantly, IL-6R blockade may be considered a valid option for obesity treatment.

Keywords: IL-6 receptor (IL-6R); experimental obesity; high fat diet (HFD); indoleamine 2, 3 dioxygenase 1 (IDO1); tocilizumab (TCZ); tryptophan metabolism; white adipose tissue (WAT).


Conflict of interest statement

The authors declare that the research was conducted in the absence of any commercial or financial relationships that could be construed as a potential conflict of interest.

Figures
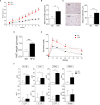
Figure 1
Figure 1
Obesity and inflammatory parameters of HFD-fed mice. (A) Body weight (g) of 6-wk male mice fed with high-fat diet (HFD, n = 10) for 10 wk compared with gender- and age-matched controls fed with a standard diet (SD, n = 10). (B) Average food intake (g) per mouse per day (n = 10, from two independent experiments). (C) Hematoxylin and eosin staining of visceral WATs (left panel, scale bars of 100 μm.). Analysis of adipocyte diameter (right panel). (D) Average WAT weight (g) per mouse (n = 5, from two independent experiments). (E) Intraperitoneal glucose tolerance test (IPGTT) after 10 weeks of HFD (n = 5, from two independent experiments). Glycaemia (mg/dl) was measured at different time points (0, 15, 30, 60, and 120 min) from the administration of glucose. (F) Levels of cytokines secreted by SVF WAT cells in 24-h culture supernatants. Results are represented as means ± S.D (n = 3 biological replicates, from two independent experiments). *p < 0.05, **p < 0.01, ***p < 0.001 HFD versus SD, two-tailed unpaired Student’s t test and multiple Student’s t test per row, corrected by post hoc Sidak-Bonferroni’s method.
Figure 2
Figure 2
IDO1 expression and activity in diet-induced obesity. Expression of IDO1 gene (A) and protein (B) in SVF WAT cells of HFD versus SD mice after 10 weeks of diet. (C) Quantitative analysis of immunoblots from two independent ex vivo experiments, one of which represented in (B). Data (mean ± S.D., n = 3 biological replicates) represent the ratio of tubulin-normalized IDO1 protein in SVF WAT from mice on HFD to that expressed in SD control counterparts. (D) Levels of Kyn (mean ± S.D., n = 3 biological replicates) secreted by SVF WAT cells in 24-h culture supernatants. *p < 0.05, **p < 0.01, HFD versus SD (two-tail unpaired Student’s t test for C, D). (E) Body weight gain of WT and Ido1−/− mice throughout 9 wk of high-fat diet (HFD, n = 10) treatment compared with gender- and age-matched controls fed with a standard diet (SD, n = 10). *p < 0.05, HFD WT versus HFD Ido1−/− mice, ANOVA followed by post hoc Bonferroni’s method. (F) Intraperitoneal glucose tolerance test (IPGTT) after 9 wk of HFD (n = 5, from two independent experiments). Glycaemia (mg/dl) at different time points (0, 15, 30, 60, and 120 min) from the administration of glucose. (G) Hematoxylin and eosin staining of visceral WAT (left panel, scale bars are 100 μm.). Analysis of adipocyte diameter (right panel). **p < 0.01, ***p < 0.001 HFD versus SD mice per genotype (ANOVA followed by post hoc Bonferroni’s method for F, G).
Figure 3
Figure 3
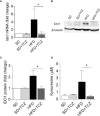
TCZ inhibits IDO1 expression in SVF WAT. (A) Gene transcription of Ido1 in SVF WAT cells after 9 wk of diet. Data (mean ± S.D., n = 3 biological replicates, from two independent experiments) represent the fold change expression of Gapdh-normalized transcripts in which the calibrator is represented by SVF WAT from SD-fed mice (fold change = 1; dotted line). (B) IDO1 protein expression in SVF WAT cells and quantitative analysis (C) of immunoblots from two independent ex vivo experiments, one of which shown in (B). Data (mean ± S.D., n = 3 biological replicates, from two independent experiments) represent the ratio of tubulin-normalized IDO1 protein expression in SVF cells from HFD-fed mice to that expressed in SVF from animals on SD (n=3 mice per group). (D) Levels of Kyn (mean ± S.D., n = 3 biological replicates, from two independent experiments) secreted by SVF WAT cells in 24−h culture supernatants. *p < 0.05 (ANOVA followed by post hoc Bonferroni’s method for A, C, D).
Figure 4
Figure 4
TCZ effects in diet-induced obesity. (A, D) Body weight (g) of HFD-fed mice receiving TCZ 5 mg/Kg (HFD TCZ, n = 8) or saline (HFD, n = 8) administered i.p. compared with gender- and age-matched controls fed with a standard diet (SD, n = 8). TCZ treatment started with HFD (A) or 2 wk later (D) and ended after 4 and 6 weeks, respectively, in A and D (grey box). (B, E) Hematoxylin and eosin staining of visceral WAT (left panel, scale bars of 100 μm.). Analysis of adipocyte diameter (right panel). (C, F) Intraperitoneal glucose tolerance test (IPGTT) at the end of TCZ treatment. Glycaemia (mg/dl) was measured at different time points (0, 15, 30, 60, and 120 min) from the administration of glucose. (G, H) Immunoblot and quantitative analysis of insulin-driven AKT phosphorylation in ex vivo hepatocytes from mice represented in (D). Data from two independent experiments (means ± S.D., n = 3 biological replicates per group) represent the fold change of the pAKT/AKT ratio in hepatocytes stimulated with insulin at the indicated times in which the calibrator is represented by pAKT/AKT ratio at time 0. (I) Gene transcription of Ucp1 in SVF WAT cells from mice represented in (D). Data (mean ± S.D., n = 3 biological replicates per group) represent the fold change expression of Gapdh-normalized transcripts in which the calibrator is represented by samples from SVF WAT from SD-fed mice (fold change=1; dotted line). *p < 0.05, **p < 0.01, ***p < 0.001; HFD TCZ versus HFD (ANOVA followed by post hoc Bonferroni’s method).

References

    1. Jones SA, Jenkins BJ. Recent Insights Into Targeting the IL-6 Cytokine Family in Inflammatory Diseases and Cancer. Nat Rev Immunol (2018) 18:773–89. 10.1038/s41577-018-0066-7 - DOI - PubMed
    1. Hunter CA, Jones SA. IL-6 as a Keystone Cytokine in Health and Disease. Nat Immunol (2015) 16:448–57. 10.1038/ni.3153 - DOI - PubMed
    1. Johnson DE, O’Keefe RA, Grandis JR. Targeting the IL-6/JAK/STAT3 Signalling Axis in Cancer. Nat Rev Clin Oncol (2018) 15:234–48. 10.1038/nrclinonc.2018.8 - DOI - PMC - PubMed
    1. Grohmann U, Fallarino F, Puccetti P. Tolerance, DCs and Tryptophan: Much Ado About IDO. Trends Immunol (2003) 24:242–8. 10.1016/S1471-4906(03)00072-3 - DOI - PubMed
    1. Mellor AL, Munn DH. IDO Expression by Dendritic Cells: Tolerance and Tryptophan Catabolism. Nat Rev Immunol (2004) 4:762–74. 10.1038/nri1457 - DOI - PubMed

Publication types

MeSH terms